Diagnostic Information Fusion for Manufacturing Processes
Diagnostic Information Fusion for Manufacturing Processes
Diagnostic Information Fusion for Manufacturing Processes

You also want an ePaper? Increase the reach of your titles
YUMPU automatically turns print PDFs into web optimized ePapers that Google loves.
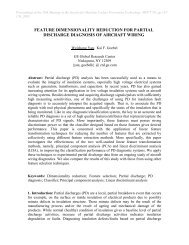
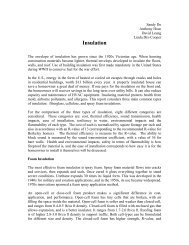
ACOUSTIC EMISSION<br />
SENSOR SPINDLE<br />
ACOUSTIC EMISSION<br />
SENSOR TABLE<br />
PREAMPLIFIER<br />
PREAMPLIFIER<br />
RMS<br />
RMS<br />
1.2<br />
1<br />
The output<br />
Original<br />
Smoothed<br />
VIBRATION SENSOR<br />
SPINDLE<br />
CHARGE AMPLIFIER<br />
LP/HP FILTER<br />
RMS<br />
COMPUTER<br />
0.8<br />
VIBRATION SENSOR<br />
TABLE<br />
SPINDLE MOTOR<br />
CURRENT SENSOR<br />
CHARGE AMPLIFIER<br />
LP/HP FILTER<br />
RMS<br />
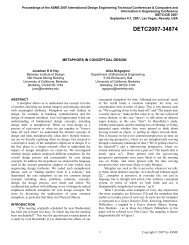
Degree of wear<br />
0.6<br />
0.4<br />
RECORDER<br />
Fig. 3: Experimental setup<br />
0.2<br />
0<br />
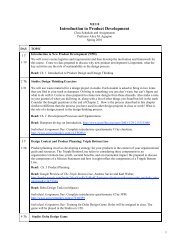
Input data trans<strong>for</strong>mations<br />
Be<strong>for</strong>e being used, the following trans<strong>for</strong>mations<br />
were applied to the data:<br />
1.) The data was smoothed by averaging using a<br />
window of 50 points, and then the sample size was<br />
reduced by sampling the resulting data set at 50 point<br />
intervals. 2.) Each input and the output data was<br />
normalized to lie between 0 and 1. 3.) Since the<br />
output variable was sampled at much larger intervals<br />
than the input variables, and since it represents tool<br />
wear, the output data was further smoothed by fitting<br />
a 3rd order polynomial.<br />
Fig. 4 and Fig. 5 show the normalized and smoothed<br />
input and output data. The output<br />
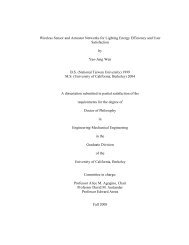
data was categorized into four classes using fuzzy<br />
membership functions.<br />
−0.2<br />
0 200 400 600 800 1000 1200 1400<br />
Sample number<br />
Fig. 5: Ouput data<br />
Degree of membership<br />
1<br />
0.9<br />
0.8<br />
0.7<br />
0.6<br />
0.5<br />
0.4<br />
0.3<br />
0.2<br />
Membership functions <strong>for</strong> the output classes<br />
1<br />
0.9<br />
0.8<br />
0.7<br />
0.6<br />
0.5<br />
0.4<br />
0.3<br />
0.2<br />
0.1<br />
The inputs<br />
0<br />
0 200 400 600 800 1000 1200 1400<br />
Sample number<br />
Fig. 4: Input data<br />
0.1<br />
0<br />
0 0.1 0.2 0.3 0.4 0.5 0.6 0.7 0.8 0.9 1<br />
Degree of wear<br />
Fig. 6: Membership functions<br />
<strong>Diagnostic</strong> tools employed<br />
Nearest neighbor classifier (NNBR): The first<br />
subsystem uses a nearest neighbor scheme <strong>for</strong><br />
classifying the data. The case base consists of a set of<br />
sensor readings and the associated unclassified wear<br />
value. Given an input, the k nearest data points are<br />
determined and the associated wear values are<br />
averaged. This average is then used to compute the<br />
membership degree <strong>for</strong> each of the four classes.<br />
Neural network (NN1): The second subsystem is a<br />
neural network that was trained on binary classes.<br />
That is, the target values were 0 and 1 vectors<br />
determined by the maximum membership value over<br />
the four classes.<br />
Neural network (NN2): The third subsystem is also a<br />
neural network, but this was trained to learn the<br />
membership values themselves, as opposed to the<br />
classes.<br />
Fuzzy inference system (RM): The fourth subsystem<br />
is a fuzzy inference system implemented using a<br />
relation matrix.