Brief Facts of H.P. - Government of Himachal Pradesh
Brief Facts of H.P. - Government of Himachal Pradesh
Brief Facts of H.P. - Government of Himachal Pradesh

Create successful ePaper yourself
Turn your PDF publications into a flip-book with our unique Google optimized e-Paper software.
7<br />
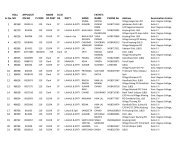
Sl<br />
No<br />
District No. <strong>of</strong><br />
inhabited<br />
villages<br />
2001<br />
II-AREA AND POPULATION<br />
2.1- AREA AND POPULATIN<br />
Area<br />
(’000<br />
sq.<br />
kms.)<br />
Population<br />
2011<br />
Census<br />
Density Decennial<br />
per sq. growth rate<br />
km. 2001-2011<br />
2011 percentage)<br />
Census<br />
1 2 3 4 5 6 7<br />
1 Bilaspur 965 1.2 381956 327 +12.0<br />
2 Chamba 1,118 6.5 519080 80 +12.6<br />
3 Hamirpur 1,635 1.1 454768 407 +10.2<br />
4 Kangra 3,619 5.7 1510075 263 +12.8<br />
5 Kinnaur 234 6.4 84121 13 +7.4<br />
6 Kullu 172 5.5 437903 80 +14.8<br />
7 Lahaul-<br />
Spiti 287 13.9 31564 2 -5.0<br />
8 Mandi 2,833 4.0 999777 253 +10.9<br />
9 Shimla 2,520 5.2 814010 159 +12.7<br />
10 Sirmaur 966 2.8 529855 188 +15.5<br />
11 Solan 2,388 1.9 580320 300 +15.9<br />
12 Una 758 1.5 521173 338 +16.3<br />
<strong>Himachal</strong><br />
<strong>Pradesh</strong> 17,495 55.7 6864602 123 +12.9<br />
Source- Census <strong>of</strong> India, 2011.