Multi-wavelength TCSPC lifetime imaging - Becker & Hickl
Multi-wavelength TCSPC lifetime imaging - Becker & Hickl
Multi-wavelength TCSPC lifetime imaging - Becker & Hickl

Create successful ePaper yourself
Turn your PDF publications into a flip-book with our unique Google optimized e-Paper software.
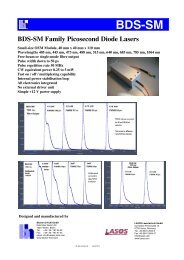
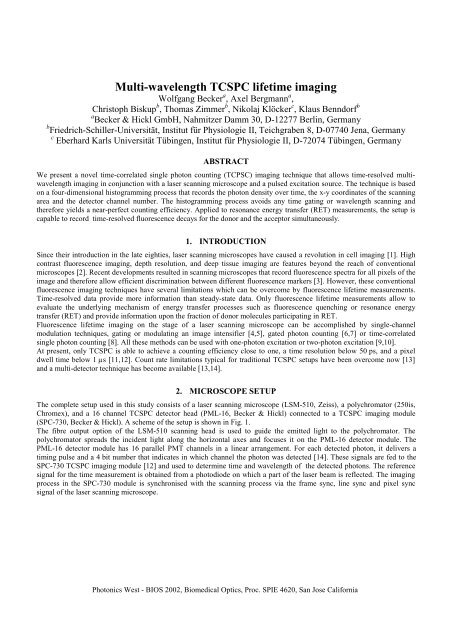
<strong>Multi</strong>-<strong>wavelength</strong> <strong>TCSPC</strong> <strong>lifetime</strong> <strong>imaging</strong><br />
Wolfgang <strong>Becker</strong> a , Axel Bergmann a ,<br />
Christoph Biskup b , Thomas Zimmer b , Nikolaj Klöcker c , Klaus Benndorf b<br />
a <strong>Becker</strong> & <strong>Hickl</strong> GmbH, Nahmitzer Damm 30, D-12277 Berlin, Germany<br />
b Friedrich-Schiller-Universität, Institut für Physiologie II, Teichgraben 8, D-07740 Jena, Germany<br />
c Eberhard Karls Universität Tübingen, Institut für Physiologie II, D-72074 Tübingen, Germany<br />
ABSTRACT<br />
We present a novel time-correlated single photon counting (TCPSC) <strong>imaging</strong> technique that allows time-resolved multi<strong>wavelength</strong><br />
<strong>imaging</strong> in conjunction with a laser scanning microscope and a pulsed excitation source. The technique is based<br />
on a four-dimensional histogramming process that records the photon density over time, the x-y coordinates of the scanning<br />
area and the detector channel number. The histogramming process avoids any time gating or <strong>wavelength</strong> scanning and<br />
therefore yields a near-perfect counting efficiency. Applied to resonance energy transfer (RET) measurements, the setup is<br />
capable to record time-resolved fluorescence decays for the donor and the acceptor simultaneously.<br />
1. INTRODUCTION<br />
Since their introduction in the late eighties, laser scanning microscopes have caused a revolution in cell <strong>imaging</strong> [1]. High<br />
contrast fluorescence <strong>imaging</strong>, depth resolution, and deep tissue <strong>imaging</strong> are features beyond the reach of conventional<br />
microscopes [2]. Recent developments resulted in scanning microscopes that record fluorescence spectra for all pixels of the<br />
image and therefore allow efficient discrimination between different fluorescence markers [3]. However, these conventional<br />
fluorescence <strong>imaging</strong> techniques have several limitations which can be overcome by fluorescence <strong>lifetime</strong> measurements.<br />
Time-resolved data provide more information than steady-state data. Only fluorescence <strong>lifetime</strong> measurements allow to<br />
evaluate the underlying mechanism of energy transfer processes such as fluorescence quenching or resonance energy<br />
transfer (RET) and provide information upon the fraction of donor molecules participating in RET.<br />
Fluorescence <strong>lifetime</strong> <strong>imaging</strong> on the stage of a laser scanning microscope can be accomplished by single-channel<br />
modulation techniques, gating or modulating an image intensifier [4,5], gated photon counting [6,7] or time-correlated<br />
single photon counting [8]. All these methods can be used with one-photon excitation or two-photon excitation [9,10].<br />
At present, only <strong>TCSPC</strong> is able to achieve a counting efficiency close to one, a time resolution below 50 ps, and a pixel<br />
dwell time below 1 µs [11,12]. Count rate limitations typical for traditional <strong>TCSPC</strong> setups have been overcome now [13]<br />
and a multi-detector technique has become available [13,14].<br />
2. MICROSCOPE SETUP<br />
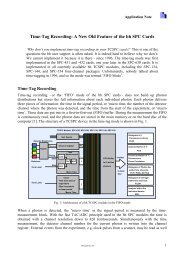
The complete setup used in this study consists of a laser scanning microscope (LSM-510, Zeiss), a polychromator (250is,<br />
Chromex), and a 16 channel <strong>TCSPC</strong> detector head (PML-16, <strong>Becker</strong> & <strong>Hickl</strong>) connected to a <strong>TCSPC</strong> <strong>imaging</strong> module<br />
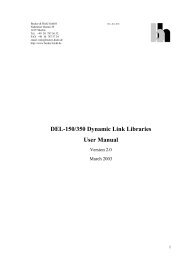
(SPC-730, <strong>Becker</strong> & <strong>Hickl</strong>). A scheme of the setup is shown in Fig. 1.<br />
The fibre output option of the LSM-510 scanning head is used to guide the emitted light to the polychromator. The<br />
polychromator spreads the incident light along the horizontal axes and focuses it on the PML-16 detector module. The<br />
PML-16 detector module has 16 parallel PMT channels in a linear arrangement. For each detected photon, it delivers a<br />
timing pulse and a 4 bit number that indicates in which channel the photon was detected [14]. These signals are fed to the<br />
SPC-730 <strong>TCSPC</strong> <strong>imaging</strong> module [12] and used to determine time and <strong>wavelength</strong> of the detected photons. The reference<br />
signal for the time measurement is obtained from a photodiode on which a part of the laser beam is reflected. The <strong>imaging</strong><br />
process in the SPC-730 module is synchronised with the scanning process via the frame sync, line sync and pixel sync<br />
signal of the laser scanning microscope.<br />
Photonics West - BIOS 2002, Biomedical Optics, Proc. SPIE 4620, San Jose California
Zeiss<br />
channel<br />
bh<br />
SPC-730 <strong>TCSPC</strong> Imaging Module<br />
start<br />
stop<br />
Detector<br />
PML-16<br />
Polychromator<br />
250is<br />
Ti:Sa Laser<br />
78 MHz 150 fs<br />
Fibre Output<br />
LSM-510<br />
Scanning<br />
Head<br />
Axiovert<br />
Pixel Clock, Line Clock, Frame Clock<br />
User I/O<br />
Microscope<br />
Control<br />
Box<br />
Fig. 1: Setup of the multi-<strong>wavelength</strong> <strong>lifetime</strong> microscope<br />
3. MULTICHANNEL <strong>TCSPC</strong> IMAGING<br />
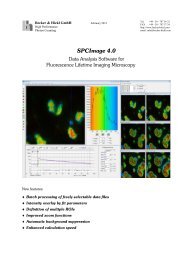
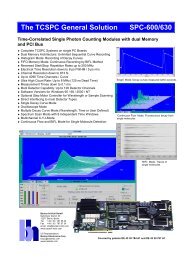
The principle of the <strong>TCSPC</strong> <strong>imaging</strong> technique is shown in fig. 2. The recording electronics consists of a time measurement<br />
channel, a scanning interface, a detector channel register, and a large histogram memory.<br />
Detector<br />
Channel<br />
Channel register<br />
n<br />
Channel / Wavelength<br />
Timing<br />
Start<br />
Stop<br />
from Laser<br />
CFD<br />
CFD<br />
Time<br />
Measurement<br />
TAC ADC<br />
t<br />
Time within decay curve<br />
Frame Sync<br />
Line Sync<br />
Pixel Clock<br />
from<br />
Microscope<br />
Counter Y<br />
Scanning<br />
Interface<br />
Counter X<br />
y<br />
x<br />
Histogram<br />
Memory<br />
Detector<br />
channel 1<br />
Location within scanning area<br />
Histogram<br />
Memory<br />
Detector<br />
channel ......<br />
Histogram<br />
Memory<br />
Detector<br />
channel .....<br />
Histogram<br />
Memory<br />
Detector<br />
channel 16<br />
Fig. 2: <strong>Multi</strong>channel <strong>TCSPC</strong> <strong>imaging</strong><br />
Photonics West - BIOS 2002, Biomedical Optics, Proc. SPIE 4620, San Jose California
The time measurement channel contains the usual building blocks (CFDs, TAC, ADC) in the ‘reversed start-stop’<br />
configuration. For each photon, it determines the detection time (t) with respect to the next laser pulse. The scanning<br />
interface is a system of counters which receive the scan control signals (frame sync, line sync and pixel clock) from the<br />
microscope. It determines the current location (x and y) of the laser spot in the scanning area.<br />
Synchronously with the detection of a photon, the detector channel number (n) for the current photon is read into the<br />
detector channel register. If a polychromator is used in front of the detector, n represents the <strong>wavelength</strong> range of the<br />
detected photon.<br />
The obtained values for t, x, y and n are used to address the histogram memory. Thus, in the memory the distribution of the<br />
photons over time, <strong>wavelength</strong>, and the image coordinates is built up. The result can be interpreted as a set of 16 image<br />
stacks for different <strong>wavelength</strong>s. Each stack contains 64 images for subsequent times after the excitation.<br />
It should be pointed out that the histogramming process does not use any time gating or <strong>wavelength</strong> scanning. Therefore, the<br />
method yields a near perfect counting efficiency and a maximum signal to noise ratio for a given acquisition time. Due to<br />
the short dead time of the <strong>TCSPC</strong> <strong>imaging</strong> electronics (180 ns) there is virtually no loss of photons for count rates up to a<br />
few 10 5 /s as they are typical for cell <strong>imaging</strong>.<br />
The data acquisition runs at any desired scanning speed of the microscope. The data acquisition can be repeated as often as<br />
necessary to collect enough photons. Due to the synchronisation via the scan clock pulses, the zoom and image rotation<br />
functions of the microscope act also automatically on the <strong>TCSPC</strong> recording and can be used in the usual way.<br />
4. RESULTS<br />
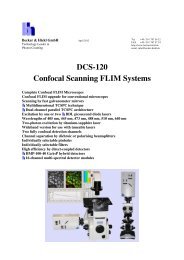
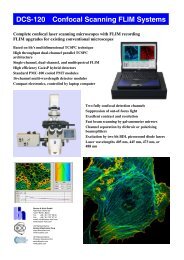
Fig. 3 shows a HEK 293 cell expressing a hybrid protein in which the cyan (CFP) and yellow (YFP) shifted mutants of the<br />
green fluorescent protein are linked together by a short amino acid chain. The image was obtained by summing the photons<br />
from all time channels of the CFP fluorescence.<br />
A<br />
CFP<br />
B<br />
Fig. 3: HEK 293 cell expressing a CFP-YFP hybrid protein<br />
A) Intensity image of CFP. B) Fluorescence decay curves of CFP and YFP in a selected region (square in A).<br />
Fluorescence decay analysis in a selected region (small square) reveals a bi-exponential decay for both, CFP and YFP. The<br />
intensity coefficient of the fast component is positive for CFP and negative for YFP, indicating that energy is transferred<br />
from CFP to YFP.<br />
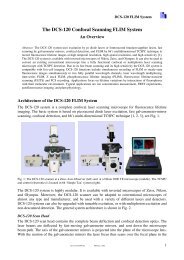
While the <strong>lifetime</strong> of the fast decay component is a measure of the distance between the RET partners the ratio of the<br />
intensity coefficients of the decay components is an indicator of the ratio of quenched to unquenched molecules. In Fig. 4<br />
intensity is encoded by the brightness, and the ratio of the coefficients is encoded by the color of a pixel. The results are<br />
shown for the CFP and the YFP fluorescence. Due to the fixed link between CFP and YFP, almost no variation is observed<br />
in the ratio of the coefficients.<br />
Photonics West - BIOS 2002, Biomedical Optics, Proc. SPIE 4620, San Jose California
A<br />
CFP<br />
B<br />
YFP<br />
0.40<br />
0.80<br />
-0.65 -0.15<br />
Fig. 4 : RET images for CFP (A) and YFP (B) of a HEK cell expressing a hybrid protein in which CFP and YFP are linked together by a<br />
short peptide. Intensity is encoded by the brightness of a pixel. The color is determined by the ratio of the amplitudes of the fast and slow<br />
decay components.<br />
A<br />
B<br />
CFP<br />
YFP<br />
x48 y32<br />
x48 y32<br />
x44 y20<br />
x44 y20<br />
0, 2.50 7.0<br />
0, 3.0 0<br />
20.0<br />
Fig. 5: RET image for CFP (A) and YFP (B) of a HEK293 cell expressing two interacting proteins. Intensity is encoded by the brightness<br />
of a pixel. The color is determined by the ratio of the amplitudes of the fast and slow decay components.<br />
Fig. 5 shows RET images of a HEK293 cell, expressing two interacting proteins, which are labeled with a CFP and YFP,<br />
respectively. The RET image of the donor (CFP) shows significant variations in the ratio of the amplitudes of the fast and<br />
slow decay component. The maximum of this ratio (at x48 y32) coincides with a dark spot in the intensity image of CFP<br />
and a bright spot in the intensity image of the acceptor fluorescence. These findings suggest that energy is transferred from<br />
CFP (donor) to YFP (acceptor) in this area.<br />
Photonics West - BIOS 2002, Biomedical Optics, Proc. SPIE 4620, San Jose California
However, the biexponential fit of the fluorescence decay in the <strong>wavelength</strong> range of the acceptor (Fig. 6) does not yield a<br />
fast decay component with a negative amplitude. In contrast to this, the fast decay component has a high positive amplitude.<br />
This finding might be caused by the spectral overlap of the emission spectrum of CFP and YFP. In this example, the<br />
stoichiometry between CFP and YFP is not fixed so that an excess of CFP fluorescence can bias the YFP fluorescence<br />
signal considerably.<br />
Figure 6: Fluorescence decay curves for CFP (A) and YFP (B) in selected regions of Figure 5.<br />
5. CONCLUSIONS<br />
A new <strong>TCSPC</strong> <strong>imaging</strong> technique in conjunction with a laser scanning microscope and a pulsed excitation source yields<br />
time- and <strong>wavelength</strong> resolved fluorescence images. Applied to RET measurements in living cells, the technique delivers<br />
the decay components of the donor and acceptor fluorescence in all pixels of the image. The data can be used to create<br />
images showing the degree of RET in subcellular structures<br />
6. REFERENCES<br />
1. M. Minsky : Memoir on inventing the confocal microscope. Scanning 10, 128-138 (1988).<br />
2. J.G. White, W.B. Amos, M. Fordham : An evaluation of confocal versus conventional <strong>imaging</strong> of biological structures<br />
by fluorescence light microscopy. J Cell Biol 105, 41-48 (1987).<br />
3. R. Lansford, G. Bearman, S.E.Fraser : Resolution of multiple green fluorescent protein color variants and dyes using<br />
two-photon microscopy and <strong>imaging</strong> spectroscopy. J. Biomed. Optics 6, 311-318 (2001).<br />
4. J.R. Lakowicz, K.W. Berndt : Lifetime-selective fluorescence <strong>imaging</strong> using an rf phase-sensitive camera. Rev. Sci.<br />
Instrum. 62, 1727-1734 (1991).<br />
5. A. Squire, P.J. Verveer, P.I.H. Bastiens: <strong>Multi</strong>ple frequency fluorescence <strong>lifetime</strong> <strong>imaging</strong> microscopy. J. Microsc. 197,<br />
136-149 (2000).<br />
6. E.P. Buurman, R. Sanders, A. Draaijer, H.C. Gerritsen, J.J.F. van Veen, P.M. Houpt, Y.K. Levine : Fluorescence<br />
<strong>lifetime</strong> <strong>imaging</strong> using a confocal laser scanning microscope. Scanning 14, 155-159 (1992).<br />
7. J. Sytsma, J.M. Vroom, C.J. de Grauw, H.C. Gerritsen, Time-Gated <strong>lifetime</strong> <strong>imaging</strong> and micro-volume spectroscopy<br />
using two-photon excitation. J. Microsc. 191, 39-51.<br />
8. I. Bugiel, K. König, H. Wabnitz, Investigations of cells by fluorescence laser scanning microscopy with subnanosecond<br />
resolution. Lasers in the Life Sciences 3, 47-53 (1989).<br />
9. D.W. Piston, D.R. Sandison, W.W. Webb : Time-resolved fluorescence <strong>imaging</strong> and background rejection by twophoton<br />
excitation in laser scanning microscopy. SPIE Proc. 1640, 379-389 (1992).<br />
10. P.T.C. So, T. French, W.M.Yu, K.M. Berland, C.Y. Dong, E. Gratton, Time-resolved fluorescence microscopy using<br />
two-photon excitation. Bio<strong>imaging</strong>, 3, 49-63 (1995).<br />
11. W. <strong>Becker</strong>, A. Bergmann, K. Koenig, U. Tirlapur, Picosecond fluorescence <strong>lifetime</strong> microscopy by <strong>TCSPC</strong> <strong>imaging</strong>.<br />
Proc. SPIE 4262, 414-419 (2001).<br />
12. <strong>Becker</strong> & <strong>Hickl</strong> GmbH, SPC-300 through SPC-730 operating manual. www.becker-hickl.de.<br />
Photonics West - BIOS 2002, Biomedical Optics, Proc. SPIE 4620, San Jose California
13. W. <strong>Becker</strong>, A. Bergmann, H. Wabnitz, D. Grosenick, A. Liebert, High count rate multichannel <strong>TCSPC</strong> for optical<br />
tomography. Proc. SPIE 4431, 249-254 (2001).<br />
14. <strong>Becker</strong> & <strong>Hickl</strong> GmbH, PML-16 operating manual. www.becker-hickl.de.<br />
Author Information:<br />
Wolfgang <strong>Becker</strong> Axel Bergmann Christoph Biskup<br />
www.becker-hickl.de www.becker-hickl.de www.mti.uni-jen.de<br />
becker@becker-hickl.de bergmann@becker-hickl.de cbis@mti-n.uni-jena.de<br />
Photonics West - BIOS 2002, Biomedical Optics, Proc. SPIE 4620, San Jose California