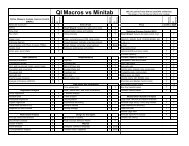
36 page user guide - QI Macros for Excel
36 page user guide - QI Macros for Excel
36 page user guide - QI Macros for Excel

Create successful ePaper yourself
Turn your PDF publications into a flip-book with our unique Google optimized e-Paper software.
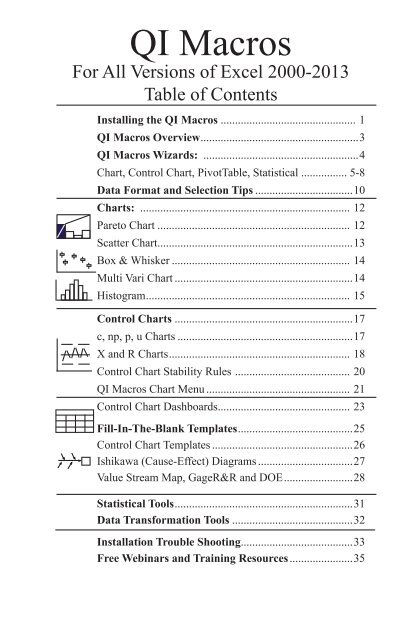
<strong>QI</strong> <strong>Macros</strong><br />
For All Versions of <strong>Excel</strong> 2000-2013<br />
Table of Contents<br />
Installing the <strong>QI</strong> <strong>Macros</strong>................................................ 1<br />
<strong>QI</strong> <strong>Macros</strong> Overview........................................................3<br />
<strong>QI</strong> <strong>Macros</strong> Wizards: .......................................................4<br />
Chart, Control Chart, PivotTable, Statistical................. 5-8<br />
Data Format and Selection Tips...................................10<br />
Charts: .......................................................................... 12<br />
Pareto Chart.................................................................... 12<br />
Scatter Chart.....................................................................13<br />
Box & Whisker............................................................... 14<br />
Multi Vari Chart...............................................................14<br />
Histogram........................................................................ 15<br />
Control Charts...............................................................17<br />
c, np, p, u Charts..............................................................17<br />
X and R Charts................................................................ 18<br />
Control Chart Stability Rules ......................................... 20<br />
<strong>QI</strong> <strong>Macros</strong> Chart Menu................................................... 21<br />
Control Chart Dashboards............................................... 23<br />
Fill-In-The-Blank Templates.........................................25<br />
Control Chart Templates..................................................26<br />
Ishikawa (Cause-Effect) Diagrams..................................27<br />
Value Stream Map, GageR&R and DOE.........................28<br />
Statistical Tools...............................................................31<br />
Data Trans<strong>for</strong>mation Tools...........................................32<br />
Installation Trouble Shooting.......................................33<br />
Free Webinars and Training Resources.......................35
Installing the <strong>QI</strong> <strong>Macros</strong><br />
From Download:<br />
• Save the <strong>QI</strong><strong>Macros</strong>230.zip file on your PC or Mac<br />
• Close <strong>Excel</strong><br />
• Extract files from the zip folder<br />
• Run the Installation Wizard<br />
PC:<br />
Open the <strong>QI</strong> <strong>Macros</strong> PC Folder and double click on<br />
<strong>QI</strong><strong>Macros</strong>2013Setup.exe to run the wizard.<br />
MAC: Open the <strong>QI</strong> <strong>Macros</strong> MAC Folder and double click<br />
on <strong>QI</strong><strong>Macros</strong>2013.dmg to run the wizard.<br />
From CD:<br />
• Close <strong>Excel</strong>.<br />
• Insert CD and open to view contents.<br />
• PC - Double click on <strong>QI</strong><strong>Macros</strong>2013Setup.exe to run the<br />
installation wizard.<br />
• MAC - Open the <strong>QI</strong> <strong>Macros</strong> MAC Folder and double click<br />
on <strong>QI</strong><strong>Macros</strong>2013.dmg to run the installation wizard.<br />
Installation Troubleshooting<br />
If the installation wizard ran, but the <strong>QI</strong> <strong>Macros</strong> menu does not<br />
appear on your <strong>Excel</strong> toolbar, the <strong>QI</strong> <strong>Macros</strong> file has most likely<br />
been disabled by <strong>Excel</strong>. See easy fix to enable the file on <strong>page</strong> 33<br />
or at qimacros.com/support/qi-macros-tech-support/#NoMenu<br />
Tech Support:<br />
• qimacros.com/support/qi-macros-tech-support<br />
• email: support@qimacros.com<br />
Attach a copy of your data in <strong>Excel</strong> if applicable<br />
• call 888.468.1537 or 303.756.9144<br />
© 2013 Jay Arthur 1 <strong>QI</strong> <strong>Macros</strong>
<strong>Excel</strong> 2007, 2010 & 2013 Ribbon Menu<br />
<strong>Excel</strong> 2007, 2010 & 2013 have a different <strong>user</strong> interface from<br />
previous versions of <strong>Excel</strong> called "the ribbon." When properly<br />
installed the <strong>QI</strong> <strong>Macros</strong> will appear in the far right of the ribbon.<br />
Click on <strong>QI</strong> <strong>Macros</strong> to reveal the <strong>QI</strong> <strong>Macros</strong> functions. Any menu<br />
with an arrow to the right has a menu of further options.<br />
<strong>Excel</strong> <strong>for</strong> Mac and <strong>Excel</strong> 2000-03 Menu<br />
When properly installed on a Mac or older version of <strong>Excel</strong>, the<br />
<strong>QI</strong> <strong>Macros</strong> will appear in the far right part of the menu. Click on<br />
<strong>QI</strong> <strong>Macros</strong> to access all of its features.<br />
Licensing:<br />
The <strong>QI</strong> <strong>Macros</strong> is a Single User License. You need to buy one<br />
license <strong>for</strong> each <strong>user</strong> or computer.<br />
Home/Office Edition <strong>for</strong> one <strong>user</strong> with two computers (desktop/<br />
laptop, home/office, PC/Mac). Add a 2nd computer <strong>for</strong> a single<br />
<strong>user</strong> at: qimacros.com/store/add-w244/<br />
About this User Guide<br />
This booklet covers use of the <strong>QI</strong> <strong>Macros</strong>. It will not cover <strong>Excel</strong>,<br />
SPC, or Lean Six Sigma. See www.qimacros.com <strong>for</strong> other resources<br />
addressing these topics.<br />
© 2013 Jay Arthur 2 <strong>QI</strong> <strong>Macros</strong>
<strong>QI</strong> <strong>Macros</strong> Overview<br />
The <strong>QI</strong> <strong>Macros</strong> Consists of Four Parts:<br />
1. <strong>Macros</strong> Control Charts, Histograms, Line, Run, Scatter,<br />
Pareto, Bar, Pie, Box Whisker, Multi Vari<br />
2. Templates SPC Charts, Dashboards, Flowcharts, Fishbones,<br />
DOE, Gage R&R, QFD, FMEA, PPAP, Value<br />
Stream Maps<br />
3. Statistics ANOVA, F-Test, t-Test, Chi-Squared, Correlation,<br />
Regression, Sample Size Calculator<br />
4. Data PivotTable Wizard, Count Words, Stack/Restack<br />
Tables, Paste/Link Transpose<br />
Works Right in Microsoft <strong>Excel</strong><br />
Other software packages make you transfer your <strong>Excel</strong> data into<br />
special tables within their application, but not the <strong>QI</strong> <strong>Macros</strong>.<br />
Just click and drag over the data in your <strong>Excel</strong> spreadsheet and<br />
click on the chart or analysis you want to run from the <strong>QI</strong> <strong>Macros</strong><br />
menu.<br />
Sample Data<br />
The <strong>QI</strong> <strong>Macros</strong> loads sample data <strong>for</strong> each chart and statistical<br />
tool on your computer at Documents\<strong>QI</strong><strong>Macros</strong>TestData.<br />
Use this data <strong>for</strong> examples of how to set up your data and to<br />
practice running charts.<br />
Video Tutorials<br />
Watch "how-to" videos <strong>for</strong> many <strong>QI</strong> <strong>Macros</strong> tools at:<br />
qimacros.com/qi-macros/video-tour<br />
© 2013 Jay Arthur 3 <strong>QI</strong> <strong>Macros</strong>
<strong>QI</strong> <strong>Macros</strong> Wizards<br />
The <strong>QI</strong> <strong>Macros</strong> is the only Six Sigma SPC software that provides<br />
Wizards to automatically choose charts based on your data.<br />
We have found that beginning and even experienced Six Sigma<br />
<strong>user</strong>s aren't always sure what chart or tool to use. Because <strong>user</strong>s<br />
select their data be<strong>for</strong>e they draw a chart or run a statistic, the<br />
<strong>QI</strong> <strong>Macros</strong> can easily determine the best charts, statistics or<br />
organization <strong>for</strong> the data.<br />
The <strong>QI</strong> <strong>Macros</strong> have several wizards to assist in choosing the right<br />
chart or statistic:<br />
• Chart Wizard - chooses the right charts <strong>for</strong> your data: descriptive<br />
statistics, pareto charts, control charts, histograms, box and<br />
whisker charts, scatter charts, etc.<br />
• Control Chart Wizard - chooses the right control chart <strong>for</strong><br />
your data from: c, np, p, u, XmR, XbarR, or XbarS.<br />
• PivotTable Wizard - creates a PivotTable when you select up<br />
to four columns of data.<br />
• Statistics Wizard - will analyze your data and choose the right<br />
hypothesis tests <strong>for</strong> you. Hypothesis testing determines if the<br />
means and variances of two or more samples are the same or<br />
different. The Stat Wizard will figure it out and tell you in no<br />
uncertain terms. No more p values to evaluate.<br />
For more in<strong>for</strong>mation see: qimacros.com/qi-macros/wizards/<br />
© 2013 Jay Arthur 4 <strong>QI</strong> <strong>Macros</strong>
<strong>QI</strong> <strong>Macros</strong> Chart Wizard<br />
You've Collected Your Data - Now What?<br />
If you are like many of our <strong>user</strong>s, you are confused about which<br />
chart to use to analyze your data. Rather than having to find<br />
your way through a <strong>for</strong>est of decision trees, wouldn't it be great<br />
if the decision tree was already coded into the software?<br />
In the <strong>QI</strong> <strong>Macros</strong>, it is!<br />
Just select your data, click on the <strong>QI</strong> <strong>Macros</strong> menu and then<br />
Chart Wizard. The <strong>QI</strong> <strong>Macros</strong> will analyze your data, run descriptive<br />
statistics and create the most probable charts.<br />
Chart Wizard Results include:<br />
• Descriptive Statistics - with a Histogram, Box Plot, Confidence<br />
Intervals, Normal Probability Plot<br />
• One of several Control Charts<br />
• Pareto, Scatter or Box and Whisker Plot<br />
Chart Wizard Selection Highlights<br />
Columns 1 2 3-9 10+<br />
Integers or Pareto Chart<br />
Decimals if headings Scatter Plot<br />
not dates<br />
Integers c chart p, u, np chart<br />
Decimals<br />
Normal<br />
Decimals<br />
Non-<br />
Normal<br />
XmR<br />
XmR<br />
Median<br />
XbarR<br />
Box Whisker<br />
XmedianR<br />
Box Whisker<br />
XbarR<br />
Box Whisker<br />
XmedianR<br />
Box Whisker<br />
XbarS<br />
Box Whisker<br />
XbarS<br />
Box Whisker<br />
For more info, see qimacros.com/quality-tools/chart-wizard/<br />
© 2013 Jay Arthur 5 <strong>QI</strong> <strong>Macros</strong>
Control Chart Wizard<br />
Choosing the right control chart depends on your data–attribute<br />
(counted) or variable (measured)–and the sample size.<br />
Number in Sample<br />
Type of data 1 2-or-more Varies<br />
Fraction Defective np p<br />
Number of defects c u<br />
Time, length, weight, $ XmR XbarR XbarR<br />
(Measured) XbarS XbarS<br />
You can select the control chart yourself or let the <strong>QI</strong> <strong>Macros</strong><br />
Control Chart Wizard analyze your data and select one <strong>for</strong> you.<br />
To use the Control Chart Wizard:<br />
1. Highlight the labels and data to be graphed.<br />
2. From the <strong>QI</strong> <strong>Macros</strong> Menu, select Control Chart Wizard.<br />
3. The wizard will analyze your data and select the correct<br />
chart <strong>for</strong> you. If it needs to determine between two possible<br />
charts, you may be prompted <strong>for</strong> a question like:<br />
Resources <strong>for</strong> selecting your own chart include:<br />
• The SPC Quick Reference Card at qimacros.com/pdf/spcfree-training.pdf<br />
• Free article at qimacros.com/free-excel-tips/choosing-control-charts<br />
© 2013 Jay Arthur 6 <strong>QI</strong> <strong>Macros</strong>
<strong>QI</strong> <strong>Macros</strong> Statistics Wizard<br />
The Statistics Wizard will analyze your data and choose the right<br />
hypothesis tests <strong>for</strong> you.<br />
Hypothesis testing can seem complex and challenging, but it basically<br />
wants to know if the means and variances of two or more<br />
samples are the same or different. The Stat Wizard will tell you<br />
in no uncertain terms. No more p values to evaluate.<br />
1. To use the Stat Wizard organize your data into columns. See<br />
sample data sets at Documents\<strong>QI</strong><strong>Macros</strong>TestData\anova<br />
2. Select your data then choose Stat Wizard from the <strong>QI</strong> <strong>Macros</strong><br />
toolbar. The wizard will determine the number of columns of<br />
data and whether the data is decimals or integers. Based on<br />
that in<strong>for</strong>mation, it will run the following statistics:<br />
1 Column Descriptive Statistics<br />
1 Sample T Test <strong>for</strong> Means<br />
2 Columns F Test <strong>for</strong> Variances<br />
t Test <strong>for</strong> Means<br />
Chi-Square Table <strong>for</strong> independence<br />
(if data is integers)<br />
Fisher's test <strong>for</strong> 2X2 tables, Regression<br />
3+Columns<br />
ANOVA <strong>for</strong> Means,<br />
Levene's Test <strong>for</strong> Variances<br />
Chi-Square Table <strong>for</strong> independence<br />
(if data is integers)<br />
The <strong>QI</strong> <strong>Macros</strong> results will answer these questions <strong>for</strong> you:<br />
• Is your data normal?<br />
• Reject or Accept the Null Hypothesis?<br />
• Are the Means or Variances the same or different?<br />
Learn more: qimacros.com/hypothesis-test/statistics-wizard-excel<br />
qimacros.com/hypothesis-test/hypothesis-testing-excel<br />
© 2013 Jay Arthur 7 <strong>QI</strong> <strong>Macros</strong>
<strong>QI</strong> <strong>Macros</strong> PivotTable Wizard<br />
If you are like many <strong>Excel</strong> <strong>user</strong>s, you struggle with creating<br />
PivotTables in <strong>Excel</strong>. However, PivotTables are a valuable tool<br />
every quality improvement professional should learn to use.<br />
The <strong>QI</strong> <strong>Macros</strong> makes creating PivotTables easy. Here is how:<br />
1. Make sure each column in your data sheet has a heading and<br />
that there are no blank rows or columns separating the data<br />
you want in the PivotTable.<br />
2. In the data sheet, use the Ctrl key to select up to four column<br />
headings <strong>for</strong> the data you want included in the PivotTable.<br />
3. From the <strong>QI</strong> <strong>Macros</strong> menu, choose PivotTable Wizard.<br />
4. The wizard will determine the best way to organize your data<br />
into a PivotTable and create one <strong>for</strong> you.<br />
4. Use Ctrl key to select labels and data in PivotTable to draw<br />
charts using the <strong>QI</strong> <strong>Macros</strong>.<br />
© 2013 Jay Arthur 8 <strong>QI</strong> <strong>Macros</strong>
Run a Macro Using the Menus<br />
1. Input your Data into an <strong>Excel</strong> Worksheet: The simplest<br />
<strong>for</strong>mat <strong>for</strong> your data is usually one column and one row of<br />
labels, and one or more columns of data (e.g., samples).<br />
Date/Labels<br />
Defects/Samples<br />
Tip: Only select one column and row of labels. Each chart<br />
requires a certain # of columns of data to run properly:<br />
Required number of columns of data:<br />
1 1 or more 2 2 or more<br />
Pareto XmR Scatter Box & Whisker<br />
Pie, Run Histogram Multi Vari<br />
c, np, XmR Freq Hist<br />
Levey Jennings EWMA u Chart XbarR<br />
Moving Avg Cusum p Chart XbarS<br />
Dot Plot XmedianR Hotelling Matrix Plot<br />
2. Select Your Data: Use your mouse to click-and-drag to select<br />
the data you want to graph. (Hint: don't select the whole<br />
column or row, just the cells you want to graph.)<br />
3. Select Your Chart: Click on the <strong>QI</strong> <strong>Macros</strong> menu and select<br />
the Chart Wizard or the chart you want to run.<br />
4. Answer the Prompts: Most charts will prompt you <strong>for</strong> titles<br />
and other in<strong>for</strong>mation to complete the chart.<br />
5. Review and Save Your Workbook: When the macro is<br />
done you will have a workbook with 3 sheets: your data, the<br />
chart and an intermediate spreadsheet where you can view<br />
the calculations. Don't <strong>for</strong>get to save your workbook.<br />
© 2013 Jay Arthur 9 <strong>QI</strong> <strong>Macros</strong>
Data Format & Selection Tips<br />
1. To highlight cells from different columns (as shown):<br />
Click on the top left cell and drag the mouse down to include<br />
the cells in the first row or column. Then, hold down<br />
the Control (Ctrl) Key, while clicking and highlighting the<br />
additional rows or columns.<br />
2. You may also use data in horizontal rows: Click on the<br />
top left cell and drag the mouse down and right to include<br />
the cells in the horizontal rows.<br />
3. Numeric data and decimal precision: <strong>Excel</strong> <strong>for</strong>mats most<br />
numbers as "General" not "Number." If you do not specify<br />
the <strong>for</strong>mat <strong>for</strong> your data, <strong>Excel</strong> will choose one <strong>for</strong> you. To<br />
get the desired precision, select your data, choose Format-<br />
Cells-Number and specify the number of decimals:<br />
© 2013 Jay Arthur 10 <strong>QI</strong> <strong>Macros</strong>
Common Error Messages<br />
Many charts require more than one column of data. If you only<br />
select one column of data and then select one of these charts, you<br />
will receive the following error message.<br />
The u chart assumes that your defects column is to the left of your<br />
sample size column. If the columns are reversed (larger #s on the<br />
left), the macros will ask you if the left column is the sample size.<br />
Formatting <strong>Excel</strong> Charts<br />
Once you create a chart, you can use any of <strong>Excel</strong>'s menus and<br />
commands to enhance or <strong>for</strong>mat your chart. Just select the item to<br />
<strong>for</strong>mat and then right click to view the options available.<br />
Add Text boxes, arrows or other - Use <strong>Excel</strong>'s drawing tools to<br />
add text boxes, arrows or other symbols to your chart. Drawing<br />
tools are under the Insert tab in <strong>Excel</strong> 2007-2013 or on the drawing<br />
toolbar in older versions of <strong>Excel</strong>.<br />
Put two charts on the same worksheet - Click on your chart<br />
and select Edit-Copy. Next click in the destination worksheet and<br />
select Edit-Paste.<br />
For Other Chart Options - Right click on the item you want to<br />
change or click on the Chart Tools menu. For further in<strong>for</strong>mation<br />
see qimacros.com/free-excel-tips/<strong>for</strong>mat-charts<br />
© 2013 Jay Arthur 11 <strong>QI</strong> <strong>Macros</strong>
Pareto Chart<br />
1. Highlight the labels and one column or more of data (you<br />
will get a separate pareto <strong>for</strong> each data column): labels in<br />
the left-hand column, data in the right-hand column.<br />
Pareto charts are a<br />
combination line chart<br />
and bar graph. They<br />
help narrow your focus<br />
to simplify problem<br />
solving.<br />
2. From the <strong>QI</strong> <strong>Macros</strong> Menu, select Pareto Chart. If you<br />
have more than 9 data points, the macros will ask you how<br />
many bars you want be<strong>for</strong>e you summarize the miscellaneous<br />
ones into an "Other" bar. Input the number of bars and then<br />
click "OK."<br />
Sample Pareto chart with an "Other" Bar.<br />
If you want to continually add data, consider using the Pareto<br />
Chart template. Watch video of a pareto chart being created at<br />
qimacros.com/quality-tools/pareto-chart-video<br />
© 2013 Jay Arthur 12 <strong>QI</strong> <strong>Macros</strong>
Scatter Chart<br />
1. Highlight the labels and data to be graphed.<br />
Scatter charts can help confirm your<br />
suspicions about cause and effects.<br />
Scatter charts require two columns of<br />
data.<br />
If R 2 >.8, most statistics books imply<br />
there is a strong correlation.<br />
2. From the <strong>QI</strong> <strong>Macros</strong> Menu, select "Scatter Diagram."<br />
3. The macro will create a<br />
scatter diagram with y and<br />
R 2 metrics. Other metrics can<br />
be found on the scatter data<br />
worksheet.<br />
Watch video of a scatter plot<br />
being created at :<br />
qimacros.com/training/videos/scatter-plot<br />
Matrix Plot<br />
You can also use a Matrix Plot to evaluate the correlation and<br />
cause effect between two or more variables.<br />
© 2013 Jay Arthur 13 <strong>QI</strong> <strong>Macros</strong>
Box &Whisker<br />
1. Highlight the labels and data to be graphed.<br />
Box and Whisker<br />
plots help show the<br />
dispersion of data<br />
over time. Each bar<br />
is like a histogram<br />
turned on its side.<br />
This chart<br />
requires 2 or<br />
more columns of<br />
data.<br />
2. From the <strong>QI</strong> <strong>Macros</strong> Menu, select Box & Whisker. The<br />
macro will ask if your data is grouped in rows or columns.<br />
The data above has 18 rows and 4 columns. Watch video at<br />
qimacros.com/training/videos/box-whisker-plot/<br />
Graph if select by rows<br />
Graph if select by columns<br />
Multi Vari Chart<br />
The Multi Vari Chart summarizes data based on labels (A:C) and<br />
plots the averages and data points. Watch video at qimacros.com /<br />
training/videos/multi-vari-chart/<br />
© 2013 Jay Arthur 14 <strong>QI</strong> <strong>Macros</strong>
Histogram<br />
1. Make sure the cells are <strong>for</strong>matted to the correct decimal<br />
precision. Right click on cells and select Format-Cells, select<br />
Number and specify the number of decimal places you<br />
want.<br />
2. Highlight the labels and data to be graphed (a minimum<br />
of 20 data points is recommended). Click on the top data<br />
cell and drag the mouse down to include just the data cells.<br />
Tip: Do NOT sort your data be<strong>for</strong>e running a histogram.<br />
3. From the <strong>QI</strong> <strong>Macros</strong> Menu, select Histograms and<br />
Capability, then the Histogram you want. You will be<br />
prompted <strong>for</strong> upper and lower spec limits and the approximate<br />
# of bars. Click OK to use the defaults or enter your<br />
own. For one-sided or unilateral histograms, click Cancel if<br />
there is no USL or LSL.<br />
4. Single Column of Data? If you select a single column of<br />
data, the histogram will prompt <strong>for</strong> subgroup size. Input<br />
subgroup size or use the default of 1 if there are none.<br />
© 2013 Jay Arthur 15 <strong>QI</strong> <strong>Macros</strong>
5. Then, the macro will draw the graph <strong>for</strong> you.<br />
6. To move the USL or LSL arrows or text boxes:<br />
Arrows: Click on each arrow and drag it to the appropriate<br />
position. To extend an arrow, click on it, then click on the<br />
handle at either end and extend the arrow.<br />
Text: Click on each text box and drag it to sit on top or<br />
beside its corresponding arrow.<br />
7. To revise the process capability analysis, switch to the Histdata<br />
sheet and change the upper and/or lower specification<br />
limits. <strong>Excel</strong> will recalculate Cp ,Cpk and other metrics and<br />
update the contents of the text boxes on the chart. You can<br />
also change the # of bars, class width and beginning point.<br />
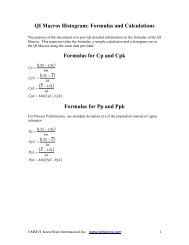
For in<strong>for</strong>mation about histogram calculations in the <strong>QI</strong> <strong>Macros</strong>,<br />
see qimacros.com/pdf/histogram-manual-calcs.pdf<br />
Watch video of a histogram being created using the <strong>QI</strong> <strong>Macros</strong> at<br />
qimacros.com/training/videos/histograms<br />
© 2013 Jay Arthur 16 <strong>QI</strong> <strong>Macros</strong>
c, np, p, and u Control Charts<br />
Attribute control charts track the number of defects in a sample.<br />
1. Highlight the labels and data to be graphed (as shown).<br />
c or np charts p charts u charts<br />
2. From the Control Charts Menu, select "c, np, p or u<br />
chart". The np chart will prompt <strong>for</strong> a sample size if you<br />
did not include it in your selection.<br />
c or np charts have<br />
straight UCL and LCL.<br />
p and u charts can<br />
have UCL and LCL<br />
lines that vary with<br />
the sample size.<br />
See also: qimacros.com/control-chart/show-hide-sigmalines<br />
and qimacros.com/control-chart/p-and-u-chart-<strong>for</strong>mats<br />
© 2013 Jay Arthur 17 <strong>QI</strong> <strong>Macros</strong>
XmR<br />
X and R Control Charts<br />
An X chart shows process per<strong>for</strong>mance using continuous<br />
data (i.e., time, length, weight, money, etc.)<br />
1. Highlight the labels and data to be graphed. You will<br />
need 20 or more data points to get a good graph. Your data<br />
should look like this:<br />
XbarR and XbarS<br />
2. From the <strong>QI</strong> <strong>Macros</strong> Menu, select "XmR, XmR Median<br />
R, XmR Trend, XbarR, XbarS, or Xmedian Chart." The<br />
macro will create a new worksheet and begin calculating<br />
the X and R values, control limits, and averages.<br />
3. The macro will first draw the Range Chart. If the R chart<br />
looks unstable, then the process is unstable.<br />
© 2013 Jay Arthur 18 <strong>QI</strong> <strong>Macros</strong>
4. Next, the macro will draw the X chart. If the Range Chart<br />
looks stable and the X chart is stable, then the process is<br />
stable.<br />
5. From the File Menu, select Save to save the graph with<br />
your workbook.<br />
Create Stair Step Limits<br />
Be<strong>for</strong>e you run any control chart you can insert a blank row<br />
in your data where you know a process change occurred, the <strong>QI</strong><br />
<strong>Macros</strong> will calculate separate UCLs and LCLs <strong>for</strong> each group of<br />
data giving you "stair-step" control limits.<br />
For more in<strong>for</strong>mation about control chart menu features see<br />
qimacros.com/free-resources/excel-tips/#menu<br />
© 2013 Jay Arthur 19 <strong>QI</strong> <strong>Macros</strong>
Control Chart Stability Rules<br />
When you run a control chart, the <strong>QI</strong> <strong>Macros</strong> will show unstable<br />
points as diamonds and unstable trends in red. They will also show<br />
the Center Line, UCL and LCL <strong>for</strong> evaluating stability. The <strong>QI</strong><br />
<strong>Macros</strong> use stability rules defined in Montgomery's Introduction to<br />
Statistical Quality Control 4th edition.<br />
You can Show/Hide 1-2 sigma lines, change stability rules or p/u<br />
chart limit <strong>for</strong>mats (flat vs. wavy) as follows:<br />
1. Click on the <strong>QI</strong> <strong>Macros</strong><br />
Menu, then Control Charts<br />
then Control Chart Rules.<br />
2. Click on the stability rules you want to use. The stability<br />
rules <strong>for</strong> each selection are:<br />
3. To hide sigma lines or change p/u chart <strong>for</strong>mats click on the<br />
appropriate selection.<br />
4. Any changes you make will be saved to the <strong>QI</strong> <strong>Macros</strong> and<br />
will be applied to all of the charts you run. To change the<br />
rules back, simply click on Control Chart Rules and select Default<br />
rules or Show/Hide 1-2 sigma lines or p/u chart <strong>for</strong>mat. If<br />
you want to customize the stability and chart <strong>for</strong>mat rules even<br />
further, see qimacros.com/free-excel-tips/control-chart-rules<br />
© 2013 Jay Arthur 20 <strong>QI</strong> <strong>Macros</strong>
<strong>QI</strong> <strong>Macros</strong> Chart Menu<br />
After you run a chart, the <strong>QI</strong> <strong>Macros</strong> give you additional tools to<br />
update and analyze your chart. To access these tools, click on a<br />
chart and then click on the <strong>QI</strong> <strong>Macros</strong> Chart menu.<br />
Chart Menu in <strong>Excel</strong> 2007 - 2013<br />
Chart Menu in <strong>Excel</strong> 2000 - 2003 and Mac versions of <strong>Excel</strong><br />
Add Data to Charts: Click on the<br />
chart datasheet (i.e. cdata) and input<br />
new data points. Then click on the chart.<br />
Next click on the <strong>QI</strong> <strong>Macros</strong> Chart<br />
menu and Add Data. Enter the number<br />
of rows to add and then click OK.<br />
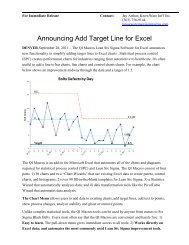
Add Target Line to Chart: Click on the <strong>QI</strong> <strong>Macros</strong> Chart menu<br />
and then Add Target Line. You will be prompted <strong>for</strong> the series label<br />
(e.g. Target, Spec Limit, Goal, etc) and the value.<br />
Analyze Stability: Always re-run stability analysis after you add<br />
new data, delete a point or show a process change on a control<br />
chart. To do so, simply click on Analyze Stability from the <strong>QI</strong> <strong>Macros</strong><br />
Chart menu.<br />
© 2013 Jay Arthur 21 <strong>QI</strong> <strong>Macros</strong>
Delete Point: Deletes a point from a chart and the calculations.<br />
Ghost Point: Deletes a point from the calculations but leaves it on<br />
the chart.<br />
Show Process Change : On the chart, click on the point where the<br />
process change occurred. Now click on the <strong>QI</strong> <strong>Macros</strong> Chart menu<br />
and select Show Process Change. The macros will calculate a new<br />
set of control limits, starting at the point you selected. The UCL,<br />
CL and LCL values will be updated to show the new limits. You can<br />
use this feature multiple times on the same chart.<br />
Stability Analysis: Make sure you re-run stability analysis after<br />
you do any of these functions.<br />
Show/Hide 1-2 Sigma Lines: Just click on this selection to add or<br />
delete 1-2 sigma lines from your chart.<br />
Recalculate Control Limits After you Add New Data (optional):<br />
Control limits are calculated with the data you selected when running<br />
the macro. If you want to recalculate control limits after you<br />
add new data: Add new data to the chart. Next, click on the first data<br />
point on the chart and select Show Process change on the menu.<br />
Since this function recalculates control limits using the point selected<br />
and every point to the right, it will recalculate your control limits<br />
using all of your data including the new points.<br />
For more in<strong>for</strong>mation about all of these features see<br />
qimacros.com/free-resources/excel-tips/#menu<br />
© 2013 Jay Arthur 22 <strong>QI</strong> <strong>Macros</strong>
Control Chart Dashboards<br />
These new templates will automatically create Control Chart<br />
Dashboards <strong>for</strong> you.<br />
1. Click on the <strong>QI</strong> <strong>Macros</strong> menu (see below examples) and select<br />
Control Chart dashboards. Then select the XmR, XbarR,<br />
or c, np, p, u Dashboard.<br />
<strong>Excel</strong> 2000 to 2003 <strong>Excel</strong> 2007-2013<br />
2. A template will open. Each template has an instructions sheet,<br />
a data input sheet, and a sheet <strong>for</strong> each available chart.<br />
3. Input or cut and paste your data into the columns in the Data<br />
Sheet. Each column or set of columns creates a different<br />
chart. The XmR and XbarR dashboards have cells <strong>for</strong> USL/<br />
LSL, as well.<br />
4. Now click on the sheet <strong>for</strong> the desired chart. You will see a<br />
chart created from the first data set. Click on the previous and<br />
next arrows to view charts <strong>for</strong> each data set.<br />
5. If you want to create a dashboard with charts <strong>for</strong> all data sets,<br />
simply click on the Create Dashboards icon.<br />
6. To add new data to the templates or the dashboard charts, just<br />
add data to the Data Sheet and click on the Refresh Data or<br />
Refresh Data with Stability Analysis icon.<br />
See also qimacros.com/control-chart/control-chart-dashboard<br />
© 2013 Jay Arthur 23 <strong>QI</strong> <strong>Macros</strong>
<strong>Excel</strong> Charts<br />
<strong>Excel</strong>'s chart wizard enables you to run various<br />
charts. We have taken the most popular of<br />
these and made them easier to use. To run a<br />
these charts using the <strong>QI</strong> <strong>Macros</strong>:<br />
1. Highlight the labels and data to be<br />
graphed.<br />
2. Click on the <strong>QI</strong> <strong>Macros</strong> menu, <strong>Excel</strong><br />
Charts, then the chart you want to run.<br />
Run Charts<br />
A run chart is a line graph of your data plus a center line representing<br />
the average or median of your data. To create a run<br />
chart using the <strong>QI</strong> <strong>Macros</strong>:<br />
1. Highlight the labels and data to be graphed.<br />
2. Click on the <strong>QI</strong> <strong>Macros</strong> menu, then Run Charts.<br />
3. Next choose between Average or Median.<br />
© 2013 Jay Arthur 24 <strong>QI</strong> <strong>Macros</strong>
Fill-in-the-Blank Templates<br />
The <strong>QI</strong> <strong>Macros</strong> contain 90 + templates including flowcharts,<br />
fishbones, balanced scorecard, FMEA, QFD, DOE, GageR&R,<br />
PPAP, Value Stream Mapping, Time Tracking, and more. There<br />
are also templates <strong>for</strong> most charts including control charts, histograms,<br />
scatter, box and whisker plots, and pareto charts.<br />
Fill-In-the-Blanks Templates in <strong>Excel</strong> 2007-2013: Click on<br />
<strong>QI</strong> <strong>Macros</strong>, then look <strong>for</strong> Fill-in-the-Blanks Templates. Click on<br />
each sub menu to get a list of templates in that category.<br />
Fill-In-the-Blanks Templates in other versions of <strong>Excel</strong>:<br />
From the <strong>QI</strong> <strong>Macros</strong> Menu, choose Fill-In-The-Blank-Templates.<br />
Then choose a sub menu to get a list of templates in that<br />
category.<br />
Many templates including the Balanced Scorecard, FMEA,<br />
Gage R&R, DOE, and PPAP Forms are really several different<br />
templates (worksheets) in one workbook. To access each worksheet,<br />
just click on the worksheet tab.<br />
Our Six Sigma Ezine archives contain articles about many of<br />
these tools at qimacros.com/free-resources/six-sigma-articles<br />
© 2013 Jay Arthur 25 <strong>QI</strong> <strong>Macros</strong>
Control Chart Templates<br />
Use the Fill-in-the-Blanks templates to create control charts.<br />
1. Click on the <strong>QI</strong> <strong>Macros</strong> Menu, Fill-In-The-Blanks Templates<br />
and then SPC Charts. Then select the desired template.<br />
2. Each template is made up of several worksheets (average, median,<br />
rolling, fixed, short run etc.) See further info and descriptions<br />
at qimacros.com/control-chart/control-chart-template<br />
3. Input your data in the yellow area and the points will be plotted<br />
on the chart as you enter them. You can also cut and paste<br />
into the yellow area or link the cells to another spreadsheet.<br />
Add New Data: Templates default to 50 data points. To add<br />
more points, copy down the <strong>for</strong>mulas (they are hidden behind the<br />
charts), input your new data, then click on the chart and select<br />
Add Data to Control Charts on the <strong>QI</strong> <strong>Macros</strong> Chart menu. Input<br />
the number of points you want to add.<br />
Delete a Point: simply delete the point from the input area.<br />
Show Process Change: enter the <strong>Excel</strong> row number<br />
corresponding to the data point where the process<br />
change occurred in the Process Change at Row box to<br />
the right of the chart.<br />
Analyze Stability: click on the chart and then select Analyze<br />
Stability on the <strong>QI</strong> <strong>Macros</strong> Chart menu.<br />
© 2013 Jay Arthur 26 <strong>QI</strong> <strong>Macros</strong>
Ishikawa<br />
<strong>Excel</strong> may not be the best tool to do this with, but you can<br />
easily draw Ishikawa diagrams with the drawing tools.<br />
1. Select Fill-in-the-Blanks Templates, Improvement Tools,<br />
then choose the Ishikawa Fishbone Diagram.<br />
2. From the File Menu, select Save As to store the template<br />
under a new name.<br />
3. Use the text and arrow tools from the Drawing Tool Bar to<br />
add arrows and causes. (To see the tool bar, select: View/<br />
Options-Toolbars-Drawing.) In <strong>Excel</strong> 2007-2013, select<br />
Insert-Shapes.<br />
Use the Ellipse tool to circle root causes.<br />
Each line, box, text or circle is called<br />
an "object." Objects can be grouped<br />
together to <strong>for</strong>m a single object or<br />
moved in front or behind each other<br />
using the Drawing Tool. To copy<br />
the fishbone and place it in another<br />
document, use Ctrl + Shift + A to<br />
select all objects, then Edit-Copy.<br />
© 2013 Jay Arthur 27 <strong>QI</strong> <strong>Macros</strong>
Value Stream Mapping<br />
The <strong>QI</strong> <strong>Macros</strong> includes several Lean Tools, including Flowcharts<br />
and Value Stream Maps.<br />
1. To create a Value Stream Map,<br />
select Fill-in-the-Blanks Templates,<br />
Lean Tools, then Value Stream<br />
Mapping.<br />
2. The Value Stream Mapping template<br />
has several different tabs<br />
including a resource tab with Symbols,<br />
three different Value Stream<br />
Maps to help you get started and a<br />
Spaghetti Diagram.<br />
3. Once you open a template, use the Symbols tab, <strong>Excel</strong>'s cut<br />
and paste functions and <strong>Excel</strong>'s drawing toolbar to create<br />
your Value Stream Map.<br />
Value Stream<br />
Mapping<br />
Template<br />
Symbols<br />
Template<br />
© 2013 Jay Arthur 28 <strong>QI</strong> <strong>Macros</strong>
Gage R&R<br />
1. From the <strong>QI</strong> <strong>Macros</strong>, select Fill-in-the-Blanks Templates, then<br />
DOE, GageR&R, FMEA. Then choose the Gage R & R template.<br />
2. From the File Menu, select Save As to store the template.<br />
3. To conduct a study you'll need: five to ten of the same part from<br />
one batch or lot (these must span the range or tolerance you are<br />
trying to measure), at least two appraisers and a minimum of two<br />
measurement trials, on each part, by each appraiser. If you have<br />
references or specification tolerances, enter them.<br />
4. Evaluate GageR&R, graphs, and data to identify where to<br />
improve your measurement system.<br />
Gage R&R System Acceptability<br />
• % R&R
Design of Experiments (DOE)<br />
DOE can help you shorten the time and ef<strong>for</strong>t required to discover<br />
the optimal conditions to produce Six Sigma quality in<br />
your product or service.<br />
1. On the Fill-In-The-Blank Templates menu select DOE,<br />
GageR&R, FMEA, then Design of Experiments. Next,<br />
select the type of DOE template you want to use.<br />
2. Input your factors and the low-high settings <strong>for</strong> each factor.<br />
In a two factor test it might be, Time: 30 minutes & 45<br />
minutes and Temperature: 325 degrees and 375 degrees.<br />
3. Use the +/- values in the orthogonal array to <strong>guide</strong> your<br />
test of every combination. In a two factor test it would be:<br />
High ++ (45 min & 375 degrees), Low - - (30 min & 325<br />
degrees), In between + - (45 min & 325 degrees) and - +<br />
(30 min & 375 degrees).<br />
4. Input your results into the yellow input area and observe<br />
the interactions. See the DOE article at qimacros.<br />
com/lean-six-sigma-articles/design-of-experiments<br />
© 2013 Jay Arthur 30 <strong>QI</strong> <strong>Macros</strong>
Statistical Tools<br />
Six Sigma utilizes analysis tools like ANOVA, regression, f test,<br />
t tests, etc. The <strong>QI</strong> <strong>Macros</strong> Statistical tools are much easier to use<br />
than <strong>Excel</strong>'s Data Analysis Toolpak. The <strong>QI</strong> <strong>Macros</strong> also mistake-proof<br />
data entry and interpret the results of many statistical<br />
tests <strong>for</strong> you (i.e. data is normal, accept or reject null hypothesis).<br />
1. Select data <strong>for</strong> analysis. Some tools, like Anova, can take<br />
many columns. Others, like Regression, use two columns. A<br />
few only use one column. Data must be in columns <strong>for</strong> these<br />
tools to work. See documents/qimacros/testdata/anova <strong>for</strong><br />
examples of how your data should be organized.<br />
2. From the <strong>QI</strong> <strong>Macros</strong> Menu,<br />
choose Statistical Tools. A number<br />
of different statistical tools<br />
will be displayed.<br />
3. Select the appropriate statistical<br />
analysis, and click OK.<br />
If you aren't sure, choose the<br />
Stat Wizard. Answer any of the<br />
prompts (defaults are provided)<br />
and the <strong>QI</strong> <strong>Macros</strong> will per<strong>for</strong>m<br />
the analysis you've requested.<br />
4. The <strong>QI</strong> <strong>Macros</strong> output will also<br />
interpret the results <strong>for</strong> you. It<br />
will tell you to Reject or Accept<br />
the Null Hypothesis and whether<br />
the Means or Variances are the<br />
same or different.<br />
Learn More:<br />
qimacros.com/hypothesis-test/statistics-wizard-excel<br />
qimacros.com/hypothesis-test/hypothesis-testing-excel<br />
© 2013 Jay Arthur 31 <strong>QI</strong> <strong>Macros</strong>
Data Trans<strong>for</strong>mation Tools<br />
The <strong>QI</strong> <strong>Macros</strong> Data Trans<strong>for</strong>mation Tools help you analyze<br />
your data and reorganize it to run a chart.<br />
PivotTable Wizard<br />
The <strong>QI</strong> <strong>Macros</strong> PivotTable Wizard, makes it easier to run<br />
PivotTables. Just select up to 4 column headings and select the<br />
wizard. qimacros.com/quality-tools/pivot-table-cross-tab/<br />
Count Words in a Table<br />
Just select your data and the Word Count function will count<br />
the number of times a word or two word phrase appears in<br />
your data. qimacros.com/quality-tools/word-count/<br />
Stack/Restack/Restacking<br />
This function increases or decreases the number of columns<br />
your data is organized into. It can take one column of data and<br />
"stack" it into multiple columns or it can take multiple columns<br />
of data and restack it into one column. It can also convert<br />
2 columns to 3, or 4 columns to 2, etc.<br />
qimacros.com/quality-tools/restack/<br />
Paste Link/Paste Link Transpose<br />
<strong>Excel</strong> will paste-link and paste-transpose but it doesn't do both<br />
at the same time. Use these functions to create dashboards by<br />
linking your data to a chart template. Update your data sheet<br />
and the template and chart are automatically updated.<br />
qimacros.com/quality-tools/pastelink/<br />
Box Cox Trans<strong>for</strong>mation<br />
Box Cox Trans<strong>for</strong>mation multiplies the selected data by a<br />
trans<strong>for</strong>mation factor. The purpose is to trans<strong>for</strong>m non-normal<br />
data into data that is closer to normal.<br />
qimacros.com/quality-tools/boxcox/<br />
© 2013 Jay Arthur 32 <strong>QI</strong> <strong>Macros</strong>
Installation Trouble Shooting<br />
<strong>QI</strong> <strong>Macros</strong> Menu is not visible in <strong>Excel</strong> or qimacros.xla<br />
could not be found message. <strong>Excel</strong> has disabled the <strong>QI</strong> <strong>Macros</strong><br />
files. To fix the issue, simply re-enable the file per these instructions:<br />
<strong>Excel</strong> 2000 - 2003: In <strong>Excel</strong> click on Help/About Microsoft <strong>Excel</strong><br />
then click on Disabled items in the lower right corner. Enable<br />
any disabled <strong>QI</strong> <strong>Macros</strong> files.<br />
<strong>Excel</strong> 2007: Click on the office icon in the upper left corner.<br />
<strong>Excel</strong> 2010, 2013: Click on File.<br />
Next select <strong>Excel</strong> Options, then Add-ins on the left. Click on<br />
the arrow next to Manage, and select Disabled Items. Click Go<br />
to see the disabled items. If the <strong>QI</strong> <strong>Macros</strong> are disabled, enable<br />
them. Now close and re-open <strong>Excel</strong>.<br />
© 2013 Jay Arthur 33 <strong>QI</strong> <strong>Macros</strong>
Other Common Questions<br />
• How do I set up my data? See test data files loaded on your<br />
computer at c:Documents\<strong>QI</strong><strong>Macros</strong>\testdata.<br />
• Run Time Error... These messages usually mean there is a<br />
problem with your data. Either your header looks like data,<br />
your data looks like text or you have selected blank cells.<br />
• To Uninstall the <strong>QI</strong> <strong>Macros</strong>: Delete the qimacros.xla file and<br />
the <strong>QI</strong><strong>Macros</strong>2010menu.xlam file (<strong>Excel</strong> 2007-2013 only) in<br />
<strong>Excel</strong>'s startup folder at:<br />
C\Program Files\Microsoft Office\Office(10,11,12,14)\XLStart<br />
Windows 7 PCs may use Program Files (x86).<br />
Windows 8 and <strong>Excel</strong> 2013 is located at:<br />
C\Program Files\Microsoft Office15\Root\Office15\XLStart<br />
Technical Support<br />
Most tech support questions are answered at:<br />
qimacros.com/support/qi-macros-tech-support<br />
If you're still having problems email your <strong>Excel</strong> file and problem<br />
to: support@qimacros.com. Include the version number and<br />
service pack of <strong>Excel</strong>, and <strong>QI</strong> <strong>Macros</strong> version.<br />
You can also call our tech support line at (888) 468 1537 on<br />
Monday to Friday from 8:00 am to 5:00 pm Mountain time.<br />
<strong>QI</strong> <strong>Macros</strong> questions are free, however, there is an additional<br />
fee <strong>for</strong> SPC and <strong>Excel</strong> coaching and help.<br />
If you get Windows or <strong>Excel</strong> errors, check the Microsoft knowledge<br />
base at support.microsoft.com<br />
Other Resources<br />
Free Training at qimacros.com/free-resources/qi-macros-training<br />
Email qimacros@aweber.com <strong>for</strong> a FREE supplemental course<br />
on the <strong>QI</strong> <strong>Macros</strong>.<br />
© 2013 Jay Arthur 34 <strong>QI</strong> <strong>Macros</strong>
Free Webinars and Training<br />
Free 1 Hour Webinars: Great overview of the key functions in<br />
the <strong>QI</strong> <strong>Macros</strong> at qimacros.com/training/qi-macros-webinar/<br />
Lean Six Sigma "Yellow Belt" Training: lssyb.com<br />
Free email lesson series and monthly tips and tricks newsletter.<br />
Sign up by sending an email to qimacros@aweber.com<br />
Free articles and tips and tricks archive at<br />
qimacros.com/free-resources/excel-tips/<br />
Free <strong>QI</strong> <strong>Macros</strong> Video Tour at<br />
qimacros.com/qi-macros/video-tour/<br />
Other Products and Services<br />
We offer books, training videos and on-site training on:<br />
Lean Six Sigma SPC<br />
Download a product brochure at qimacros.com/pdf/qiflyer.pdf<br />
See on-site training options at qimacros.com/training/lean-sixsigma-training<br />
Order Options:<br />
Online: qimacros.com/store<br />
FAX: POs to (888) 468-15<strong>36</strong> or (303) 756-3107<br />
Call: (888) 468-1537 or (303) 756-9144<br />
Email: orders @qimacros.com<br />
Tech Support: (888) 468-1537 or (303) 756-9144 or<br />
support@qimacros.com<br />
KnowWare International, Inc.<br />
2696 S. Colorado Blvd., Suite 555<br />
Denver, CO 80222<br />
© 2013 Jay Arthur 35 <strong>QI</strong> <strong>Macros</strong>