Formulas for Pp and Ppk - QI Macros for Excel
Formulas for Pp and Ppk - QI Macros for Excel
Formulas for Pp and Ppk - QI Macros for Excel

You also want an ePaper? Increase the reach of your titles
YUMPU automatically turns print PDFs into web optimized ePapers that Google loves.
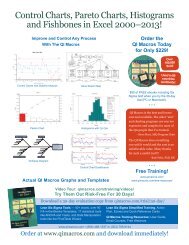
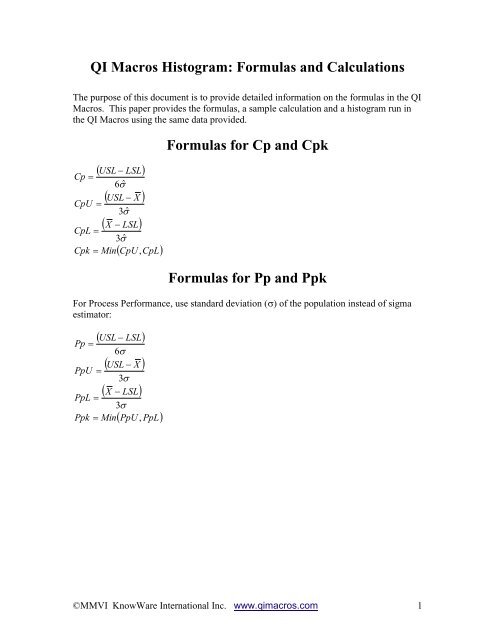
<strong>QI</strong> <strong>Macros</strong> Histogram: <strong>Formulas</strong> <strong>and</strong> Calculations<br />
The purpose of this document is to provide detailed in<strong>for</strong>mation on the <strong>for</strong>mulas in the <strong>QI</strong><br />
<strong>Macros</strong>. This paper provides the <strong>for</strong>mulas, a sample calculation <strong>and</strong> a histogram run in<br />
the <strong>QI</strong> <strong>Macros</strong> using the same data provided.<br />
<br />
USL LSL<br />
Cp <br />
6 ˆ <br />
USL<br />
X <br />
CpU <br />
3 ˆ <br />
X<br />
LSL<br />
CpL <br />
3 ˆ <br />
Cpk Min CpU , CpL<br />
<br />
<br />
<br />
<strong>Formulas</strong> <strong>for</strong> Cp <strong>and</strong> Cpk<br />
<strong>Formulas</strong> <strong>for</strong> <strong>Pp</strong> <strong>and</strong> <strong>Pp</strong>k<br />
For Process Per<strong>for</strong>mance, use st<strong>and</strong>ard deviation () of the population instead of sigma<br />
estimator:<br />
<br />
USL LSL<br />
<strong>Pp</strong> <br />
6<br />
USL<br />
X <br />
<strong>Pp</strong>U <br />
3<br />
X<br />
LSL<br />
<strong>Pp</strong>L <br />
3<br />
<strong>Pp</strong>k Min <strong>Pp</strong>U , <strong>Pp</strong>L<br />
<br />
<br />
<br />
©MMVI KnowWare International Inc. www.qimacros.com 1
Another View of the <strong>Formulas</strong><br />
Cp<br />
<strong>Formulas</strong> <strong>for</strong> Cp <strong>and</strong> <strong>Pp</strong><br />
<strong>Pp</strong><br />
( USL-LSL )<br />
(6 * sigma estimator)<br />
Use when you have a sample<br />
( USL-LSL )<br />
(6 * st<strong>and</strong>ard deviation)<br />
Use when you have the total population<br />
<strong>Formulas</strong> <strong>for</strong> Cpk <strong>and</strong> <strong>Pp</strong>k<br />
Cpk<br />
<strong>Pp</strong>k<br />
Minimum of CpU <strong>and</strong><br />
CpL<br />
Minimum of <strong>Pp</strong>U <strong>and</strong><br />
<strong>Pp</strong>L<br />
CpU<br />
( USL-Xbar )<br />
(3 * sigma estimator)<br />
<strong>Pp</strong>U<br />
( USL-Xbar )<br />
(3 * st<strong>and</strong>ard deviation)<br />
CpL<br />
( Xbar - LSL )<br />
(3 * sigma estimator)<br />
<strong>Pp</strong>L<br />
( Xbar - LSL )<br />
(3 * st<strong>and</strong>ard deviation)<br />
Use when you have<br />
Use when you have<br />
a sample<br />
the total population<br />
Points to note:<br />
Xbar = the average of the data points = ∑X /n<br />
Changing the spec limits, will change Cp <strong>and</strong> <strong>Pp</strong> <strong>and</strong> may change Cpk <strong>and</strong> <strong>Pp</strong>k<br />
Cp <strong>and</strong> Cpk use sigma estimator because they assume your data represents a<br />
sample of the population<br />
<strong>Pp</strong> <strong>and</strong> <strong>Pp</strong>k use st<strong>and</strong>ard deviation because they assume your data represents the<br />
total population<br />
©MMVI KnowWare International Inc. www.qimacros.com 2
Formula <strong>for</strong> Sigma Estimator<br />
St<strong>and</strong>ard deviation of a population can be estimated from the average range or average<br />
st<strong>and</strong>ard deviation of the samples in each subgroup. These are used to calculate C p <strong>and</strong><br />
C pk.<br />
ˆ <br />
ˆ <br />
R<br />
d<br />
2<br />
s<br />
c<br />
4<br />
For n=1-4, use R/d 2 <strong>for</strong>mula; <strong>for</strong> n>4 use s/c 4 <strong>for</strong>mula<br />
Here is Another Way of Looking at It<br />
Subgroup Size Sigma Estimator Formula Definitions<br />
1 to 4<br />
Rbar = Average of the<br />
( Rbar ) ranges<br />
( d 2 ) d 2 is a constant based on the<br />
5 or more<br />
( Sbar )<br />
( c 4 )<br />
sample size<br />
Sbar = Average of the<br />
st<strong>and</strong>ard deviations<br />
c 4 is a constant based on the<br />
sample size<br />
Constants <strong>for</strong> Sigma Estimator Calculation<br />
(Source:ASTM Manual on Presentation of Data <strong>and</strong> Control<br />
Chart Analysis – Table 16, 2002)<br />
Subgroup<br />
Size<br />
Constant Value Subgroup Constant Value<br />
Size<br />
1 d 2 1.128 26 c 4 0.9901<br />
2 d 2 1.128 27 c 4 0.9905<br />
3 d 2 1.693 28 c 4 0.9908<br />
4 d 2 2.059 29 c 4 0.9912<br />
5 c 4 0.94 30 c 4 0.9915<br />
6 c 4 0.9515 31 c 4 0.9917<br />
7 c 4 0.9594 32 c 4 0.992<br />
8 c 4 0.965 33 c 4 0.9922<br />
9 c 4 0.9693 34 c 4 0.9925<br />
10 c 4 0.9727 35 c 4 0.9927<br />
11 c 4 0.9754 36 c 4 0.9929<br />
12 c 4 0.9776 37 c 4 0.9931<br />
13 c 4 0.9794 38 c 4 0.9933<br />
14 c 4 0.981 39 c 4 0.9935<br />
©MMVI KnowWare International Inc. www.qimacros.com 3
15 c 4 0.9823 40 c 4 0.9936<br />
16 c 4 0.9835 41 c 4 0.9938<br />
17 c 4 0.9845 42 c 4 0.9939<br />
18 c 4 0.9854 43 c 4 0.9941<br />
19 c 4 0.9862 44 c 4 0.9942<br />
20 c 4 0.9869 45 c 4 0.9944<br />
21 c 4 0.9876 46 c 4 0.9945<br />
22 c 4 0.9882 47 c 4 0.9946<br />
23 c 4 0.9887 48 c 4 0.9947<br />
24 c 4 0.9892 49 c 4 0.9948<br />
25 c 4 0.9896 50 c 4 0.9949<br />
<strong>Formulas</strong> <strong>for</strong> One Sided Spec Limits<br />
LSL Only<br />
Cp = Cpk = CpL<br />
<strong>Pp</strong> = <strong>Pp</strong>k = <strong>Pp</strong>L<br />
USL Only<br />
Cp = Cpk = CpU<br />
<strong>Pp</strong> = <strong>Pp</strong>k = <strong>Pp</strong>U<br />
Formula <strong>for</strong> Defects in Parts Per Million<br />
Actual<br />
Estimated <strong>for</strong> Population<br />
(# of non con<strong>for</strong>ming)*1000000<br />
(# of parts)<br />
PPMU = NORMSDIST(Z upper)*1000000<br />
+<br />
PPML = NORMSDIST(Z lower)*1000000<br />
<strong>Formulas</strong> <strong>for</strong> Z Scores<br />
Z scores help estimate the non-con<strong>for</strong>ming PPM. Z scores st<strong>and</strong>ardize +/-3* sigma<br />
estimator values into +/-3.<br />
Zlower<br />
Zupper<br />
Zbench is the Z score <strong>for</strong> the<br />
Expected PPM<br />
ZT (target) = Cpk <strong>for</strong> a target<br />
value instead of the USL or<br />
LSL. If not defined, use the<br />
midpoint between the USL <strong>and</strong><br />
LSL<br />
(LSL-Xbar)/sigest<br />
(USL-Xbar)/ sigest<br />
normsinv(1-(Expected PPM/1,000,000))<br />
(Xbar-Target)/(3*sigest)<br />
©MMVI KnowWare International Inc. www.qimacros.com 4
Sample Calculation<br />
Let's per<strong>for</strong>m calculations using the following sample data from Montgomery, Intro to<br />
SPC, 4th Ed., pgs. 353-358. You can download this data as part of the <strong>QI</strong> <strong>Macros</strong> test<br />
data at http://www.qimacros.com/testdata/SPCManufacturing.xls Open the<br />
spreadsheet <strong>and</strong> click on the histogram tab.<br />
Sample Obs<br />
1<br />
Obs<br />
2<br />
Obs<br />
3<br />
Obs<br />
4<br />
Obs<br />
5<br />
S1 265 205 263 307 220<br />
S2 268 260 234 299 215<br />
S3 197 286 274 243 231<br />
S4 267 281 265 214 318<br />
S5 346 317 242 258 276<br />
S6 300 208 187 264 271<br />
S7 280 242 260 321 228<br />
S8 250 299 258 267 293<br />
S9 265 254 281 294 223<br />
S10 260 308 265 283 277<br />
S11 200 235 246 328 296<br />
S12 276 264 269 235 290<br />
S13 221 176 258 263 231<br />
S14 334 280 265 272 283<br />
S15 265 262 271 245 301<br />
S16 280 274 253 287 258<br />
S17 261 248 260 274 337<br />
S18 250 278 254 274 275<br />
S19 278 250 265 270 298<br />
S20 257 210 280 269 251<br />
Assume the USL = 346 <strong>and</strong> the LSL = 200.<br />
Since there are 5 subgroups, sigma estimator will use the <strong>for</strong>mula SBar/c 4<br />
If we look in the table above, the constant <strong>for</strong> a subgroup of 5 is 0.94<br />
Other calculations <strong>for</strong> this data set are:<br />
o Xbar = 26,446/100=264.46<br />
o St<strong>and</strong>ard deviation = 31.85<br />
o Sigma estimator = ( SBar/c 4 ) = (30.02/.94) = 31.93<br />
If you are trying to recalculate this manually, use the statistical functions in <strong>Excel</strong> to<br />
calculate: st<strong>and</strong>ard deviation, normdist <strong>and</strong> normsinv.<br />
©MMVI KnowWare International Inc. www.qimacros.com 5
Cp<br />
Calculations<br />
Formula Calc Calc Value<br />
( USL-LSL )<br />
6*( SBar/c 4 )<br />
( 346-200 )<br />
6*(30.02/.94)<br />
146<br />
191.62<br />
.762<br />
<strong>Pp</strong> ( USL-LSL )<br />
(6 *st<strong>and</strong>ard dev)<br />
CpU<br />
( USL-Xbar )<br />
3 *( SBar/c 4 )<br />
( 346-200 )<br />
(6 * 31.85)<br />
( 346-264.46 )<br />
(3 * (30.02/.94)<br />
146<br />
191.10<br />
81.54<br />
95.81<br />
.764<br />
.851<br />
CpL<br />
( Xbar - LSL )<br />
3 * ( SBar/c 4 )<br />
(264.46-200 )<br />
(3 * (30.02/.94)<br />
64.46<br />
95.81<br />
.673<br />
Cpk<br />
Minimum of CpU <strong>and</strong><br />
CpL<br />
.851 vs .673 .673<br />
<strong>Pp</strong>U<br />
( USL-Xbar )<br />
(3 * st<strong>and</strong>ard deviation)<br />
( 346-264.46 )<br />
3 * 31.85<br />
81.54<br />
95.55<br />
.853<br />
<strong>Pp</strong>L<br />
( Xbar - LSL-)<br />
(3 * st<strong>and</strong>ard deviation)<br />
(264.46-200 )<br />
3 * 31.85<br />
64.46<br />
95.55<br />
.675<br />
<strong>Pp</strong>k<br />
Minimum of <strong>Pp</strong>U <strong>and</strong> <strong>Pp</strong>L .853 vs .675 .675<br />
Actual<br />
PPM<br />
(# of non con<strong>for</strong>ming parts<br />
(# of parts)<br />
3<br />
100<br />
30,000<br />
1,000,000<br />
30,000<br />
Est<br />
PPM<br />
PPM Upper + PPM lower<br />
=<br />
(1-NORMSDIST(Zu)) *<br />
1,000,000<br />
+<br />
NORMSDIST(Zl) *<br />
1,000,000<br />
(1-<br />
NORMSDIST<br />
(2.553) )*<br />
1000000<br />
+<br />
NORMSDIST<br />
(2.019) *<br />
1000000<br />
Z 346 - 264.46<br />
21,768.4<br />
+<br />
5334.3 27,102.7<br />
©MMVI KnowWare International Inc. www.qimacros.com 6
upper<br />
(Zu)<br />
Z<br />
lower<br />
(Zl)<br />
Z<br />
bench<br />
Target<br />
Z<br />
target<br />
( USL-Ave )<br />
( SBar/c 4 )<br />
( LSL -Ave )<br />
( SBar/c 4 )<br />
normsinv(1-(Expected<br />
PPM/1,000,000))<br />
Defined by Customer or<br />
Midpoint between<br />
USL <strong>and</strong> LSL<br />
ABS(Xbar-Target)<br />
(3*sigest)<br />
31.93 2.553<br />
200 - 264.46<br />
31.93 -2.019<br />
normsinv(1-<br />
(.0267104)<br />
(346 +200)<br />
2<br />
264.46 - 273<br />
3*(30.02/.94)<br />
normsinv(.97329) 1.93<br />
546<br />
2 273<br />
8.54<br />
95.81<br />
.09<br />
The final calculated amounts are:<br />
Cp .762<br />
Cpk .673<br />
<strong>Pp</strong> .764<br />
<strong>Pp</strong>k .675<br />
PPM 30,000<br />
Est PPM 27,102.7<br />
Zbench 1.93<br />
Z target .09<br />
Since the st<strong>and</strong>ard deviation <strong>and</strong> sigma estimator were fairly close in value, the Cp <strong>and</strong><br />
<strong>Pp</strong> <strong>and</strong> Cpk <strong>and</strong> <strong>Pp</strong>k values were very similar.<br />
©MMVI KnowWare International Inc. www.qimacros.com 7
Histogram in the <strong>QI</strong> <strong>Macros</strong> SPC Software<br />
If you run a histogram in the <strong>QI</strong> <strong>Macros</strong> using the above data you should get the same<br />
results. Make sure you input the USL= 346 <strong>and</strong> the LSL = 200.<br />
©MMVI KnowWare International Inc. www.qimacros.com 8