Lean Six Sigma Action Plan 2012.p65 - QI Macros for Excel
Lean Six Sigma Action Plan 2012.p65 - QI Macros for Excel
Lean Six Sigma Action Plan 2012.p65 - QI Macros for Excel

You also want an ePaper? Increase the reach of your titles
YUMPU automatically turns print PDFs into web optimized ePapers that Google loves.
Are Delays, Defects and Deviation<br />
EatingYour Profits?<br />
<strong>Lean</strong> <strong>Six</strong> <strong>Sigma</strong><br />
Million Dollar Money Belt<br />
<strong>Action</strong> <strong>Plan</strong><br />
Plug the Leaks in Your Cash Flow!<br />
Jay Arthur - The KnowWare® Man<br />
KnowWare International, Inc. www.qimacros.com<br />
2253 S. Oneida St., Ste 3D jay@qimacros.com<br />
Denver, CO 80224 (888) 468-1537<br />
Signup <strong>for</strong> our free Money Belt Training at:<br />
www.lssmb.com<br />
© 2012 Jay Arthur (888) 468-1537 1<br />
qimacros.com <strong>Lean</strong> <strong>Six</strong> <strong>Sigma</strong> <strong>Action</strong> <strong>Plan</strong>
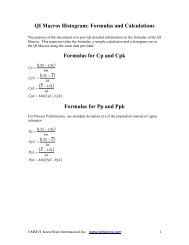
Targets<br />
Defects/Million<br />
1 690,000<br />
2 308,733<br />
3 66,803<br />
4 6,210<br />
5 233<br />
6 3.4<br />
The<br />
Improvement<br />
Journey<br />
In the long run, the<br />
only sustainable<br />
source of competitive<br />
advantage is your<br />
organization's ability<br />
to learn faster than its<br />
competition.<br />
Peter Senge<br />
<strong>Lean</strong> <strong>Six</strong> <strong>Sigma</strong><br />
What Is the <strong>Lean</strong> <strong>Six</strong> <strong>Sigma</strong> Mindset?<br />
<strong>Lean</strong> <strong>Six</strong> <strong>Sigma</strong> is a results-oriented, project-focused approach to<br />
quality. It's a way of measuring and setting targets <strong>for</strong> reductions in<br />
product or service defects that is directly connected to customer<br />
requirements. These reductions in the cost of poor quality translate<br />
into cost savings and competitive advantage.<br />
In Built To Last, (Collins 1997), the authors mention the need <strong>for</strong> a<br />
BHAG or Big Hairy Audacious Goal. Using <strong>Lean</strong> <strong>Six</strong> <strong>Sigma</strong> as a<br />
guide, you can measure your current per<strong>for</strong>mance in defects per<br />
million and set a BHAG of reaching the next level sigma. Set a<br />
goal to reach level 5, estimating 18-24 months per step.<br />
When you start to improve your speed and quality, you become a<br />
detective like Sherlock Holmes. You let the evidence (your data) lead<br />
you step-by-step to the true culprit–the root cause. When you do,<br />
you’ll stop using trial and error, or gut feel to fix things. You start using<br />
some common science. <strong>Lean</strong> <strong>Six</strong> <strong>Sigma</strong> offers a proven, systematic<br />
method to continuously improve every aspect of your business. <strong>Lean</strong><br />
<strong>Six</strong> <strong>Sigma</strong> begins with focusing ef<strong>for</strong>t <strong>for</strong> maximum benefit, then<br />
improving the processes, sustaining the improvement and honoring<br />
your progress.<br />
.<br />
<strong>Lean</strong> <strong>Six</strong><br />
<strong>Sigma</strong><br />
Demystified<br />
FISH Step Activity<br />
Focus 1 Focus the improvement ef<strong>for</strong>t<br />
Improve 2 Reduce delay, defects, and deviation<br />
Sustain 3 Stabilize and sustain the improvement<br />
Honor 4 Recognize, review and refocus ef<strong>for</strong>ts<br />
© 2012 Jay Arthur (888) 468-1537 2<br />
qimacros.com <strong>Lean</strong> <strong>Six</strong> <strong>Sigma</strong> <strong>Action</strong> <strong>Plan</strong>
Eliminate<br />
Delay!<br />
If you can't quickly<br />
take throughput<br />
times down by half in<br />
product<br />
development, 75<br />
percent in order<br />
processing, and 90<br />
percent in physical<br />
production, you are<br />
doing something<br />
wrong.<br />
James P. Womack<br />
and Daniel T. Jones<br />
Authors of <strong>Lean</strong><br />
Thinking<br />
The Power Laws of Speed<br />
<strong>Lean</strong><br />
When you shorten lead times and focus on keeping production<br />
lines easily changeable, you actually get higher quality,<br />
faster response times, better productivity and better use of<br />
equipment and space.<br />
At the end of 2003, Toyota's annual profit, at $8.3 Billion, was<br />
larger than GM, Chrysler, and Ford combined.<br />
Typical results from implementing <strong>Lean</strong> thinking:<br />
• 90% reduction in lead times<br />
• 90% reduction in all inventories<br />
• 100% increase in productivity<br />
• 50% reduction in errors<br />
• Fewer injuries<br />
The 3-57 Rule<br />
Employees are only working on the product or service <strong>for</strong><br />
3 minutes out of every 60. The product or service lounges<br />
around <strong>for</strong> the other 57 minutes.<br />
Make your product faster, not your people.<br />
The 15-2-20 Rule<br />
Every 15 minute per hour reduction in elapsed time will<br />
double productivity and reduce unnecessary costs<br />
by 20 percent.<br />
The 3X2 Rule<br />
<strong>Lean</strong> companies grow three times faster than average<br />
and double their profit margins.<br />
Customers will pay a premium <strong>for</strong> speed.<br />
Inshoring Oddly enough, when you go <strong>Lean</strong>, you no longer<br />
need to offshore work which, by design, requires large<br />
inventories be shipped <strong>for</strong> weeks over oceans and then<br />
transported from ports on the coast.<br />
Economic Bounce About half of any economic downswing<br />
is caused by companies and customers working off<br />
finished inventories that were built up earlier by mass<br />
production. In a <strong>Lean</strong> economy, there are no inventories.<br />
© 2012 Jay Arthur (888) 468-1537 3<br />
qimacros.com <strong>Lean</strong> <strong>Six</strong> <strong>Sigma</strong> <strong>Action</strong> <strong>Plan</strong>
Redesign <strong>for</strong> Speed<br />
Case Study<br />
Hospital labs reduced<br />
unnecessary<br />
movement of people<br />
and samples by<br />
57% in a 2,400 sq.<br />
ft. lab and freed up<br />
400 sq. ft. <strong>for</strong> other<br />
purposes.<br />
Labs used STAT<br />
centrifuges instead<br />
of slower bucket<br />
centrifuges saving 7<br />
minutes per test.<br />
This reduced turnaround<br />
times by a<br />
third and reduced<br />
errors and rework.<br />
The trick is eliminating all of the delay between value-adding<br />
steps and lining up all of the machines and processes so that<br />
the product or service flows through the value channel<br />
without interruption. The mental shift required to move from<br />
mass production to speed production is to focus on continuous<br />
flow of small lots.<br />
The Redesign Process<br />
1. Focus on the part, product or service itself. Follow the<br />
product through its entire production cycle.<br />
In a hospital you would follow a patient through from admission<br />
to discharge. In a printing company, you'd follow a job<br />
from start to delivery. In a manufacturing plant, follow the<br />
product from order to delivery.<br />
2. Eliminate the delay between steps using value stream<br />
mapping:<br />
IN<br />
OUT<br />
3. Evalulate and realign the work flow into production<br />
"cells" to eliminate unnecessary movement using spaghetti<br />
diagramming:<br />
4. "Right size" the machines and technology to support<br />
smaller lots, quick changeover, and one-piece flow.<br />
The goal of flow is to eliminate all delays, interruptions and<br />
stoppages, and not to rest until you succeed.<br />
Common measures of flow:<br />
• Lead (or cycle) time: how long product stays in the system<br />
• Travel distance of the product or people doing the work<br />
© 2012 Jay Arthur (888) 468-1537 4<br />
qimacros.com <strong>Lean</strong> <strong>Six</strong> <strong>Sigma</strong> <strong>Action</strong> <strong>Plan</strong>
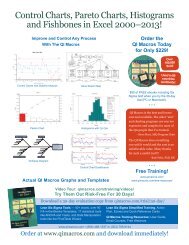
Develop Compelling<br />
Improvement Stories!<br />
1. Count Your Defects, Errors or Mistakes<br />
4-50 Rule<br />
Control Chart<br />
2. Categorize by Type<br />
Pareto’s Rule<br />
Less than 4% of any business creates<br />
over 50% of the waste, rework, and<br />
lost profit. Like a crime scene investigator<br />
reviewing <strong>for</strong>ensic evidence, you<br />
can use data you already have to find<br />
and fix these root causes, and save a<br />
ton of money.<br />
80%<br />
64%<br />
4-50 Rule<br />
20% 20% 20% 20% 20%<br />
3. Analyze Parts of<br />
the Problem<br />
Simultaneously<br />
4. Prevent The Problem<br />
COUNTERMEASURE<br />
© 2012 Jay Arthur (888) 468-1537 5<br />
qimacros.com <strong>Lean</strong> <strong>Six</strong> <strong>Sigma</strong> <strong>Action</strong> <strong>Plan</strong>
<strong>Six</strong> <strong>Sigma</strong><br />
Step 1 - Define The Problem<br />
Purpose<br />
Define a specific problem area and<br />
set a target <strong>for</strong> improvement<br />
Problems are only<br />
opportunities in work<br />
clothes.<br />
-Henry J. Kaiser<br />
There are two ways of looking at problems:<br />
Increase (you want more of a "good" thing)<br />
Decrease (you want less of a "bad" thing)<br />
These are often two sides of the same coin:<br />
an increase in ... is equal to a decrease in . . .<br />
quality number or percent defective<br />
speed cycle time–to deliver a product or service<br />
idle time–people, materials, machines<br />
profitability cost of waste and rework<br />
Measurement<br />
Example:<br />
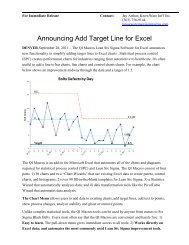
Solving problems is usually easiest when you focus on<br />
decreasing the "bad" rather than increasing the "good,"<br />
because most good things are effects of fixing the bad. Most<br />
problems can be easily expressed as a control chart showing<br />
the current trend and desired reduction in either cycle time,<br />
defects, or cost. Begin by graphing the current problem:<br />
Reduce<br />
Fulfillment<br />
Errors<br />
Target: 5 or less<br />
© 2012 Jay Arthur (888) 468-1537 6<br />
qimacros.com <strong>Lean</strong> <strong>Six</strong> <strong>Sigma</strong> <strong>Action</strong> <strong>Plan</strong>
<strong>Six</strong> <strong>Sigma</strong><br />
Step 1 - Define The Problem<br />
Problem:<br />
(circle one)<br />
Reduce Defects, Deviation or<br />
Cost to deliver<br />
product or service<br />
Number of<br />
Data Points =<br />
Number or Percent<br />
Defective<br />
Cost per Unit<br />
Waste or Rework<br />
Good<br />
UCL<br />
CL<br />
LCL<br />
units (of time—hours, days, weeks)<br />
To automate all of your graphs, charts, and diagrams<br />
get the <strong>QI</strong> <strong>Macros</strong> SPC Software <strong>for</strong> <strong>Excel</strong><br />
www.qimacros.com<br />
<strong>QI</strong> <strong>Macros</strong>: Control Charts<br />
© 2012 Jay Arthur (888) 468-1537 7<br />
qimacros.com <strong>Lean</strong> <strong>Six</strong> <strong>Sigma</strong> <strong>Action</strong> <strong>Plan</strong>
Pareto Chart<br />
We only admit to<br />
minor faults to<br />
persuade ourselves<br />
that we have no<br />
major ones.<br />
- La Rochefoucauld<br />
A problem well<br />
stated is a problem<br />
half solved.<br />
Problem<br />
Statement<br />
<strong>Six</strong> <strong>Sigma</strong><br />
Step 1 - Define The Problem<br />
Problem areas are usually too big and complex to be solved<br />
with one project, but when we whittle it down into small<br />
enough pieces, we can fix each one easily and effectively.<br />
This step uses the Pareto<br />
chart (a bar chart and a<br />
cumulative line graph) to<br />
identify the most important<br />
problem to improve first.<br />
Often, two or more pareto<br />
charts are needed to get to<br />
a problem specific enough<br />
to analyze easily. The left<br />
axis shows the number of<br />
occurrences <strong>for</strong> each bar.<br />
The right axis shows the<br />
cumulative percentage <strong>for</strong><br />
the line graph.<br />
Begin by identifying the<br />
components of the problem:<br />
Indicator<br />
Defects<br />
Time<br />
Cost<br />
Pareto Components<br />
- types of defects<br />
- steps or delays in a process<br />
- types of costs--rework, waste<br />
Once we have whittled the problem down to a small enough<br />
piece, we can then write a problem statement about the<br />
major contributor. This will serve as the basis <strong>for</strong> identifying<br />
root causes. We also need to set a target <strong>for</strong> improvement.<br />
Problem Statement: During the 2009-2011, invoicing<br />
accounted <strong>for</strong> 31% of all shipments not received, which<br />
was 2X higher than desired and resulted in 83 resent<br />
packages.<br />
Target: 50% reduction in shipments not received.<br />
© 2012 Jay Arthur (888) 468-1537 8<br />
qimacros.com <strong>Lean</strong> <strong>Six</strong> <strong>Sigma</strong> <strong>Action</strong> <strong>Plan</strong>
<strong>Six</strong> <strong>Sigma</strong><br />
Step 1 - Define The Problem<br />
Target = ______<br />
Problem Statement<br />
During ______, ____, ____________accounted <strong>for</strong> ___% of _____________,<br />
(Months) (Year) (Big Bar) (time, defects, cost)<br />
which was ____ Higher than desired and resulted in ____________________.<br />
(Gap)<br />
(Pain)<br />
© 2012 Jay Arthur (888) 468-1537 9<br />
qimacros.com <strong>Lean</strong> <strong>Six</strong> <strong>Sigma</strong> <strong>Action</strong> <strong>Plan</strong>
<strong>Six</strong> <strong>Sigma</strong><br />
Step 2 - Analyze the Problem<br />
Purpose<br />
For every thousand<br />
hacking at the leaves<br />
of evil, there is one<br />
striking at the root.<br />
-Thoreau<br />
Cause-Effect<br />
Analysis<br />
Identify and verify the root causes<br />
of the problem<br />
Like weeds, all problems have various root causes. Remove<br />
the roots and, like magic, the weeds disappear.<br />
1. To identify root causes, use the fishbone or Ishikawa<br />
diagram. Put the problem statement from step 1 in<br />
the head of the fish and the major causes at the end<br />
of the major bones. Major causes include:<br />
• Processes, machines, materials, measurement,<br />
people, environment<br />
• Steps of a process (step1, step 2, etc.)<br />
• Whatever makes sense<br />
2. Begin with the most likely main cause.<br />
3. For each cause, ask "Why?" up to five times.<br />
4. Circle one-to-five root causes (end of "why" chain)<br />
5. Verify the root causes with data (Pareto, Scatter)<br />
Implemented<br />
Process<br />
Changes<br />
75%<br />
Reduction<br />
© 2012 Jay Arthur (888) 468-1537 10<br />
qimacros.com <strong>Lean</strong> <strong>Six</strong> <strong>Sigma</strong> <strong>Action</strong> <strong>Plan</strong>
<strong>Six</strong> <strong>Sigma</strong><br />
Step 2 - Analyze the Problem<br />
© 2012 Jay Arthur (888) 468-1537 11<br />
qimacros.com <strong>Lean</strong> <strong>Six</strong> <strong>Sigma</strong> <strong>Action</strong> <strong>Plan</strong>
<strong>Six</strong> <strong>Sigma</strong><br />
Step 3 - Prevent the Problem<br />
Purpose<br />
Take away the cause,<br />
and the effect ceases.<br />
- Cervantes<br />
Defining<br />
Countermeasures<br />
COUNTERMEASURE<br />
Identify the countermeasures required to<br />
reduce or eliminate the root causes<br />
Like ecological weed prevention, a countermeasure prevents<br />
problems from ever taking root in a process. A good<br />
countermeasure not only eliminates the root cause but also<br />
prevents other weeds from growing.<br />
1. Transfer the problem statement from step 2 and the<br />
root causes from step 3.<br />
2. For each root cause, identify one to three broad<br />
countermeasures (what to do).<br />
3. Rank the effectiveness of each countermeasure<br />
(Low, Medium, or High)<br />
4. Identify the specific actions (how to do it) <strong>for</strong><br />
implementing each countermeasure<br />
5. Rank the feasibility (time, cost) of each specific<br />
action (Low, Medium, or High).<br />
6. Decide which specific actions to implement.<br />
© 2012 Jay Arthur (888) 468-1537 12<br />
qimacros.com <strong>Lean</strong> <strong>Six</strong> <strong>Sigma</strong> <strong>Action</strong> <strong>Plan</strong>
Your “Million Dollar Money Belt”<br />
Improvement Strategy<br />
© 2012 Jay Arthur (888) 468-1537 13<br />
qimacros.com <strong>Lean</strong> <strong>Six</strong> <strong>Sigma</strong> <strong>Action</strong> <strong>Plan</strong>
<strong>Lean</strong> <strong>Six</strong> <strong>Sigma</strong><br />
Cut costs up to 40% and add them to your bottom line!<br />
It happened again. I was talking to someone that went on and on about how they’d tried<br />
<strong>Lean</strong> <strong>Six</strong> <strong>Sigma</strong>. They trained lots of black belts and green belts. Several years and millions<br />
of dollars later they still have next to nothing to show <strong>for</strong> it. Don’t let this happen to you!<br />
Become a <strong>Lean</strong> <strong>Six</strong> <strong>Sigma</strong> “Money Belt” at www.lssmb.com<br />
Instead of black or green belt, you want to be a “money belt!” I want you to learn the actual<br />
methods, strategies, and techniques I’ve used to generate millions of dollars in savings <strong>for</strong><br />
my clients. I’ll teach you how to systematically save big bucks and add it to your profits.<br />
If you are serious about starting or remaking your process improvement program into one<br />
that achieves breakthrough reductions in cycle time, defects, and costs while maximizing<br />
bottom-line benefits and minimizing your investment, this is the strategy <strong>for</strong> you. Quite<br />
frankly, it doesn’t matter what industry you’re in, or what product or service you have. If<br />
you’re a $10 million company or larger and have problems with speed, quality and value,<br />
you can start using these <strong>Lean</strong> <strong>Six</strong> <strong>Sigma</strong> tools right now to routinely add big profits to your<br />
bottom line.<br />
The Bad News (The Fix-It Factory)<br />
Your Factory Your Customer<br />
Your Fix-it Factory<br />
In your business there are two factories: one that delivers products or services, and the<br />
“Fix It” factory that repairs all of the mistakes created by the first factory. If you’re a “3-<br />
sigma” business (3% error or 30,000 defects/million), that’s 3% in orders, 3% in fulfillment,<br />
3% in billing...your real error rate is 6%, 12%, 18% or worse. And each error costs more to<br />
fix than it did to create it. Between $25-$40 of every $100 you spend is wasted on fixing<br />
defective products or services. That’s a big bite out of your profits. OUCH!<br />
What Most Consultants Don’t Want You To Know!<br />
If you’re a 3-sigma company, then you can solve 90% of your current problems using<br />
three tools: control chart, pareto chart, and fishbone diagram. Focused application of these<br />
tools can take you from 3 to 5 sigma (233 defects/millions) in 18-24 months. Then you’ll be<br />
ready <strong>for</strong> some Black belt training, but until then you’re just wasting your money fattening<br />
resumes.<br />
A Model That Works<br />
After decades of working with improvement teams, I’ve found a consistent, foolproof<br />
method to achieve breakthrough improvements:<br />
1. Focus the improvement ef<strong>for</strong>t to minimize the cost and maximize the gain.<br />
2. Improve dramatically your speed, quality, and cost.<br />
3. Sustain the improvement to maximize your productivity and profitability.<br />
4. Honor your progress by recognizing your team’s ef<strong>for</strong>ts.<br />
© 2012 Jay Arthur (888) 468-1537 14<br />
qimacros.com <strong>Lean</strong> <strong>Six</strong> <strong>Sigma</strong> <strong>Action</strong> <strong>Plan</strong>
<strong>Lean</strong> <strong>Six</strong> <strong>Sigma</strong><br />
One Day Workshop<br />
How to Reduce Costs and Increase Profits!<br />
Typical <strong>Lean</strong> <strong>Six</strong> <strong>Sigma</strong> training takes 10-<br />
20 days spread over 2-4 months at costs<br />
ranging from $5,000 to $40,000 per person.<br />
I do it in one day with up to 25 people <strong>for</strong><br />
as little as $8,500 ($340/person).<br />
I call it Money Belt training, because we focus<br />
on teaching the essential methods and<br />
tools you need to start achieving results and<br />
moving toward 5-sigma.<br />
Frankly, most people aren't ready <strong>for</strong> all of<br />
the complex statistics and tools required to<br />
achieve <strong>Six</strong> <strong>Sigma</strong>. With Money Belt training,<br />
you only learn the essential tools necessary<br />
to start cutting costs and boosting<br />
profits.<br />
If your company is like other successful and<br />
profitable companies, you may not be sure<br />
that <strong>Lean</strong> <strong>Six</strong> <strong>Sigma</strong> can improve your bottom<br />
line, but after looking at all kinds of companies,<br />
I can tell you that most are successful<br />
and profitable while barely 3 sigma.<br />
You don't need to be a Black Belt in statistical<br />
methods to start making big gains. You<br />
only need a few key methods and tools and<br />
lots of improvements to achieve 5-sigma.<br />
And we tailor our training to your company's<br />
data and needs, because you learn better<br />
when it's relevant to your job. We like to develop<br />
improvement stories right in the classroom<br />
so that you'll be ready to start root<br />
cause analysis immediately.<br />
Workshop Outline<br />
Overview<br />
• What are <strong>Lean</strong> and <strong>Six</strong> <strong>Sigma</strong>?<br />
• How to Avoid the Tarpits of <strong>Lean</strong> <strong>Six</strong> <strong>Sigma</strong><br />
• Why <strong>Lean</strong> <strong>Six</strong> <strong>Sigma</strong> will boost your profits<br />
and baffle your competition.<br />
<strong>Lean</strong> Simplified (3-57 Rule)<br />
• The Speed Bumps of <strong>Lean</strong><br />
• Value Stream Mapping<br />
• Spaghetti Diagramming<br />
Focus <strong>for</strong> Laser-Like Improvement<br />
• 4-50 Rule<br />
• Data Mining with <strong>Excel</strong> PivotTables<br />
• Control Charts and Pareto Charts<br />
Improve the Process<br />
• Root Cause Analysis and Verification<br />
Sustain the Improvement<br />
• Using Control Charts<br />
• Analyzing Stability and Capability<br />
Honor Your Progress<br />
• Recognize, Review, and Refocus<br />
Materials Provided<br />
• <strong>Lean</strong> Simplified Book<br />
• <strong>Six</strong> <strong>Sigma</strong> Simplified Book<br />
• <strong>Lean</strong> <strong>Six</strong> <strong>Sigma</strong> SPC Quick Reference Cards<br />
• 25 <strong>QI</strong> <strong>Macros</strong><br />
Investment: $8,500 (U.S. only)<br />
(Includes travel within the 48 states.)<br />
Call Now: www.qimacros.com 888-468-1535<br />
© 2012 Jay Arthur (888) 468-1537 15<br />
qimacros.com <strong>Lean</strong> <strong>Six</strong> <strong>Sigma</strong> <strong>Action</strong> <strong>Plan</strong>
Working with Jay Arthur<br />
This workbook is an outline of the improvement areas<br />
that I explore with my results-oriented clients. My goal is<br />
to help you understand how to make dramatic improvements<br />
in your business per<strong>for</strong>mance by simplifying the<br />
approach and narrowing the focus to ensure success.<br />
Haven’t you waited long enough to start getting the<br />
results you want? You can take advantage of these<br />
services in the following <strong>for</strong>mats:<br />
The <strong>Lean</strong> <strong>Six</strong> <strong>Sigma</strong> Simplified System (Item #490)<br />
Have you ever noticed that once you learn something, you use 20% of the<br />
tools about 80% of the time? That’s what I’ve done with the <strong>Lean</strong> <strong>Six</strong> <strong>Sigma</strong><br />
Simplified System–packaged the vital few tools that you need to make<br />
breakthrough improvements. No matter where you are now, these tools can<br />
take you to five <strong>Sigma</strong> (233 defects/million) in 18-24 months. This package<br />
includes: <strong>Lean</strong> <strong>Six</strong> <strong>Sigma</strong> workbook (140+ pgs), <strong>QI</strong> <strong>Macros</strong> <strong>for</strong> <strong>Excel</strong> (automates<br />
all of your graphs), <strong>QI</strong> <strong>Macros</strong> Training CD-ROM and the <strong>Lean</strong> <strong>Six</strong><br />
<strong>Sigma</strong> “Training Audio.<br />
Investment $997 plus S&H To Order Call 888-468-1537<br />
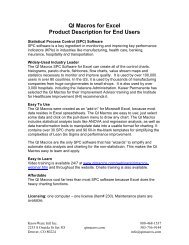
<strong>QI</strong> <strong>Macros</strong> <strong>Lean</strong> <strong>Six</strong> <strong>Sigma</strong> SPC Software (Item #230)<br />
Draw Control Charts, Histograms, Paretos<br />
and Fishbones in <strong>Excel</strong> 2000-2012!<br />
<strong>QI</strong> <strong>Macros</strong> Starter Kit (Item #275)<br />
For those who would like a little guidance, we created a starter package:<br />
• <strong>QI</strong> <strong>Macros</strong> <strong>Lean</strong> <strong>Six</strong> <strong>Sigma</strong> SPC Software <strong>for</strong> <strong>Excel</strong><br />
• <strong>QI</strong> <strong>Macros</strong> Computer-based Training CD-ROM<br />
• <strong>Six</strong> <strong>Sigma</strong> Tools Example Book<br />
Call Today! 888-468-1537 or (303) 756-9144<br />
jay@qimacros.com<br />
www.qimacros.com<br />
© 2012 Jay Arthur (888) 468-1537 16<br />
qimacros.com <strong>Lean</strong> <strong>Six</strong> <strong>Sigma</strong> <strong>Action</strong> <strong>Plan</strong>