2007 Silicon Valley Projections - Silicon Valley Leadership Group
2007 Silicon Valley Projections - Silicon Valley Leadership Group
2007 Silicon Valley Projections - Silicon Valley Leadership Group

You also want an ePaper? Increase the reach of your titles
YUMPU automatically turns print PDFs into web optimized ePapers that Google loves.
Education<br />
Bay Area, 2005). However, the rate at which Latinos and other<br />
population subgroups in <strong>Silicon</strong> <strong>Valley</strong> and throughout<br />
California are enrolling in college preparatory classes, in<br />
colleges and universities, and filling high growth industry<br />
jobs is lagging.<br />
In light of our changing economy and demographics, how can<br />
all California students meet increasing expectations and be<br />
part of a vibrant innovation economy?<br />
Competition from all sides<br />
How California and <strong>Silicon</strong> <strong>Valley</strong> Match Up<br />
California’s K-12 schools continue to fall behind their counterparts<br />
nationwide on indicators like per pupil funding, student-teacher<br />
ratio, and counselors per student.<br />
Although the high school graduation rate in California is<br />
comparable to the other technology regions in the country at<br />
84.9% (using the federal NCES definition)—and as with<br />
other aspects of educational achievement in the state, <strong>Silicon</strong><br />
<strong>Valley</strong> is higher than the state average (90.1%)—the number<br />
falls within ethnic subpopulations. Moreover,<br />
California students as a whole continue to make gains in math<br />
and English, as demonstrated through the National<br />
Assessment of Educational Progress (NAEP). However, when<br />
looking at states with other high tech centers, California students<br />
have a lot of ground to make up in the “proficient” and<br />
“advanced” levels.<br />
Student & Workforce Demographics:<br />
How California and <strong>Silicon</strong><br />
<strong>Valley</strong> are Changing<br />
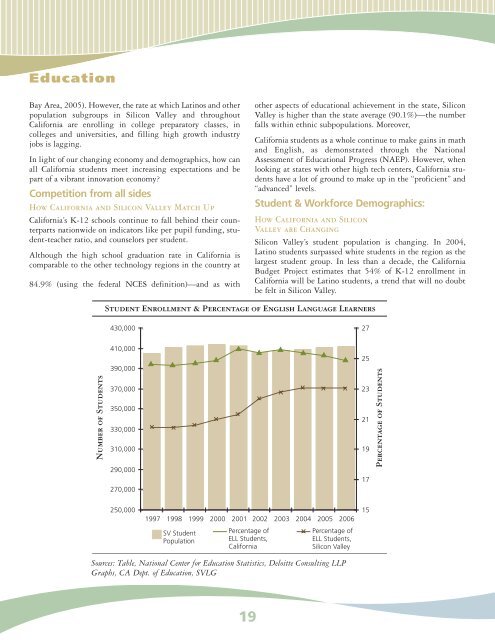
<strong>Silicon</strong> <strong>Valley</strong>’s student population is changing. In 2004,<br />
Latino students surpassed white students in the region as the<br />
largest student group. In less than a decade, the California<br />
Budget Project estimates that 54% of K-12 enrollment in<br />
California will be Latino students, a trend that will no doubt<br />
be felt in <strong>Silicon</strong> <strong>Valley</strong>.<br />
Student Enrollment & Percentage of English Language Learners<br />
430,000<br />
27<br />
Number of Students<br />
410,000<br />
390,000<br />
370,000<br />
350,000<br />
330,000<br />
310,000<br />
290,000<br />
270,000<br />
25<br />
23<br />
21<br />
19<br />
17<br />
Percentage of Students<br />
250,000<br />
1997 1998 1999 2000 2001 2002 2003 2004 2005 2006<br />
SV Student<br />
Population<br />
Percentage of<br />
ELL Students,<br />
California<br />
Percentage of<br />
ELL Students,<br />
<strong>Silicon</strong> <strong>Valley</strong><br />
15<br />
Sources: Table, National Center for Education Statistics, Deloitte Consulting LLP<br />
Graphs, CA Dept. of Education, SVLG<br />
19