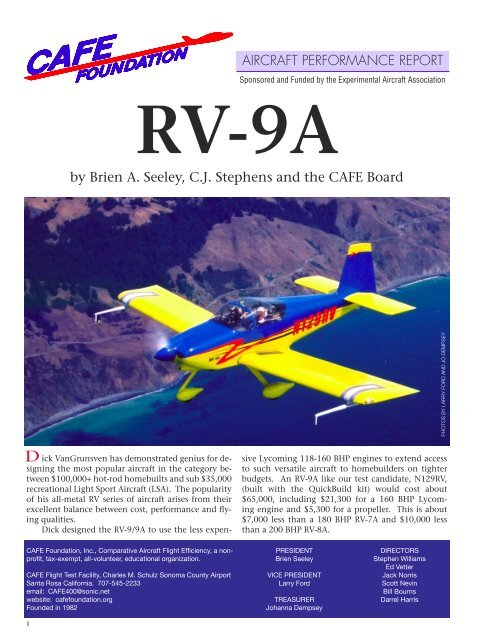
RV-9A CAFE APR-condensed - CAFE Foundation
RV-9A CAFE APR-condensed - CAFE Foundation
RV-9A CAFE APR-condensed - CAFE Foundation

Create successful ePaper yourself
Turn your PDF publications into a flip-book with our unique Google optimized e-Paper software.
AIRCRAFT PERFORMANCE REPORT<br />
Sponsored and Funded by the Experimental Aircraft Association<br />
<strong>RV</strong>-<strong>9A</strong><br />
by Brien A. Seeley, C.J. Stephens and the <strong>CAFE</strong> Board<br />
PHOTOS BY LARRY FORD AND JO DEMPSEY<br />
D<br />
ick VanGrunsven has demonstrated genius for designing<br />
the most popular aircraft in the category between<br />
$100,000+ hot-rod homebuilts and sub $35,000<br />
recreational Light Sport Aircraft (LSA). The popularity<br />
of his all-metal <strong>RV</strong> series of aircraft arises from their<br />
excellent balance between cost, performance and flying<br />
qualities.<br />
Dick designed the <strong>RV</strong>-9/<strong>9A</strong> to use the less expensive<br />
Lycoming 118-160 BHP engines to extend access<br />
to such versatile aircraft to homebuilders on tighter<br />
budgets. An <strong>RV</strong>-<strong>9A</strong> like our test candidate, N129<strong>RV</strong>,<br />
(built with the QuickBuild kit) would cost about<br />
$65,000, including $21,300 for a 160 BHP Lycoming<br />
engine and $5,300 for a propeller. This is about<br />
$7,000 less than a 180 BHP <strong>RV</strong>-7A and $10,000 less<br />
than a 200 BHP <strong>RV</strong>-8A.<br />
<strong>CAFE</strong> <strong>Foundation</strong>, Inc., Comparative Aircraft Flight Efficiency, a nonprofit,<br />
tax-exempt, all-volunteer, educational organization.<br />
<strong>CAFE</strong> Flight Test Facility, Charles M. Schulz Sonoma County Airport<br />
Santa Rosa California. 707-545-2233<br />
email: <strong>CAFE</strong>400@sonic.net<br />
website: cafefoundation.org<br />
Founded in 1982<br />
1<br />
PRESIDENT<br />
Brien Seeley<br />
VICE PRESIDENT<br />
Larry Ford<br />
TREASURER<br />
Johanna Dempsey<br />
DIRECTORS<br />
Stephen Williams<br />
Ed Vetter<br />
Jack Norris<br />
Scott Nevin<br />
Bill Bourns<br />
Darrel Harris
Elaborate <strong>CAFE</strong> flight test gear<br />
sits atop N129<strong>RV</strong>’s glare shield.<br />
If a mid-time Lycoming engine,<br />
wood prop and day VFR basic<br />
equipment were used and all of<br />
the construction were performed<br />
by the builder, the cost could be<br />
as low as $37,500. Equally shared<br />
by 4 members of a homebuilder<br />
flying/building club, the cost of an<br />
<strong>RV</strong>-<strong>9A</strong> thus becomes just $16,250,<br />
or $9,375 for the examples just<br />
mentioned, respectively. Such a<br />
partnership would offer very affordable<br />
access to such a versatile<br />
cross-country flying machine. It<br />
would also reduce the member’s<br />
burden of insurance, parking, taxes,<br />
hangaring, upgrades, etc.<br />
Another of Van’s design priorities<br />
for the <strong>RV</strong>-9/<strong>9A</strong> was that it<br />
be suitable for inexperienced pilots.<br />
Thus, it uses a longer-throw<br />
control stick that has higher stick<br />
forces than the other <strong>RV</strong>’s.<br />
With 123.67 square feet of<br />
wing area and 28 foot wingspan,<br />
the <strong>RV</strong>-<strong>9A</strong> has an aspect ratio of<br />
6.34 versus 4.8 for the <strong>RV</strong>4/<strong>RV</strong>-6.<br />
The <strong>RV</strong>-<strong>9A</strong> also has 12% more wing<br />
area than the <strong>RV</strong>4/6 series. These<br />
features, along with a high lift airfoil<br />
designed by renowned wing<br />
designer, John Roncz, enable the<br />
<strong>RV</strong>-<strong>9A</strong> to climb and cruise almost<br />
as well on 160 BHP as do the <strong>RV</strong>4/6<br />
using 180-200 BHP.<br />
The fuselage structure of the<br />
<strong>RV</strong>-<strong>9A</strong> is like the <strong>RV</strong>-7/7A except at<br />
the wing attach points. The <strong>RV</strong>-<strong>9A</strong><br />
also uses a constant-chord horizontal<br />
tail and larger vertical tail<br />
surfaces than other <strong>RV</strong>’s.<br />
N129<strong>RV</strong> has the late-style tunashaped<br />
wheel pants like those popularized<br />
by John Sharp’s renowned<br />
Formula One racer, Nemesis. Its<br />
long span slotted flaps are claimed<br />
to reduce its stall speed by 7 mph<br />
compared to the other <strong>RV</strong> designs.<br />
The construction of the <strong>RV</strong>-9/<br />
<strong>9A</strong>, like all others in the <strong>RV</strong> series,<br />
is by stressed aluminum skin with<br />
riveted structural components. A<br />
QuickBuild option with pre-riveted<br />
components and matched-hole<br />
pre-drilled skins is claimed to save<br />
35-40% of the building time while<br />
providing quality-built, pre-inspected<br />
assemblies that are assembled<br />
in either the Phillipines or in<br />
the Czech Republic by experienced<br />
metal workers.<br />
Detailed information is available<br />
on Van’s excellent website;<br />
vansaircraft.com. Complete technical<br />
results for the <strong>RV</strong>-<strong>9A</strong> are available<br />
at cafefoundation.org.<br />
The <strong>CAFE</strong> <strong>Foundation</strong> wishes<br />
to extend a special thanks to Ken<br />
Krueger, engineer with Van’s Aircraft,<br />
who delivered N129<strong>RV</strong> from<br />
Van’s factory in Oregon to the<br />
<strong>CAFE</strong> <strong>Foundation</strong> flight test center.<br />
Ken briefed <strong>CAFE</strong> test pilot, C.J.<br />
Stephens, for his first flight in the<br />
aircraft and was very helpful to the<br />
<strong>CAFE</strong> flight test team in the installation<br />
of the flight test instrumentation<br />
used in this report.<br />
Subjective<br />
Evaluation<br />
<strong>RV</strong>-<strong>9A</strong> N129<strong>RV</strong><br />
by<br />
C.J. Stephens<br />
The <strong>RV</strong>-<strong>9A</strong> is light in weight<br />
and one person can easily move<br />
it around on the ramp. Its turning<br />
radius is small enough that we<br />
could easily turn it around inside<br />
the 50 foot <strong>CAFE</strong> hangar.<br />
COCKPIT FEATURES<br />
The cockpit is uncluttered<br />
and roomy. This pilot, who is<br />
5’10” used a 1” seat pad to get<br />
the proper sitting height. Even<br />
so, there is plenty of headroom<br />
in the <strong>RV</strong>-<strong>9A</strong>. Although it gives<br />
good leverage, the control stick<br />
is longer than I like and makes<br />
the control movements seem<br />
exaggerated.<br />
The bubble canopy, which rolls<br />
back along rails, allows easy entry<br />
for both pilot and passenger.. The<br />
canopy latching system is easy to<br />
understand and leaves no doubt<br />
as to its security. A single latch<br />
with a solidly positive mechanism<br />
rotates to lock the canopy.. It can<br />
be opened during taxi to improve<br />
ventilation.<br />
The ample baggage compartment,<br />
located just behind the seats, is<br />
accessed through the cockpit.<br />
The cockpit layout is very<br />
efficient. All primary controls<br />
2
<strong>CAFE</strong> MEASURED PERFORMANCE, N129<strong>RV</strong><br />
Vmax, TAS, 8509.7 ‘ dens.alt., 1703 lb, 23.7”, 2605 RPM, 9.7 gph 192.7 mph<br />
Stall speed, CAS, 1758 lb, 12” M.P., 1800 RPM, full flaps, mph 49.08 mph<br />
Max climb rate, 5500’ dens.alt., 1732 lb, 26”, 2703 RPM, 10.8 gph 1348.9 fpm<br />
T.O. distance, 1731’ dens.alt., 1747.9 lb, 5 kt. wind, T 23° DP 12° 385 feet<br />
Vy, speed for best climb rate, CAS, 5500’ dens.alt, @103 mph TAS 95 mph<br />
Vx, speed for best climb angle, CAS, 5500’ dens., @88.3 mph TAS 81.6 mph<br />
Liftoff speed, CAS, (panel IAS= 74), 1300’ dens., full flaps, 1744 lb 66.0 mph<br />
Touchdown speed, CAS, (panel IAS= 68), 1520’ dens., 1715.8 lb 59.1 mph<br />
Min. sink rate, idle power, coarse pitch, 1725 lb, 81.7 mph TAS 664.2 fpm<br />
Best glide ratio, idle power, coarse pitch, 1738 lb, 95 mph CAS 12 to 1<br />
Noise levels, gliding at idle power/max climb/high cruise, dB 82/99/100<br />
Peak oil temp. in climb, 10,500’ dens., 95 mph CAS, OAT 62° F 228° F<br />
Max. cowl exit air temp., 60 mph CAS, full flaps, 2000 RPM, 15” 168° F<br />
Empty weight per <strong>CAFE</strong> Scales, including headsets and oil<br />
1078.05 lb<br />
are easy to reach and operate.<br />
Starting the Lycoming engine<br />
is straight-forward. On every<br />
attempt it starts flawlessly.<br />
GROUND OPERATIONS<br />
Taxiing is easy using differential<br />
braking for directional steering.<br />
The plane tracks straight on the<br />
taxiway. Very slight power is<br />
needed to attain taxi speed, yet at<br />
idle throttle, the plane does slow<br />
down.<br />
Field of view for ground<br />
maneuvering is excellent in all<br />
directions.<br />
The cabin ventilation is<br />
plentiful with two “eyeball”<br />
vents on the panel. Even at taxi<br />
speeds, there is adequate cooling<br />
air from these vents. There are no<br />
vents directed at the windshield<br />
and, I would suspect that in<br />
a very humid environment,<br />
condensation would accumulate,<br />
restricting the visibility.<br />
The <strong>RV</strong>-<strong>9A</strong> has a very nice<br />
electric elevator trim system. A<br />
green LED light on the panel<br />
indicates trim position and is<br />
used to set trim prior to takeoff.<br />
There is a switch to operate<br />
the electric flaps from both the<br />
top of the control stick and<br />
on the instrument panel. This<br />
redundancy adds both a failure<br />
point and undesirable cockpit<br />
complexity.<br />
TAKEOFF<br />
I consistently used 15 degrees<br />
of flap for takeoff with good<br />
results. This particular airplane<br />
has the manifold pressure gauge<br />
positioned above the propeller<br />
control and the RPM gauge above<br />
the throttle, and it is difficult<br />
to get used to this illogical<br />
arrangement.<br />
Even at maximum weight on<br />
a nearly standard day in light<br />
wind, the minimum run (flaps<br />
15 degrees) takeoff roll with 15°<br />
of flap measures only 385 feet.<br />
Directional control during takeoff<br />
is very easy to maintain. Lift off is<br />
at 75 mph panel IAS and climbing<br />
at 110 mph panel IAS gives 1600<br />
fpm on the VSI. Stick forces on<br />
rotation, with the c.g. at 13% aft<br />
of the forward limit, are light yet<br />
comfortable.<br />
FLYING QUALITIES<br />
Field of view during climb is<br />
excellent in all directions. The<br />
initial feel of the controls is light<br />
and brisk. The controls are very<br />
responsive and well balanced<br />
in all axes. On a day with the<br />
OAT measuring 76° F at a panel<br />
altitude of 4000 feet, a maximum<br />
performance climb produces a<br />
peak CHT of 462° F on cyl. #3.<br />
The spiral stability is neutral,<br />
i.e., once established in a shallow<br />
bank it does not tend to overturn<br />
or level out. This is true both<br />
with and without flaps and at<br />
both 1.3Vs and Va. Dynamic<br />
longitudinal stability is sampled<br />
at several airspeeds to determine<br />
the natural damping qualities<br />
of the <strong>RV</strong>-<strong>9A</strong>. It is essentially<br />
deadbeat at all speeds with both<br />
stick free and stick fixed. In stick<br />
fixed mode the elevators can<br />
add to the pitch dampening,<br />
producing a different amount of<br />
natural stability.<br />
With the use of a hand-held<br />
stick force gauge, I measure the<br />
amount of stick force necessary<br />
to change the airspeed in 10<br />
mph increments both above and<br />
below a given trimmed airspeed,<br />
i.e., static longitudinal stability.<br />
The measurements are taken after<br />
the airplane is well trimmed in<br />
level flight at the given airspeed.<br />
The plane is not re-trimmed<br />
throughout the measurements.<br />
The resulting measurements<br />
indicate the natural propensity<br />
of the airplane to return to its<br />
trimmed airspeed--the higher<br />
the forces, the greater the<br />
longitudinal stability.<br />
Roll due to yaw is explored by<br />
establishing a 15 degree bank,<br />
and then, with no aileron input,<br />
determining if the rudder alone<br />
can level the wings. The <strong>RV</strong>-<strong>9A</strong><br />
rudder gives a very prompt and<br />
favorable response. It provides<br />
accurate control to about 30<br />
degrees of bank in either direction<br />
3
Cowl bluff body<br />
for carb inlet also<br />
serves as cooling<br />
and exhaust exits.<br />
with no aileron input.<br />
Adverse yaw is examined by roll inputs using aileron only at<br />
1.3Vs. Initial adverse heading displacement is nearly zero. Such<br />
very mild adverse yaw contributes to the <strong>RV</strong>-<strong>9A</strong>’s pleasant flying<br />
qualities during flight at slow airspeed.<br />
Lazy-eights are accomplished with a pleasing sense of<br />
smoothly blended control forces throughout each maneuver at<br />
all airspeeds.<br />
An interesting characteristic occurs when making rapid and<br />
full aileron inputs. There is a definite, momentary kick-back on<br />
the control stick. I believe this occurs when the aileron exceeds<br />
its maximum angle of attack and induces a temporary stall of<br />
the aileron. It is brief and the airplane responds properly to<br />
the commanded input. However its effect on the controls is<br />
noticeable.<br />
Maneuvering stability is investigated using the stick force<br />
gauge to determine the force required to generate more G force.<br />
The graph shows the results for the <strong>RV</strong>-<strong>9A</strong>. The <strong>RV</strong>-<strong>9A</strong> required<br />
substantial increases in stick force to generate more G’s. This<br />
helps the pilot avoid excessive G’s during any pull-up maneuver<br />
and adds to the airplane’s overall safety and stability.<br />
STALL CHARACTERISTICS<br />
Cowling attaches with several<br />
piano hinge pins.<br />
Stall characteristics are examined with and without flaps<br />
at both 15% and 85% aft c.g. locations. All stalls exhibit a<br />
mild break with the wings remaining level throughout the<br />
entire recovery. The only buffet occurs 2 mph above the<br />
stall. The nose drops promptly upon stall at all c.g. positions<br />
tested. Recovery is instantaneous in all cases once the stick<br />
is repositioned. Control of the angle of attack is positive<br />
throughout the recovery. 100’-150’ is a typical altitude loss for<br />
full recovery.<br />
During the flight with the c.g. @ 85% aft of the forward limit<br />
the already light controls become even lighter. On takeoff very<br />
little aft stick force is required to raise the nose to the proper<br />
attitude. Particular attention is likely to be necessary whenever<br />
the airplane’s c.g. is toward its aft limit.<br />
DESCENT AND LANDING<br />
Van’s engineer Ken Krueger<br />
helped prepare the aircraft.<br />
During descent, the field of view is excellent and, with its<br />
easy maneuverability, dropping a wing helps improve the view.<br />
The plane accelerates quickly when descending, requiring a<br />
little planning for approach. At 80 mph panel IAS the final<br />
approach is very easy to control. Even as the speed bleeds down<br />
to around 70 mph in the flare with the power at idle, there is<br />
no difficulty in gently settling the tires on the pavement at<br />
touch down.<br />
I believe that, in a crash landing situation, the <strong>RV</strong>-<strong>9A</strong> aircraft<br />
occupants would have a very good likelihood of survival due<br />
to its having a slow landing speed, fuel contained solely in the<br />
wings, and an engine located forward of the occupants. In an<br />
off-runway landing, if the airplane flipped upside-down, the<br />
sliding canopy may offer an advantage in egress from the cockpit<br />
compared to designs with hinged canopies.<br />
4
CONCLUSION<br />
I find the <strong>RV</strong>-<strong>9A</strong> to be a simple,<br />
straightforward airplane. It is very<br />
responsive, making it a joy to fly,<br />
yet with its good stability, even a<br />
low-time aviator could manage it.<br />
It is the kind of plane in which a<br />
pilot and a full-sized friend can<br />
take a normal amount of baggage<br />
and travel a good distance<br />
at 185 mph. Its minimum runway<br />
requirement does not limit<br />
the places chosen as destination.<br />
It also seems well suited for local<br />
flying with the ‘fun factor’ set on<br />
high.<br />
STICK FORCE GRAPHS:<br />
Stick forces are shown on the vertical<br />
axis of the two adjacent graphs,<br />
“Static longitudinal stability” and<br />
“Maneuvering stability at Va”. It is<br />
the slope of the various colored lines<br />
on the two graphs that indicate how<br />
much pull or push on the stick is<br />
needed to command the aircraft to<br />
change its speed or G force. A steep<br />
vertical slope means that the aircraft’s<br />
control stick stiffly resists change,<br />
while a flatter slope means that speed<br />
or G force can be changed with little<br />
effort by the pilot. Steeper slopes thus<br />
indicate more stability. For safety,<br />
“pulling G’s” should take a lot of effort.<br />
Note: For any aircraft, the slopes<br />
generally will flatten as the c.g. moves<br />
aft. Indeed, the aft c.g. limit is usually<br />
determined as the point at which the<br />
stick force slope becomes so flat that<br />
the aircraft becomes unstable.<br />
Pull<br />
(-)<br />
Elevator Stick Force, lbs.<br />
-6<br />
-4<br />
-2<br />
0<br />
2<br />
4<br />
6<br />
8<br />
10<br />
Push<br />
(+) 12<br />
60<br />
Ο<br />
∇<br />
◊<br />
G<br />
Ο<br />
◊<br />
◊<br />
◊<br />
+ Ο ◊<br />
Ο<br />
◊<br />
+<br />
Ο ◊<br />
∇∇∇<br />
+<br />
G ∇ Ο ◊<br />
G ∇+<br />
G ∇Ο<br />
G G G ◊<br />
∇ G G G<br />
Ο<br />
+ ∇ ◊<br />
Ο ∇<br />
+<br />
◊<br />
Ο<br />
∇<br />
80<br />
100<br />
<strong>RV</strong>-<strong>9A</strong>, fwd c.g.,<br />
110 mph<br />
<strong>RV</strong>-<strong>9A</strong>, aft c.g., 110<br />
mph<br />
<strong>RV</strong>-8A, fwd c.g.,<br />
140 mph<br />
Wittman W10 @<br />
18% MAC<br />
+ Cessna 152<br />
120<br />
140<br />
∇ ◊<br />
Ο<br />
Ο<br />
160<br />
G G<br />
◊<br />
180<br />
Instrument panel IAS, mph<br />
Static longitudinal stability<br />
Trimmed to zero pounds, stick- free,<br />
flaps up, near V a<br />
.<br />
(For <strong>RV</strong>-<strong>9A</strong>, 110 mph IAS = 101 CAS)<br />
◊<br />
200<br />
Elevator Stick Force, lbs.<br />
30<br />
25<br />
20<br />
15<br />
10<br />
5<br />
Ο<br />
∆<br />
∇<br />
1<br />
∆<br />
Ο<br />
<strong>RV</strong>-<strong>9A</strong> @13% aft,<br />
109.4 mph CAS<br />
<strong>RV</strong>-8A, fwd c.g., 140<br />
mph IAS<br />
W10 Tailwind @<br />
18% MAC<br />
1 Cessna 152<br />
1<br />
∆<br />
Ο<br />
∇<br />
1<br />
∆<br />
Ο<br />
∆<br />
Ο<br />
∇<br />
Ο<br />
The <strong>RV</strong>-<strong>9A</strong> being weighed before flight<br />
on the <strong>CAFE</strong> Scales.<br />
5<br />
0 1Ο<br />
∇∆<br />
1 1.5 2 2.5 3 3.5<br />
Load in G's<br />
Maneuvering stability<br />
at Va.
Exhaust gas temperature (EGT), °F<br />
<strong>RV</strong>-<strong>9A</strong>: True Airspeed (TAS), EGT and CHT @ 8500', 2600 RPM<br />
1650<br />
1600<br />
1550<br />
1500<br />
1450<br />
1400<br />
1350<br />
⊕<br />
â<br />
Ö<br />
A<br />
⊕<br />
â<br />
Ö<br />
A<br />
⊕<br />
â<br />
Ö<br />
A<br />
⊕<br />
⊕<br />
â â<br />
⊕<br />
AAA â<br />
Ö<br />
Ö<br />
5.5 6 6.5 7 7.5 8 8.5 9 9.5 10 10.5<br />
Fuel flow, gallons per hour (gph)<br />
EGT #1<br />
EGT #2<br />
= 179.6 smph @ 6.1 gph<br />
EGT #3<br />
⊕ EGT #4<br />
CHT #1<br />
CHT #2<br />
CHT #3<br />
CHT #4<br />
A<br />
â<br />
Ö<br />
Ö<br />
TAS<br />
MPG x10<br />
400<br />
380<br />
360<br />
340<br />
330<br />
320<br />
310<br />
300<br />
290<br />
280<br />
270<br />
260<br />
250<br />
240<br />
230<br />
220<br />
210<br />
200<br />
190<br />
180<br />
175<br />
<strong>CAFE</strong> Score<br />
(Score = V 1.3 xMPG)<br />
<strong>RV</strong>-<strong>9A</strong> N129<strong>RV</strong>: wide open throttle, <strong>CAFE</strong> data 8/18/02. CHT for 100°F day.<br />
Lycoming O-320-D3G engine, 160 BHP. V bC<br />
= velocity for best <strong>CAFE</strong> Score.<br />
Cylinder head temperature (CHT), °F<br />
MPG x10, TAS, or <strong>CAFE</strong> Score<br />
HOW TO READ THIS GRAPH<br />
This graph summarizes the cruise<br />
performance of the aircraft in terms<br />
of TAS, EGT, CHT, <strong>CAFE</strong> score and MPG<br />
relative to its fuel flow.<br />
The top family of four curves show<br />
the CHT (top right vertical axis) for<br />
each engine cylinder versus fuel flow<br />
(shown on the bottom horizontal axis).<br />
Note that, at a given fuel flow, the different<br />
cylinders have very different<br />
CHT’s, reflecting uneven mixture distribution,<br />
a feature common to carburetted<br />
engines.<br />
Below the family of CHT curves are<br />
the four EGT curves, with temperatures<br />
shown on the left vertical axis. Peak<br />
EGT occurs at 7.5 gph of fuel flow. The<br />
spread in EGT from cylinder to cylinder<br />
again reflects uneven mixture distribution.<br />
The peak CHT tends to occur at<br />
about 100° F rich of peak EGT (at 9.0<br />
gph) and CHT cools off at mixtures lean<br />
of peak EGT.<br />
Below the four EGT curves, are the<br />
MPG and <strong>CAFE</strong> score, each rising almost<br />
linearly as the fuel flow is leaned.<br />
MPG peaks at about 30 MPG (bottom<br />
right vertical axis). V bC<br />
, velocity for<br />
best <strong>CAFE</strong> score, is 179.6 mph at 6.1<br />
gph.<br />
True airspeed (TAS), the bottom<br />
curve, is shown to be highest at the<br />
higher fuel flows with rich of peak<br />
(ROP) EGT mixtures, but TAS falls only<br />
slightly at lean mixture settings.<br />
Darrel Harris, below left, and Test Pilot C.J.<br />
Stephens both devoted major efforts to assure<br />
that the <strong>RV</strong>-<strong>9A</strong> flight tests were complete. See<br />
cafefoundation.org for added details.<br />
<strong>CAFE</strong>’s pitot/static missile<br />
self-aligns with airstream.<br />
<strong>CAFE</strong><br />
HONORARY ALUMNI<br />
Steve Barnard--<strong>RV</strong>-6A<br />
Jim Clement--Wittman Tailwind<br />
Jim Lewis--Mustang II<br />
Ken Brock--Thorp T-18<br />
Larry Black--Falco F.8L<br />
Chuck Hautamaki--Glasair III<br />
Jeff Ackland--Legend<br />
Jerry Sjostrand--Express<br />
Randy Schlitter--RANS S-7C<br />
Stoddard Hamilton Aircraft, Inc.--GlaStar<br />
Fred Baron--Lancair 320<br />
Mark Beduhn--Cozy Mark IV<br />
Dick VanGrunsven--<strong>RV</strong>-8A, <strong>RV</strong>-<strong>9A</strong><br />
Derek Hine--Lancair IVP<br />
Kim Prout--Europa<br />
Neal Roach--Glasair Super IIS FT<br />
IMPORTANT NOTICE<br />
Every effort has been made to obtain the<br />
most accurate information possible. The<br />
data are presented as measured and are<br />
subject to errors from a variety of sources.<br />
Any reproduction, sale, republication, or<br />
other use of the whole or any part of this<br />
report without the consent of the <strong>CAFE</strong><br />
<strong>Foundation</strong> is strictly prohibited.<br />
ACKNOWLEDGEMENTS<br />
The <strong>CAFE</strong> <strong>Foundation</strong> gratefully<br />
acknowledges the assistance of Van’s<br />
Aircraft, Anne Seeley, pilot Jim Reinemer,<br />
Ray Richter, EAA Chapter 124, and the<br />
Sonoma County Airport FAA Control<br />
Tower Staff.<br />
SPONSORS<br />
Engineered Software “PowerCadd”<br />
and WildTools<br />
FAA William J. Hughes<br />
Technical Center<br />
DreeseCode Software<br />
at ww.dreesecode.com<br />
6
Exhaust gas temperature (EGT), °F<br />
<strong>RV</strong>-<strong>9A</strong>: True Airspeed (TAS), EGT and CHT @ 8500', 2300 RPM<br />
1600<br />
400<br />
1550<br />
1500<br />
1450<br />
1400<br />
1350<br />
1300<br />
1250<br />
⊕<br />
â<br />
Ö<br />
A<br />
⊕<br />
â<br />
Ö<br />
A<br />
180<br />
175<br />
6.5 6.7 6.9 7.1 7.3 7.5 7.7 7.9 8.1 8.3 8.5<br />
Fuel flow, gallons per hour (gph)<br />
EGT #1<br />
EGT #2<br />
EGT #3<br />
⊕ EGT #4<br />
⊕<br />
â<br />
Ö<br />
= 182.9 smph @ 6.7 gph<br />
A<br />
⊕<br />
â<br />
Ö<br />
A<br />
CHT #1<br />
CHT #2<br />
CHT #3<br />
CHT #4<br />
A<br />
â<br />
Ö<br />
⊕<br />
â<br />
Ö<br />
A<br />
380<br />
360<br />
340<br />
320<br />
300<br />
280<br />
270<br />
260<br />
250<br />
240<br />
230<br />
220<br />
210<br />
200<br />
190<br />
TAS, smph<br />
MPG x10<br />
<strong>CAFE</strong> Score<br />
(Score = V 1.3 xMPG)<br />
<strong>RV</strong>-<strong>9A</strong> N129<strong>RV</strong>; wide open throttle, <strong>CAFE</strong> data 8/18/02. CHT for 100 °F day.<br />
Lycoming O-320-D3G engine, 160 BHP. V bC<br />
= velocity for best <strong>CAFE</strong> Score.<br />
Cylinder head temperature (CHT), °F<br />
MPG x10, TAS, or <strong>CAFE</strong> Score<br />
HOW TO READ THIS GRAPH<br />
This graph summarizes the cruise<br />
performance of the aircraft in terms<br />
of TAS, EGT, CHT, <strong>CAFE</strong> score and MPG<br />
relative to its fuel flow.<br />
The top family of four curves show<br />
the CHT (top right vertical axis) for<br />
each engine cylinder versus fuel flow<br />
(shown on the bottom horizontal axis).<br />
Note that, at a given fuel flow, the different<br />
cylinders have very different<br />
CHT’s, reflecting uneven mixture distribution,<br />
a feature common to carburetted<br />
engines.<br />
Below the family of CHT curves are<br />
the four EGT curves, with temperatures<br />
shown on the left vertical axis. Peak<br />
EGT occurs at or below 6.7 gph of fuel<br />
flow. The spread in EGT from cylinder<br />
to cylinder again reflects uneven mixture<br />
distribution.<br />
The peak CHT normally occurs at<br />
about 100° F rich of peak EGT and cools<br />
off at mixtures lean of peak EGT.<br />
Below the four EGT curves, are the<br />
MPG and <strong>CAFE</strong> score, each rising almost<br />
linearly as the fuel flow is leaned.<br />
MPG peaks at about 27 MPG (bottom<br />
right vertical axis). V bC<br />
, velocity for<br />
best <strong>CAFE</strong> score, is 182.9 mph at 6.7<br />
gph.<br />
True airspeed (TAS), the bottom<br />
curve, is shown to be highest at the<br />
higher fuel flows with rich of peak<br />
(ROP) EGT mixtures, but TAS falls only<br />
very slightly at lean mixture settings.<br />
<strong>RV</strong>-<strong>9A</strong> N129<strong>RV</strong>, Sample c.g.<br />
Sample center of gravity<br />
Main gear, empty<br />
Nosewheel, empty<br />
Pilot<br />
Passenger<br />
Fuel, 35.4 gallons, full<br />
Oil, included 6.25 qt.<br />
Baggage, 100 lb. limit<br />
TOTALS<br />
Datum = 70" fwd of L.E.<br />
Weight, lb<br />
806.8<br />
271.3<br />
170.0<br />
190.0<br />
212.4<br />
0.0<br />
100.0<br />
1750.5<br />
Arm*<br />
91.94<br />
34.50<br />
94.08<br />
94.08<br />
76.71<br />
0.00<br />
123.51<br />
Moment<br />
74177<br />
9358<br />
15994<br />
17875<br />
16293<br />
0<br />
12351<br />
146048<br />
c.g. this sample:<br />
c.g. range, inches<br />
c.g. range, % MAC<br />
c.g., % aft of fwd limit<br />
Gross weight, lb<br />
Empty weight, lb<br />
Useful load, lb<br />
Payload, lb, full fuel<br />
Fuel capacity, gallons*<br />
Fuel capacity, pounds*<br />
Empty weight c.g., inches<br />
c.g. range<br />
Main gear track<br />
Wheelbase<br />
83.4<br />
6.89<br />
15%-28%<br />
20%<br />
1750.0<br />
1078.1<br />
672.0<br />
459.6<br />
35.4<br />
212.40<br />
77.49<br />
77.95-84.84<br />
84.0<br />
57.4<br />
*as determined by <strong>CAFE</strong><br />
7<br />
c.g.<br />
83.43<br />
Panel IAS,<br />
smph<br />
60.0<br />
63.0<br />
65.0<br />
70.0<br />
75.0<br />
80.0<br />
85.0<br />
90.0<br />
95.0<br />
100.0<br />
105.0<br />
115.0<br />
120.0<br />
125.0<br />
130.0<br />
135.0<br />
140.0<br />
145.0<br />
150.0<br />
155.0<br />
160.0<br />
165.0<br />
170.0<br />
175.0<br />
180.0<br />
185.0<br />
190.0<br />
195.0<br />
200.0<br />
CAS<br />
(Baro #3)<br />
61.4<br />
66.2<br />
71.4<br />
76.3<br />
80.5<br />
87.0<br />
91.6<br />
96.1<br />
105.5<br />
109.4<br />
113.1<br />
118.3<br />
122.3<br />
129.0<br />
136.4<br />
142.4<br />
147.5<br />
154.4<br />
160.7<br />
164.9<br />
169.3<br />
174.6<br />
175.2<br />
183.2<br />
189.1<br />
192.5<br />
<strong>RV</strong>-<strong>9A</strong> N129<strong>RV</strong>: Speed Calibration<br />
Total<br />
error<br />
8.6<br />
8.8<br />
8.6<br />
8.7<br />
9.5<br />
8.0<br />
8.4<br />
8.9<br />
9.5<br />
10.6<br />
11.9<br />
11.7<br />
12.7<br />
11.0<br />
8.6<br />
7.6<br />
7.5<br />
5.6<br />
4.3<br />
5.1<br />
5.7<br />
5.4<br />
9.8<br />
6.8<br />
5.9<br />
7.5<br />
Cabin<br />
Baro.stock<br />
pitot<br />
49.5<br />
52.0<br />
54.9<br />
61.7<br />
68.7<br />
73.2<br />
78.0<br />
82.9<br />
89.2<br />
94.1<br />
99.1<br />
108.7<br />
113.2<br />
117.1<br />
122.3<br />
126.4<br />
133.6<br />
141.3<br />
147.5<br />
152.5<br />
159.5<br />
166.1<br />
170.4<br />
175.3<br />
180.7<br />
181.4<br />
189.8<br />
196.3<br />
199.7<br />
Pitot-static<br />
error<br />
na<br />
na<br />
na<br />
0.3<br />
2.5<br />
1.8<br />
1.7<br />
2.4<br />
2.2<br />
2.5<br />
3.0<br />
3.2<br />
3.8<br />
4.0<br />
4.0<br />
4.1<br />
4.6<br />
4.9<br />
5.1<br />
5.0<br />
5.1<br />
5.4<br />
5.5<br />
6.0<br />
6.1<br />
6.2<br />
6.6<br />
7.2<br />
7.2<br />
Instrument<br />
error<br />
8.3<br />
6.3<br />
6.8<br />
7.0<br />
7.1<br />
5.8<br />
5.9<br />
5.9<br />
6.4<br />
6.8<br />
8.0<br />
7.7<br />
8.6<br />
6.4<br />
3.7<br />
2.5<br />
2.5<br />
0.5<br />
-1.1<br />
-0.4<br />
-0.3<br />
-0.7<br />
3.7<br />
0.2<br />
-1.3<br />
0.3<br />
Config.<br />
Flaps down<br />
Flaps down<br />
Flaps down<br />
Flaps up<br />
" " "<br />
" " "<br />
" " "<br />
" " "<br />
" " "<br />
" " "<br />
" " "<br />
" " "<br />
" " "<br />
" " "<br />
" " "<br />
" " "<br />
" " "<br />
" " "<br />
" " "<br />
" " "<br />
" " "<br />
" " "<br />
" " "<br />
" " "<br />
" " "<br />
" " "<br />
" " "<br />
" " "<br />
" " "<br />
Pitot-static and Instrument errors are here determined by comparing CAS from the <strong>CAFE</strong> Barograph's<br />
gimbled pitot-static missile to the aircraft's instrument panel ASI and to a separate <strong>CAFE</strong> Barograph in the<br />
Cabin that shares the aircraft's stock pitot-static ports with the panel ASI.
Exhaust gas temperature (EGT), °F<br />
<strong>RV</strong>-<strong>9A</strong>: True Airspeed (TAS) EGT and CHT @ 12,500', 2600 RPM<br />
1650<br />
1600<br />
1550<br />
1500<br />
1450<br />
1400<br />
1350<br />
1300<br />
1250<br />
⊕<br />
â<br />
Ö<br />
A<br />
⊕<br />
â<br />
Ö<br />
A<br />
1200<br />
175<br />
5.5 6 6.5 7 7.5 8 8.5 9<br />
Fuel flow, gallons per hour (gph)<br />
EGT #1<br />
EGT #2<br />
EGT #3<br />
⊕ EGT #4<br />
⊕<br />
â<br />
Ö<br />
A<br />
⊕<br />
â<br />
Ö<br />
= 177.2 smph @ 5.9 gph<br />
A<br />
CHT #1<br />
CHT #2<br />
CHT #3<br />
CHT #4<br />
⊕<br />
â<br />
Ö<br />
A<br />
⊕<br />
â<br />
Ö<br />
A<br />
A<br />
â<br />
Ö<br />
⊕<br />
â<br />
Ö<br />
A<br />
TAS<br />
MPG x10<br />
400<br />
380<br />
360<br />
340<br />
320<br />
300<br />
280<br />
260<br />
240<br />
220<br />
200<br />
190<br />
180<br />
<strong>CAFE</strong> Score<br />
(Score = V 1.3 xMPG)<br />
<strong>RV</strong>-<strong>9A</strong> N129<strong>RV</strong>; wide open throttle, <strong>CAFE</strong> data 8/18/02. CHT for 100 °F day. Lyc.<br />
O-320-D3G engine, 160 BHP. V bC<br />
= velocity for best <strong>CAFE</strong> Score.<br />
Cylinder head temperature (CHT), °F<br />
MPG x10, TAS or <strong>CAFE</strong> Score<br />
HOW TO READ THIS GRAPH<br />
This graph summarizes the cruise<br />
performance of the aircraft in terms<br />
of TAS, EGT, CHT, <strong>CAFE</strong> score and MPG<br />
relative to its fuel flow.<br />
The top family of four curves show<br />
the CHT (top right vertical axis) for<br />
each engine cylinder versus fuel flow<br />
(shown on the bottom horizontal axis).<br />
Note that, at a given fuel flow, the different<br />
cylinders have very different<br />
CHT’s, reflecting uneven mixture distribution,<br />
a feature common to carburetted<br />
engines.<br />
Below the family of CHT curves are<br />
the four EGT curves, with temperatures<br />
shown on the left vertical axis. Peak<br />
EGT occurs at 6.3 gph of fuel flow. The<br />
spread in EGT from cylinder to cylinder<br />
again reflects uneven mixture distribution,<br />
though not bad at 6.0 gph.<br />
The peak CHT normally occurs at<br />
about 100° F rich of peak EGT and cools<br />
off at mixtures lean of peak EGT.<br />
Below the four EGT curves, are the<br />
MPG and <strong>CAFE</strong> score, each rising almost<br />
linearly as the fuel flow is leaned.<br />
MPG peaks at about 30 MPG (bottom<br />
right vertical axis). V bC<br />
, velocity for<br />
best <strong>CAFE</strong> score, is 177.2 mph at 5.9<br />
gph.<br />
True airspeed (TAS), the bottom<br />
curve, is shown to be highest at the<br />
higher fuel flows with rich of peak<br />
(ROP) EGT mixtures, but TAS falls only<br />
slightly at lean mixture settings.<br />
Co-pilot Bill Bourns operated the<br />
flight recorders on data flight #1.<br />
C.J. Stephens, on wing,<br />
preflights N129<strong>RV</strong>.<br />
Steve Williams installs<br />
the flight recorders.<br />
Miscellaneous notes:<br />
All flights except the 5th data flight were made by test pilot C.J. Stephens. The first two flights were subjective evaluations. The 1st Barograph data<br />
collection flight (3rd flight overall) was for calibrating the panel airspeed indicator and the pitot-static system and used both Cabin and Wing-mounted <strong>CAFE</strong><br />
Barographs. The 2nd data flight used the Wing-mounted <strong>CAFE</strong> Barograph to collect the Vmax and cruise data. The 3rd data flight used only the Cabin<br />
Barograph and collected climb and descent rate data, takeoff distance, liftoff and touchdown speeds. and The 4th data flight measured cooling system ram<br />
recovery by water manometer. The 5th data flight was performed by Jim Reinemer and was made to determined the full flaps stall speed without wing cuffs.<br />
8
Exhaust gas temperature (EGT), °F<br />
<strong>RV</strong>-<strong>9A</strong>: True Airspeed (TAS) EGT and CHT@ 12,500', 2300 RPM<br />
1600<br />
400<br />
1550<br />
1500<br />
1450<br />
1400<br />
1350<br />
1300<br />
1250<br />
1200<br />
1150<br />
1100<br />
⊕<br />
â<br />
Ö<br />
A<br />
⊕<br />
â<br />
Ö<br />
A<br />
⊕<br />
â<br />
Ö<br />
A<br />
6 6.5 7 7.5 8 8.5<br />
Fuel flow, gallons per hour (gph)<br />
EGT #1<br />
EGT #2<br />
EGT #3<br />
⊕ EGT #4<br />
⊕<br />
â<br />
= 182.7 smph @ 7.1 gph<br />
Ö<br />
A<br />
⊕<br />
â<br />
Ö<br />
A<br />
⊕<br />
â<br />
Ö<br />
A<br />
CHT #1<br />
CHT #2<br />
CHT #3<br />
CHT #4<br />
⊕<br />
â<br />
Ö<br />
A<br />
A<br />
â<br />
Ö<br />
TAS<br />
380<br />
360<br />
340<br />
320<br />
300<br />
280<br />
270<br />
260<br />
250<br />
240<br />
230<br />
220<br />
210<br />
200<br />
190<br />
180<br />
170<br />
MPG x10<br />
<strong>CAFE</strong> Score<br />
(Score = V 1.3 xMPG)<br />
<strong>RV</strong>-<strong>9A</strong> N129<strong>RV</strong>; wide open throttle, <strong>CAFE</strong> data 8/18/02. CHT for 100 °F day.<br />
Lyc. O-320-D3G engine, 160 BHP. V bC<br />
= velocity for best <strong>CAFE</strong> Score.<br />
Cylinder head temperature (CHT), °F<br />
MPG x10, TAS, or <strong>CAFE</strong> Score<br />
HOW TO READ THIS GRAPH<br />
This graph summarizes the cruise<br />
performance of the aircraft in terms<br />
of TAS, EGT, CHT, <strong>CAFE</strong> score and MPG<br />
relative to its fuel flow.<br />
The top family of four curves show<br />
the CHT (top right vertical axis) for<br />
each engine cylinder versus fuel flow<br />
(shown on the bottom horizontal axis).<br />
Note that, at a given fuel flow, the different<br />
cylinders have very different<br />
CHT’s, reflecting uneven mixture distribution,<br />
a feature common to carburetted<br />
engines.<br />
Below the family of CHT curves are<br />
the four EGT curves, with temperatures<br />
shown on the left vertical axis. Peak<br />
EGT occurs at 6.4 gph of fuel flow. The<br />
spread in EGT from cylinder to cylinder,<br />
though better than at 2600 RPM,<br />
again reflects uneven mixture distribution,.<br />
The peak CHT tends to occur rich<br />
of peak EGT (here at about 6.8 gph) and<br />
CHT tends to cool off at mixtures lean<br />
of peak EGT.<br />
Below the four EGT curves, are the<br />
MPG and <strong>CAFE</strong> score, each rising as<br />
the fuel flow is leaned. MPG peaks at<br />
about 27 MPG (bottom right vertical<br />
axis). V bC<br />
, velocity for best <strong>CAFE</strong> score,<br />
is 182.7 mph at 7.1 gph.<br />
True airspeed (TAS), the bottom<br />
curve, is shown to be highest at the<br />
rich of peak (ROP) EGT mixture of 7.15<br />
gph, but TAS and <strong>CAFE</strong> score fall only<br />
slightly at leaner mixture settings.<br />
Geometric Altitude, feet<br />
9<br />
3800<br />
3790<br />
3780<br />
3770<br />
3760<br />
3750<br />
3740<br />
3730<br />
3720<br />
3710<br />
3700<br />
3690<br />
3680<br />
3670<br />
3660<br />
3650<br />
3640<br />
3630<br />
<strong>RV</strong>-<strong>9A</strong>: Stall Profile, Full Flaps, Landing<br />
HOW TO READ THE<br />
STALL PROFILE GRAPH<br />
64.0 63.4 62.4<br />
B B B 60.9<br />
B 60.4 59.3 58.7<br />
B B B 57.5 55.8 54.6 52.9 51.6 50.8 This graph shows the<br />
B B B B B B 49.9<br />
B 49.1 altitude profile during both<br />
49.7 B<br />
deceleration to stall and<br />
1<br />
52.5 re-acceleration after stall.<br />
1<br />
Test pilot Jim Reinemer did<br />
56.0<br />
a commendable job of holding<br />
the altitude nearly level<br />
1<br />
58.8<br />
while approaching the stall<br />
1<br />
with close to the desired<br />
60.9<br />
1<br />
standard deceleration rate<br />
62.6<br />
1<br />
of 1 knot per second.<br />
64.0<br />
The aircraft only loses<br />
1<br />
65.8<br />
about 130 feet of altitude<br />
1<br />
in this power off recovery.<br />
16 14 12 10 8 6 4 2 0 It must be emphasized that<br />
Time, seconds<br />
B Pre-stall<br />
Each point's value is in smph, CAS. Altitude loss<br />
1 After stall<br />
shown to point of level recovery.
Elevator Stick Force, lbs.<br />
30<br />
25<br />
20<br />
15<br />
10<br />
Ο<br />
∆<br />
∇<br />
1<br />
<strong>RV</strong>-<strong>9A</strong> @13%<br />
aft, 109.4 mph<br />
CAS<br />
<strong>RV</strong>-<strong>9A</strong> @ 85%<br />
aft, 109.4 mph<br />
CAS<br />
<strong>RV</strong>-<strong>9A</strong> @13%<br />
aft, 71.4 mph<br />
CAS, full flaps<br />
<strong>RV</strong>-<strong>9A</strong> @ 85%<br />
aft, 71.4 mph<br />
CAS, full flaps<br />
∇<br />
Ο<br />
5<br />
Ο∇<br />
∆<br />
1∆<br />
1<br />
0 1Ο<br />
∇∆<br />
1 1.5 2 2.5 3 3.5<br />
Load in G's<br />
Maneuvering stability,<br />
flaps down.<br />
Ο<br />
∆<br />
Ο<br />
∆<br />
Ο<br />
∆<br />
Pull<br />
(-)<br />
Elevator Stick Force, lbs.<br />
-6<br />
-4<br />
-2<br />
0<br />
2<br />
4<br />
6<br />
8<br />
10<br />
Push<br />
(+) 12<br />
◊<br />
60<br />
Ο<br />
Ο<br />
∇<br />
◊<br />
Ο<br />
Ο<br />
∇∇∇<br />
Ο<br />
◊<br />
◊ ∇ Ο<br />
G<br />
G ∇<br />
G◊<br />
∇Ο<br />
G ∇<br />
G Ο<br />
∇<br />
◊ Ο ∇<br />
Ο<br />
∇<br />
80<br />
<strong>RV</strong>-<strong>9A</strong>, fwd c.g., 110<br />
mph<br />
<strong>RV</strong>-<strong>9A</strong>, aft c.g., 110<br />
mph<br />
<strong>RV</strong>-<strong>9A</strong>, fwd c.g., 80<br />
mph, full flaps<br />
G<br />
<strong>RV</strong>-<strong>9A</strong>, aft c.g., 80<br />
mph, full flaps<br />
100<br />
120<br />
140<br />
Ο<br />
∇<br />
Ο<br />
160<br />
Instrument panel IAS, mph<br />
Static longitudinal stability<br />
Trimmed to zero pounds, stick- free,<br />
flaps up, near V . a<br />
(Note: 110 IAS = 101 CAS and<br />
80 IAS = 71.4 CAS)<br />
FLIGHT TEST DETAILS<br />
All flights were made in day VFR conditions<br />
and with minimal level of turbulence.<br />
A FlowScan 201A fuel flow transducer<br />
was used for the gph determinations and<br />
was calibrated by accurately measuring<br />
the weight of fuel burned on each flight.<br />
The takeoff weight and c.g. were measured<br />
prior to each flight. By subtracting fuel<br />
burn from known takeoff weight, the<br />
instantaneous weight of the aircraft is<br />
tabulated throughout the flight.<br />
A PropTach digital tachometer was<br />
mounted on the top of the instrument<br />
panel and fed readings once per second to<br />
the flight data recorder. A Toshiba Toughbook<br />
laptop computer using CCT4C.c<br />
software was used to record the multichannel<br />
flight data.<br />
Flying qualities were evaluated using<br />
an analog G meter and a hand-held stick<br />
force gauge from Brooklyn Tool & Machine<br />
Co., Inc., N.J..<br />
Cowl exit temperature (CXT) is a function<br />
of both OAT and CHT and serves as<br />
a key number for calculating the cooling<br />
system performance. Our measurement<br />
of cooling ram recovery uses both total<br />
pressure and piccolo static tubes inside the<br />
high pressure plenum of the cowl. The<br />
pressures from those tubes are recorded<br />
using a water manometer and the results<br />
are compared to the calculated freestream<br />
ram pressure.<br />
The subjective evaluation flights were<br />
flown using the panel indicated airspeeds<br />
for V a<br />
, V x<br />
, V y<br />
, V f<br />
, and V ne<br />
that were suggested<br />
by the aircraft owner. <strong>CAFE</strong> subsequently<br />
measured V x<br />
and V y<br />
by glide,<br />
climb and ‘power required to maintain<br />
level flight’ techniques. The glide and<br />
climb tests utilized geometric altitude<br />
rather than pressure or density altitude in<br />
order to keep them cross comparable from<br />
aircraft to aircraft. An average density<br />
altitude of 5500’ for the climb segments<br />
meant that the rate of climb measured<br />
is well below that to be expected at sea<br />
level.<br />
The level cruise performance values<br />
for the aircraft were recorded by <strong>CAFE</strong><br />
Barograph #3, which, along with its pitot/<br />
static source, was calibrated to an accuracy<br />
of 0.1 mph in NASA’s wind tunnel. Cruise<br />
speeds are selected only from runs in<br />
stable, non-turbulent conditions that were<br />
found to show steady total energy values,<br />
calculated as the sum of the aircraft’s kinetic<br />
and potential energy.<br />
The sum of the kinetic and potential<br />
energy, under constant power, trimmed<br />
level flight conditions, should remain<br />
nearly constant. If that sum is increasing,<br />
then atmospheric lift is likely to be<br />
occuring and the data is unsuitable. If<br />
total energy is decreasing, then the aircraft<br />
is likely flying through sinking air, again<br />
unsuitable data for our purposes.<br />
All cruise speeds are corrected for the<br />
measured drag coefficient of the wing<br />
cuffs that attach the Barograph.<br />
10
<strong>RV</strong>-<strong>9A</strong> N129<strong>RV</strong><br />
Start time Seconds Presalt., ft. Geo alt. Gain, ft.<br />
w.o.t., 2703 RPM, 26.0", 10.8<br />
04:33: 60 3652 2467.8 1265.<br />
w.o.t., 2703 RPM, 26.0", 10.8<br />
04:42: 45 2709 2739.8 1011.<br />
w.o.t., 2703 RPM, 26.0", 10.8<br />
04:47: 48 2699 2715.1 1053.<br />
w.o.t., 2703 RPM, 26.0", 10.8<br />
04:54: 40 2687 2707.4 855.6<br />
w.o.t., 2703 RPM, 26.0", 10.8<br />
05:00: 49 2621 2623.9 1073.<br />
w.o.t., 2703 RPM, 26.0", 10.8<br />
04:18: 30 1098 1043.7 658.5<br />
20.1", 2703 RPM, 9.0 gph,<br />
01:58: 30 9520 10004. 384.8<br />
w.o.t. = wide open throttle<br />
Glides made during Data Flight #3: Start Second Presalt., Geo alt. Loss, ft.<br />
Coarse pitch, 1250 RPM, 5.2",<br />
04:30: 80 3696 3796.2 -<br />
Coarse pitch, 1250 RPM, 5.2",<br />
04:36: 113 4037 4157.5 -<br />
Coarse pitch, 1230 RPM, 5.2",<br />
04:44: 110 3958 4062.4 -<br />
Coarse pitch, 1200 RPM, 5.4",<br />
04:50: 130 4088 4192.1 -<br />
Coarse pitch, 1180 RPM, 5.8",<br />
04:57: 96 3793 3870.4 -<br />
ROLL RATE, deg./second, includes input time<br />
<strong>RV</strong>-<strong>9A</strong> N129<strong>RV</strong><br />
Lancair IVP N114L<br />
<strong>RV</strong>-8A N58VA<br />
Cessna 152<br />
RANS S-7C<br />
GlaStar<br />
Va<br />
53 Rt./ 61 Lt.<br />
79 Rt./ 90 Lt.<br />
109 Rt./102 Lt.<br />
47<br />
61 Rt./63 Lt.<br />
52 Rt./50 Lt.<br />
1.3 Vso<br />
40 Rt./ 42 Lt.^^<br />
70 Rt./ 56 Lt.<br />
78 Rt./80 Lt. ++<br />
34<br />
50 Rt./53 Lt.<br />
47 Rt./43 Lt.<br />
Flight/Date<br />
#4--8/21/02<br />
#4--8/21/02<br />
^^full flaps, 71.4 mph<br />
++ full flaps, 80 mph<br />
Ave. Weight, Panel CAS, TAS,<br />
Climb angle,<br />
ROC, fpm Comment X/Y<br />
Densalt.<br />
lb<br />
IAS mph mph<br />
deg.<br />
5500.0 1736 90 82 88.3 1265.4 Vx best 6.1 9.4<br />
5500.0 1732 105 95 103. 1348.9 Vy 6.7 8.5<br />
5500.0 1728 100 90 97.7 1316.8 Below 6.5 8.8<br />
5500.0 1724 95 85 92.3 1283.4 Near Vx 6.2 9.1<br />
5500.0 1721 110 100 108. 1314.5 Above 7.2 7.9<br />
2800.0 1747 107 98 106. 1317.0<br />
T. 7.0 8.1<br />
11800. 1729 104 95 114. 769.6 High 13.0 4.4<br />
Densalt. Weigh Panel CAS TAS Sink rate Comment Glide Glide angle<br />
5500.0 1738 105 95 103. 751.7 near Vy 12.0 4.8<br />
5500.0 1735 100 90 97.4 736.8<br />
11.6 4.9<br />
5500.0 1730 90 80 86.8 692.6<br />
11.0 5.2<br />
5500.0 1725 85 75 81.7 664.2 ?Vx 10.8 5.3<br />
5500.0 1722 80 70 76.0 701.1<br />
9.5 6.0<br />
Stall Speeds, <strong>RV</strong>-<strong>9A</strong> N129<strong>RV</strong><br />
Data clock Mode MP/RPM Weight, lb CAS, mph CAS, kts<br />
06:44:07 PM<br />
06:47:20 PM<br />
clean<br />
full flaps<br />
na<br />
12/1800<br />
1759<br />
1758<br />
58.16<br />
49.08<br />
50.5<br />
42.6<br />
11
<strong>RV</strong>-<strong>9A</strong> N129<strong>RV</strong> Cruise Data: All True Airspeeds Corrected For Wing Cuff Drag<br />
Clock<br />
CAS Densalt., ft.<br />
TAS M.P.,<br />
in.<br />
RPM GPH MPG Wt,<br />
lb.<br />
Range,<br />
miles<br />
<strong>CAFE</strong><br />
score<br />
Endur.,<br />
hrs.<br />
Oil<br />
temp<br />
CHT<br />
1<br />
CHT<br />
2<br />
CHT<br />
3<br />
CHT<br />
4<br />
EGT<br />
1<br />
EGT<br />
2<br />
EGT<br />
3<br />
EGT<br />
CXT Comment<br />
4<br />
Peak EGT,<br />
cyl#4<br />
03:05:04 PM 187.1 1828.9 192.2 28.5 2708 14.0 13.7 1682 417 12.8 2.2 170 375 406 408 369 1511 1495 1565 1588 91 Vmax run @ 1100’<br />
04:28:27 PM 173.7 6525.6 191.5 25.9 2698 10.7 17.9 1739 544 16.6 2.8 206 408 417 424 399 1499 1461 1527 1520 122 No cuffs<br />
02:10:43 PM<br />
02:11:10 PM<br />
02:12:36 PM<br />
152.8<br />
153.6<br />
153.9<br />
12529.7<br />
12531.7<br />
12546.0<br />
185.0<br />
186.1<br />
186.5<br />
20.0<br />
20.0<br />
20.0<br />
2604<br />
2602<br />
2599<br />
8.4<br />
8.2<br />
7.8<br />
22.0<br />
22.7<br />
23.9<br />
1720<br />
1720<br />
1718<br />
670<br />
690<br />
727<br />
19.5<br />
20.2<br />
21.4<br />
3.6<br />
3.7<br />
3.9<br />
198<br />
197<br />
196<br />
369<br />
368<br />
370<br />
376<br />
376<br />
382<br />
399<br />
399<br />
405<br />
364<br />
364<br />
367<br />
1358<br />
1382<br />
1401<br />
1346<br />
1356<br />
1387<br />
1410<br />
1434<br />
1454<br />
1408<br />
1420<br />
1461<br />
100<br />
100<br />
100<br />
12.5K rich<br />
12.5K rich<br />
12.5K rich<br />
02:13:32 PM 152.8 12520.7 185.0 20.0 2596 7.3 25.3 1718 770 22.5 4.2 196 374 386 408 373 1443 1421 1537 1532 102 12.5K rich<br />
02:14:33 PM 150.3 12542.9 182.1 20.0 2596 6.3 28.9 1717 879 25.1 4.8 197 379 392 395 366 1543 1543 1545 1566 108 12.5K peak 1566<br />
02:15:03 PM 146.3 12529.1 177.2 20.0 2597 5.9 30.0 1717 913 25.2 5.2 197 377 385 385 360 1522 1505 1506 1507 108 12.5K lean<br />
02:17:32 PM 145.8 12554.1 176.7 20.0 2306 7.8 22.7 1715 689 18.9 3.9 194 366 374 377 352 1329 1286 1262 1279 97 12.5K rich<br />
02:18:22 PM 147.0 12492.8 177.9 20.0 2297 7.6 23.4 1714 712 19.7 4 192 364 371 375 350 1346 1294 1283 1298 95 12.5K rich<br />
02:19:17 PM 148.3 12511.4 179.6 20.1 2300 7.4 24.3 1714 738 20.7 4.1 190 367 372 376 349 1360 1309 1322 1313 94 12.5K rich<br />
02:20:16 PM 150.8 12548.8 182.7 20.1 2298 7.1 25.7 1713 782 22.4 4.3 188 367 372 377 349 1392 1348 1358 1355 94 12.5K rich<br />
02:21:58 PM 148.2 12464.8 179.3 20.1 2294 6.8 26.4 1712 802 22.4 4.5 188 373 384 392 360 1467 1404 1428 1410 97 12.5K rich<br />
02:22:47 PM 143.0 12514.2 173.2 20.0 2293 6.4 27.1 1711 823 22 4.8 188 367 383 393 365 1460 1480 1508 1508 99 12.5K peak 1508<br />
02:31:25 PM 168.7 8530.4 191.9 23.6 2604 9.8 19.6 1704 595 18.2 3.1 190 383 399 405 374 1465 1425 1485 1473 109 8.5K rich<br />
02:31:59 PM 169.5 8509.7 192.8 23.7 2605 9.7 19.9 1703 604 18.6 3.1 194 386 402 408 376 1494 1459 1514 1499 110 8.5K rich<br />
02:32:41 PM 168.5 8489.2 191.5 23.7 2605 9.1 21.0 1703 640 19.5 3.3 196 388 403 411 379 1529 1499 1560 1540 112 8.5K rich<br />
02:33:22 PM 165.5 8507.7 188.1 23.7 2605 7.5 25.1 1702 762 22.7 4.1 199 391 406 407 379 1589 1565 1565 1594 115 8.5K peak 1594<br />
02:33:50 PM 158.0 8499.3 179.6 23.6 2603 6.1 29.4 1702 895 25.1 5 201 386 398 387 370 1518 1512 1536 1519 115 8.5K lean<br />
02:41:49 PM 162.8 8616.6 185.4 23.6 2294 7.9 23.5 1695 713 20.8 3.8 195 381 386 395 366 1425 1400 1392 1408 110 8.5K rich<br />
02:42:35 PM 162.9 8603.5 185.4 23.6 2295 7.7 24.1 1695 732 21.4 3.9 195 383 379 397 371 1436 1405 1407 1423 110 8.5K rich<br />
02:43:55 PM 161.4 8613.6 183.8 23.6 2295 7.3 25.2 1694 765 22.1 4.2 195 391 400 407 374 1495 1466 1453 1467 112 8.5K rich<br />
02:44:33 PM 160.7 8603.4 182.9 23.6 2291 6.7 27.3 1693 830 23.8 4.5 196 382 396 408 377 1515 1530 1543 1538 112 8.5K peak 1538<br />
02:48:51 PM<br />
89.4<br />
8545.5<br />
101.7<br />
13.0<br />
1800<br />
5.9<br />
17.2<br />
1691<br />
524<br />
7<br />
5.2<br />
Conditions: <strong>CAFE</strong> Barograph #3, data flight #2 with wing cuffs. Dew pt 12°C/Temp 21°C. Wing cuff drag = 4.9 smph @ 192.23 smph TAS. All temps in °F. Relative<br />
<strong>CAFE</strong> score = TAS^1.3 x MPG/1000. Range and Endurance calculations assume 5 gallon 30 minute reserve and fuel capacity of 35.4 gallons.. CHT's corrected to a<br />
100°F day. CXT = cowl exit air temperature, °F. Total energy calc used to select valid data. "No cuffs" applies only to Triaviathon Vmax data run at 6525.6' densalt.<br />
197<br />
345<br />
345<br />
353<br />
334<br />
1280<br />
1282<br />
1311<br />
1305<br />
118<br />
Vy cruise<br />
12
KIT SUPPLIER<br />
Van’s Aircraft, Inc.<br />
14401 NE Keil Rd. Aurora, OR 97002<br />
503-678-6545 voice<br />
FAX 503-678-6560 www.vansaircraft.com<br />
OWNER/BUILDER N129<strong>RV</strong><br />
Van’s Aircraft, Inc.<br />
14401 NE Keil Rd. Aurora, OR 97002<br />
503-678-6545 voice<br />
FAX 503-678-6560 www.vansaircraft.com<br />
DESIGNER’S INFORMATION<br />
Cost of QuickBuild kit wihtout engine or prop $25,025<br />
Cost of engine/cost of prop, each new $21,330/ $5,100<br />
<strong>RV</strong>-9/<strong>9A</strong> kits completed to date 68<br />
Estimated hours to build, QuickBuild<br />
500-800 hrs<br />
<strong>RV</strong>-<strong>9A</strong>, N129<strong>RV</strong> ser #2, prototype first flew, date June 15, 2000<br />
Normal empty weight per factory, 160 BHP<br />
1057 lb<br />
Design gross weight, per factory<br />
1750 lb<br />
Recommended engine:<br />
Lycoming 118 - 160 BHP<br />
Advice to builders:<br />
Keep it light, use the<br />
recommended engines<br />
SPECIFICATIONS, N129<strong>RV</strong><br />
Wingspan<br />
27 ft 11 in<br />
Wing chord, root/tip<br />
53.375 in/ 53.375 in<br />
Wing area<br />
123.67 sq ft<br />
Wing loading dl<br />
14.11 lb/sq ft<br />
Power loading<br />
10.94 lb/BHP<br />
Span loading<br />
62.7 lb/ft<br />
Wetted area fuselage/wing/hor./vert./total<br />
na<br />
Airfoil, main wing, CL max. 2.3<br />
Airfoil, design lift coefficient .35<br />
Airfoil, thickness to chord ratio 15%<br />
Aspect ratio, span 2 /sq ft of wing area 6.34<br />
Wing incidence 0.66°<br />
Thrust line incidence, crankshaft<br />
0.0° nose down<br />
Wing dihedral<br />
3.5° per side<br />
Wing taper ratio, root to tip 1.0<br />
Wing twist or washout<br />
none<br />
Wing sweep 0<br />
Steering<br />
castering nose wheel<br />
Landing gear<br />
tricycle, steel spring<br />
Horizontal stab: span/area<br />
10 ft 4.375 in/ 29.4 sq ft<br />
Horizontal stab: chord, root/tip<br />
34 in/ 34 in<br />
Elevator: total span/area<br />
57 in/ 5.84 sq ft<br />
Elevator chord: root/tip<br />
14.75 in<br />
Vertical stab: section/area incl. rudder<br />
42.875 in/ 6.1 sq ft<br />
Vertical stabilizer chord: average<br />
20.5 in<br />
Rudder: ave. span/area<br />
56 in/ 7.5 sq ft<br />
Rudder: chord, average<br />
19.25 in<br />
Ailerons: span/average chord, each<br />
48 in/ 11.625 in<br />
Flaps: span/chord, each<br />
81.5 in/ 9.875 in<br />
Flaps: max deflection angle, up/down<br />
na<br />
Tail incidence 0.0°<br />
Total length<br />
20 ft 8.75 in<br />
Height, static with full fuel<br />
7 ft 10 in<br />
Minimum turning circle on ramp<br />
16 ft 5.5 in<br />
Main gear track<br />
84 in<br />
Wheelbase, nosewheel to main gear<br />
57.44 in<br />
Acceleration limits<br />
+3.8 and (-)1.5 at GW<br />
+4.4 and (-) 2.2 at < 1650 lb<br />
AIRSPEEDS AS MEASURED BY <strong>CAFE</strong>: smph/kts, CAS<br />
Best rate of climb, V y<br />
95 smph/82.5 kt<br />
Best angle of climb, V x<br />
82 smph/71.2 kt<br />
Stall, clean, 1759 lb, V s1<br />
58.16 smph/50.5 kt<br />
Stall, full flaps, 1758 lb, V s0<br />
49.08 smph/42.6 kt<br />
CL max, at 49.08 mph stall 2.3<br />
AIRSPEEDS PER OWNER’S P.O.H., smph, Panel IAS<br />
Never exceed, V ne<br />
210 smph/182.3 kt<br />
Maneuvering, V a<br />
118 smph/102.4 kt<br />
Flap extension speed, V f<br />
90 smph/78.1 kt<br />
Gear operation/extension, V ge<br />
na<br />
13
SPECIFICATIONS, N129<strong>RV</strong><br />
Empty weight/gross wt.,<br />
1078.05 lb/ 1750 lb<br />
Payload, full fuel<br />
459.6 lb<br />
Useful load<br />
671.95 lb<br />
ENGINE:<br />
Engine make, model<br />
Lyc. O-320 D3G<br />
Engine horsepower<br />
160 BHP<br />
Engine TBO/compression ratio<br />
2000 hr./8.5<br />
Engine RPM, maximum<br />
2700 RPM<br />
Man. Pressure, maximum<br />
30 in<br />
Cyl head temp., maximum<br />
475° F<br />
Oil pressure, normal operating range<br />
55-95 psi<br />
Oil temp., operating, maximum<br />
245° F<br />
Fuel pressure range, pump inlet<br />
0.5-8.0 psi<br />
Induction system<br />
Marvel Schebler MA-45 SPA carb<br />
Induction inlet area<br />
5.2 sq in<br />
Exhaust system<br />
4 into 2, crossover<br />
ave. header/collector lengths<br />
na<br />
Oil capacity, type<br />
8 quarts<br />
Ignition system Dual Slick magneto, #4371 and 4370<br />
Cooling system<br />
dual pitot inlets<br />
Cooling inlet area<br />
6.5x3.5 in each (45.5 sq in)<br />
Cooling outlet area<br />
fixed, 42.45 sq in<br />
PROPELLER:<br />
Make, model<br />
MTV-12-C/180-119d, 3 blades<br />
Material<br />
wood, graphite with metal leading edge<br />
Diameter<br />
71 in<br />
Prop extension, length<br />
same as std. Hartzell<br />
Prop ground clearance, empty of fuel<br />
na<br />
Spinner diameter/length<br />
13 in x 15.25 in long<br />
Electrical system<br />
Alternator, 35 amp Nippondenso<br />
Fuel system<br />
R/L wing tanks, selector, elect + mech pumps<br />
Fuel type<br />
91/96 or 100LL<br />
Fuel capacity, by <strong>CAFE</strong> Scales<br />
35.4 gal<br />
Fuel unusable<br />
near zero<br />
Braking system<br />
Cleveland discs, Matco master cyl.<br />
Flight control system<br />
push/pull rods excepting cable rudder, 2 sticks<br />
Hydraulic system<br />
na<br />
Tire size, main/nose<br />
5:00 x 5 main/ Lamb nosetire<br />
CABIN DIMENSIONS:<br />
Seats<br />
2, side by side, baggage behind seats<br />
Cabin entry<br />
canopy slides back<br />
Width at hips<br />
41 in<br />
Width at elbows<br />
42.5 in<br />
Width at shoulders<br />
43 in<br />
Height, seat pan to canopy, torso axis<br />
41 in<br />
Legroom, rudder pedal to seatback*<br />
47.5-51 in<br />
Baggage dimen. to height of seatback<br />
na<br />
Baggage weight limit<br />
100 lb<br />
Liftover height to baggage area<br />
na<br />
Step-up height to wing T.E.<br />
a step is provided on each side<br />
*builder selects this fixed dimension<br />
Demonstrated maneuvers:<br />
standard category, no aerobatics<br />
Equipment list:<br />
Oil cooler: Aero Classics LTD 8000075<br />
Governor:<br />
Woodward B210 776A<br />
Starter:<br />
Sky-Tec 149-12LSX 12V. 12/14 pitch<br />
Vacuum pump:<br />
none<br />
Engine instruments:<br />
analog<br />
Strobes:<br />
Whelen Double Flash<br />
Shoulder harnesses:<br />
yes<br />
Battery:<br />
Hawker Energy Odyssey PC-680<br />
Radios:<br />
Apollo SL60/map GPS/Comm<br />
Apollo SL70 transponder<br />
Flightcom 403 intercom<br />
Flight instruments:<br />
TAS indicator<br />
Electric turn coordinator<br />
Compass<br />
VSI, altimeter.<br />
14