On the aerodynamic optimization of mini-RPV ... - CAFE Foundation
On the aerodynamic optimization of mini-RPV ... - CAFE Foundation
On the aerodynamic optimization of mini-RPV ... - CAFE Foundation

Create successful ePaper yourself
Turn your PDF publications into a flip-book with our unique Google optimized e-Paper software.
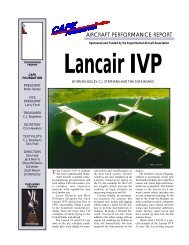
AI AA-84-2 163<strong>On</strong> <strong>the</strong> Aerodynamic Optimization<strong>of</strong> Mini-<strong>RPV</strong> and Small GA AircraftF. R. Goldschmied, Monroeville, PAAlAA 2nd Applied Aerodynamics ConferenceAugust 21 -23, 1984/Seattle, WashingtonFor permission to copy or republish, contact <strong>the</strong> American Institute <strong>of</strong> Aeronautics and Astronautics1633 Broadway, New York, NY 10019
ON THE AERODYNAMIC OPTIMIZATION OF MINI-<strong>RPV</strong> AND SMALL GA AIRCRAFlFoblo R. Goldschmied"Monruevi 1 le, PA 15146vAbstractFWWing drag, lbA brief study has been carried out on <strong>the</strong> adap- H,Jet total-head @ Sta. 5, lblft'tation <strong>of</strong> an optimized system comprising an axisymmetricbody, suction boundary-layer control and AH,, Total-head rise <strong>of</strong> fan between Sta.stern jet-propul sion, which was developed origi- 2 and 5, lb/ft2nally for lighter-than-air application, to <strong>mini</strong>-<strong>RPV</strong>Wing lift, 7band small GA aircraft by <strong>the</strong> addition <strong>of</strong> dynamicwina lift. For <strong>mini</strong>-<strong>RPV</strong>. consideration has been n Fan soeed, , RPMgiven to fuselage diameters <strong>of</strong> 20 and 34" with aFree-stream static pressure, lb/ft2gross weight range from 125 to 300 lb at <strong>the</strong> speeds<strong>of</strong> 100 and 150 Kn. The predicted powers rangedStatic base pressure @ Sta. 5, lblft'from 2.35 to 16.20 HP.P5For <strong>the</strong> GA aircraft,consideration has been givento fuselage diameters <strong>of</strong> 45 and 60" with a grossweight range from 1400 to 3400 lb at <strong>the</strong> speed <strong>of</strong>200 MPH. The predicted powers ranged from 60.6to 132.5 HP.AARBCAH, 5CH,, = -4"H, - PCHT,o= -q0LCL = qNomencl at ureWing area, ft2Aspect ratioWing span, ftWing chord, ftWing drag coefficientFan pressure-rise coefficientJet total-head coefficientWing lift coefficientP, - PCP5 = - Static base pressure coefficientq0 @ Sta. 5IWCTw = -qovo'66TOCTo = ___d,Dqovo.66Fan suction flow coefficientThrust coefficient for wingTotal thrust coefficientDiameter <strong>of</strong> stern jet and <strong>of</strong>fan, ftDiameter <strong>of</strong> fuselage, ftqo = w,24Tu =tnd,nUOVNOEl- wouoHP550'IFVP$ = A n5 diutFree-stream dynamic pressure, lb/ft2Fan suction flow, ft'lsecThrust <strong>of</strong> fusel agelboundary-l ayercontrol/jet system, lbFan tip speed, ft/secFree-stream velocity, ft/secJet velocity @Fuselage volume, ft3Gross weight, lbSta. 5, ft/secAerodynamic efficiency indexFan total efficiencyKinematic viscosity <strong>of</strong> air, ft2/secMass density <strong>of</strong> air, lb sec2/ft4Fan flow parameterIntroductionThe concept <strong>of</strong> <strong>the</strong> optimum <strong>aerodynamic</strong> integration<strong>of</strong> body pressure-distribution (with concomitantshape), slot-suction boundary-layer control andstern jet-propulsion was presented in 1967'; a windtunnelverification with a self-propelled test modelwas presented in 1982,' showing 50% power reductionas compared to <strong>the</strong> best streamlined body with sternwake-propeller. An optimized LTA system was derivedfrom <strong>the</strong> above data' and it was also shown that jetpropulsion<strong>of</strong> a subsonic body with free transitionwas achieved with jet total-head equal to freestream's.'It can be noted that, for <strong>the</strong> same massflow, a conventional free-stream jet propulsor wouldhave a jet total-head coefficient CHT, = 4 or, for<strong>the</strong> same diameter, a coefficient CHT, = 2, as shownin Ref. 5, on <strong>the</strong> basis <strong>of</strong> <strong>the</strong> best conventionalstreamlined body <strong>of</strong> equal volume.The <strong>optimization</strong> <strong>of</strong> streamlined bodies by shape*Consulting Engineer; Associate Fellow AIAA. only was presented in 1974;6 for all-turbulent.-/ boundary-layers, little drag gain could be obtained@Copyright 1984 by Fabio R. Goldschmied, P.E. by optimizing <strong>the</strong> shape. This extensive programReleased Io AlAA Io publish in all lorms.
proved conclusively that boundary-layer controland propulsion had to be integrated with <strong>the</strong> bodyshape if substantial power gain had to be achieved.The objective <strong>of</strong> this paper is to investigateheavier-than-air applications <strong>of</strong> this optimizedsystem, i.e. to investigate <strong>the</strong> installation <strong>of</strong>a lifting wing onto <strong>the</strong> fuselagefboundary-layercontrolfjet propulsion system. The evaluation willbe carried out on <strong>the</strong> basis <strong>of</strong> an <strong>aerodynamic</strong> efficiencyindex 6 = W,U,/HP for two classes <strong>of</strong> aircraft,i.e. <strong>mini</strong>-<strong>RPV</strong> @ 100 and 150 Kn and smallGA (General Aviation) 2-seat and 4-seat aircraft0 200 MPH.Qtimizeo Body/Boundary-Layer Control/Jet-Propblsion System: *Tunnel Te-ss_tThe wind-tunnel test program <strong>of</strong> <strong>the</strong> 20" diameterself-propelled model was carried out in 1981 in<strong>the</strong> 8x10 low-speed wind tunnel <strong>of</strong> <strong>the</strong> David TaylorNaval Ship R&D Center; <strong>the</strong> test program was quiteextensive as it comprised over 800 test pointsorganized in 86 test runs. The test results arepresented in Refs. 2, 3 and 4. The basic testmodel with open jet (Conf. 00) is shown in Fi1 (starboard photo) and in Fig. 2 (stern photoy:In Fig. 1 <strong>the</strong> 12" chord strut can be plainly seenas large as a wing would be; its interferenceeffect is already accounted for in all <strong>the</strong> testresults. Fioure 2 shows clearly <strong>the</strong> three radialrakes in <strong>the</strong> jet nozzle to measure <strong>the</strong> flow and<strong>the</strong> jet total-head... .:. ./jFig. 2:.:.:.. . . 8Stern photo <strong>of</strong> wind-tunnel test model(Conf. 00)Fig. 1 Starboard photo <strong>of</strong> wind-tunnel test model(Conf. 00)The axial force (drag or thrust) measurementswere based both on <strong>the</strong> wake's momentum balance,as indicated by a wake rake, and on <strong>the</strong> forceexerted on <strong>the</strong> strut, as indicated by <strong>the</strong> windtunnelbalance which was supporting <strong>the</strong> strut.At <strong>the</strong> higher thrust coefficients, above CT =0.010, <strong>the</strong>re was in all cases excellent agreementbetween <strong>the</strong> two types <strong>of</strong> axial force measurements,as shown in Figs. 7, 8 and 9; <strong>the</strong>refore <strong>the</strong> thrustdata cannot be disputed in any way.The model was also tested with a tailboom in<strong>the</strong> jet nozzle (Conf. 01) as shown in Fig. 3.Fig. 3 Port photo <strong>of</strong> wind-tunnel test model withtailboom (Conf. 01)The layout <strong>of</strong> <strong>the</strong> test model's aftbody with <strong>the</strong>suction slot, fan installation and jet nozzle isshown in Fig. 4. While <strong>the</strong> fan should have beenat Station 5, <strong>the</strong> arrangement shown had to be acceptedfor practical reasons. The fan mass-flowweighted mean pressure rise is computed betweenStations 2 and 5, with <strong>the</strong> flow being measured atStation 5; <strong>the</strong> fan air power is determined by <strong>the</strong>product <strong>of</strong> flow and pressure rise.Figure 5 presents a photo <strong>of</strong> <strong>the</strong> axial faninstallation in <strong>the</strong> forebody <strong>of</strong> <strong>the</strong> wind-tunnel testmodel: <strong>the</strong> fan discharae is in <strong>the</strong> left foresround,while <strong>the</strong> fan intake i s indicated by <strong>the</strong> Foundededge inside <strong>the</strong> forebody.._.2
L&&-R =ssx106 I... iMSz1.00 0.7 0.4 0.6 0.8 1.0 12 1.4 1.6 -... 1.8 L.-L 2.0 2.2 L...U. 2.4 2.612.8 1.0Dimanrianler~ hidl 0iildnce. XI0Fig. 6System AnalysisExperimental static-pressure distributionon test model @ 6" angle <strong>of</strong> attackFig. 4 Aftbody layout with suction-slot, faninstallation and jet nozzle (Conf. 00)A procedure has been developed for <strong>the</strong> addition<strong>of</strong> wings to <strong>the</strong> body and for <strong>the</strong> computation <strong>of</strong> <strong>the</strong>additional thrust acquired from <strong>the</strong> jet to counteract<strong>the</strong> wino's draa. The wino's liftldraa ratioshave been coGputed irom classical NACA data;' betterresults could be obtained with modern airfoils suchas <strong>the</strong> Liebeck, <strong>the</strong> NASA GA(W)-l and -2, etc. Thefan performance has been based on <strong>the</strong> tested NASAaxial rotor/stator stage 516; <strong>the</strong> stage's designand experimental performance is given in Ref. 8......:...Fig. 5 Photo <strong>of</strong> fan installation in wind-tunneltest modelThe typical stepwise static pressure distributionon <strong>the</strong> body i s shown in Fig. 6 at 0' and 6' angle<strong>of</strong> attack. The stepwise distribution is used (withsuitable boundary-layer control) to avoid <strong>the</strong> largegrowth <strong>of</strong> <strong>the</strong> boundary-layer momentum-thicknesswhich nonnallv occurs in <strong>the</strong> adverse Dressuregradient area "and to achieve very low external wakedrags, as shown in Refs. 1 and 2.While in Refs. 2, 3 and 4 <strong>the</strong> wind-tunnel testdata were plotted only up to CT = 0.020, since <strong>the</strong>main focus was on <strong>the</strong> equilibrium point (CT = O),in this paper all <strong>the</strong> available test data are plotted,for both free transition on <strong>the</strong> body and fortransition tripped at 10% length.The experimental wind-tunnel test data <strong>of</strong> Ref.2 have been replotted in <strong>the</strong> complete thrust rangeand are shown in Figs. 7, 8, 9, 11, 12 and 13. Thefan selection plot is given in Fig. 10, with <strong>the</strong>516 performance curves relating pressure, flow andefficiency.The computational procedure comprising 15 stepsis given below:1. Select <strong>the</strong> max. cruise speed U, and <strong>the</strong>corresponding dynamic pressure qo; determine orestimate <strong>the</strong> gross weight Wo.2. Select fuselage diameter to yield adequatecabin space and/or equipment volume.3. Assume lift coefficient CL <strong>of</strong> wing @ max.cruising speed. Compute <strong>the</strong> wing loading qoCL and<strong>the</strong> wing area A = Wo/qoCL. A lift coefficient CL= 0.40 is selected for <strong>the</strong> <strong>mini</strong>-<strong>RPV</strong> and CL : 0.30is selected for <strong>the</strong> GA aircraft.4. Compute <strong>the</strong> wing chord and span, assuminga wing aspect-ratio AR = 10 and constant chord:c =QB = 1ocActually <strong>the</strong> wing may have a taper ratio and <strong>the</strong>computed chord value is <strong>the</strong> niean chord.5. Compute <strong>the</strong> wing lift/drag ratio at <strong>the</strong>selected CL point, using one <strong>of</strong> <strong>the</strong> following twoexperimental equations from Ref. 7 (Fig. 18, p. 21)for wings <strong>of</strong> aspect ratio AR = 10:a. Cg=O.0068+0.0343 Cf (NACA 23018 Airfoil)b. Cg=0.0045+0.0383 Cf (NACA 653-418 Airfoil)A parametric wing design study should be made, in<strong>the</strong> manner <strong>of</strong> Koegler,' but it is beyond <strong>the</strong> scope<strong>of</strong> this brief paper.3
Compute6. Compute <strong>the</strong> drag <strong>of</strong> <strong>the</strong> wing:WOFw = cL/cDsince <strong>the</strong> wing lift must equal <strong>the</strong> gross weightW,. Compute <strong>the</strong> thrust coefficient:required to generate <strong>the</strong> thrust to counterbalance<strong>the</strong> wing drag. Add 10% to <strong>the</strong> wing thrust coefficientfor wing/fuselage interference drag, although<strong>the</strong> model was tested in <strong>the</strong> wind-tunnel with astrut large enough to be a wing; also add ano<strong>the</strong>rthrust coefficient increment <strong>of</strong> 0.003 for <strong>the</strong>empennage and tailboms.CT, = CTw f 0.10 CTw f 0.003LIn <strong>the</strong> wind-tunnel tests <strong>of</strong> Ref. 2, an empennageadequate to yield neutral static stability to <strong>the</strong>body up to 8' had an incremental power coefficient<strong>of</strong> only 0.0020.7. Obtain <strong>the</strong> value <strong>of</strong> <strong>the</strong> fan air power coeffi cient :aL._UcY rn0.02kM I 01*from <strong>the</strong> experimental plot CHP~J vs CT as presentedin Fig. 7, corresponding to <strong>the</strong> above CT, for <strong>the</strong>free transition or for <strong>the</strong> tripped transition case,as warranted by <strong>the</strong> Reynolds number and by operationalconsiderations.8. Obtain <strong>the</strong> value <strong>of</strong> <strong>the</strong> fan flow coefficient:Fig. 70 0.01 0.02 0.03 0.MThrust Coefficient CT =Tk,Vo'66Fan air power coefficient CHP25 vs Thrustcoefficient CTfrom <strong>the</strong> experimental plot CQs vs CT as presentedin Fig. 8, corresponding to <strong>the</strong> above CT, for <strong>the</strong>free transition or for <strong>the</strong> tripped transition case,as warranted by <strong>the</strong> Reynolds number and by operationalconsiderations. Compute <strong>the</strong> fan flow 4 =cq, x U0VQ.66.I ..* I I I9. Obtain <strong>the</strong> value <strong>of</strong> <strong>the</strong> fan pressure-risecoefficient :0.03-TransitionAnCHli = 2q<strong>of</strong>rom <strong>the</strong> experimental plot C H ~ S vs CT as presentedin Fig. 9, corresponding to <strong>the</strong> above CT, for <strong>the</strong>free transition or for <strong>the</strong> tripped transition case,as warranted bv <strong>the</strong> Revnolds number and bv ooerationalconsid&ations. ~ <strong>the</strong> fan i r e b erise AH,,= CH, x q,.10. The selection <strong>of</strong> <strong>the</strong> best axial rotor/statorstage for <strong>the</strong> job requires <strong>the</strong> computation <strong>of</strong> <strong>the</strong>fan system resistance coefficient O'/$ in <strong>the</strong> O Ndomain :15--2LY 5a"@ = 3557Fig. 8Fan flow coefficient CQ5 vs Thrustcoefficient CT44
p 1.00 ,* i I I I INASA Axial1Transition0.4 -Thrust Coefficient CT = T/qoVa6Fig. 9The denomination <strong>of</strong>Fan pressure-rise coefficient CH2s vsThrust coefficient CT$ is <strong>the</strong> fan flow parameter:0’3 -Fan System Resistance0. 2 -@=$-7 d:utYThe denomination <strong>of</strong> + is <strong>the</strong> fan total-pressureparameter:The fan diameter corresponds to <strong>the</strong> jet diameterd, ; ut = ndSn is <strong>the</strong> fan tip speed and P is <strong>the</strong>air mass density. Figure 10 presents <strong>the</strong> $4 plotwith two fan system resistance curves, representing<strong>the</strong> max. and min. encountered in this study, andwith <strong>the</strong> experimental performance curves $4 and$-n~ <strong>of</strong> <strong>the</strong> selected NASA axial rotor/stator stage518;’ it can be seen that a fairly good match isachieved, i.e. <strong>the</strong> fan will operate between 88.3and 90.6% efficiency. Fan <strong>aerodynamic</strong> selectionprocedures are discussed thoroughly in Section 6<strong>of</strong> Ref. 10.11. The fan speed is computed:n =-- cq5 ‘a 130.13 RPS$ VO.33The value <strong>of</strong> <strong>the</strong> fan flow parameter + is determinedin Fig. 10 from <strong>the</strong> intersection <strong>of</strong> <strong>the</strong> fan systemresistance curve with <strong>the</strong> NASA 518 performancecurve. The range <strong>of</strong> $ is from 0.485 to 0.508.Similarly, <strong>the</strong> fan efficiency n~ is determined inFig. 10 from <strong>the</strong> NASA 51B efficiency curve at <strong>the</strong>above 0 location.The fan diameter is assumed to correspond to <strong>the</strong>stern jet diameter: ds = 0.1625D.12. The fan shaft power can be computed now from<strong>the</strong> CHP25 value <strong>of</strong> Step 7 and <strong>the</strong> above efficiencydetermination for an available fan design:0.1 - I I I I0 0.2 0.3 0.4 0.5 0.6Fan Flw Parameter 0Fig. 10 Fan pressure parameter + and totalefficiency QF vs fan flow parameter $13. The jet total-head coefficientCHT,Hs- Poqo= __is determined from <strong>the</strong> plot <strong>of</strong> Fig. 11 and <strong>the</strong> jetvelocity ratio Us/U, is determined from <strong>the</strong> plot<strong>of</strong> Fig. 12 for <strong>the</strong> free transition or <strong>the</strong> trippedtransition cases, as warranted by Reynolds numberand opera t i onal con si dera ti on s.14. The jet static base pressure coefficient CP,is determined from <strong>the</strong> plot <strong>of</strong> Fig. 13. It can beseen that <strong>the</strong> static base pressure coefficient rangeis very high; CPs will be over 0.8 for <strong>the</strong> thrustcoefficient range <strong>of</strong> this study. As a reference,Ref. 11 shows that <strong>the</strong>’ base pressure coefficient<strong>of</strong> conventional boattail/jet afterbodies is in <strong>the</strong>0.10 to 0.15 range.15. The final step is <strong>the</strong> computation <strong>of</strong> <strong>the</strong><strong>aerodynamic</strong> efficiency index:The index expresses <strong>the</strong> power required to fly <strong>the</strong>aircraft’s gross weight at <strong>the</strong> max. cruise speed;<strong>the</strong>refore, it i s a good indication <strong>of</strong> <strong>the</strong> efficiency<strong>of</strong> <strong>the</strong> <strong>aerodynamic</strong> design when comparingtwo aircraft at <strong>the</strong> same speed.5
~Mini -<strong>RPV</strong>L& 9,- '\FreeTransiiionfiConi. Wake1 andTransitionTripped B 58% 0I I I I I0.01 0.02 0.03 0.04 0.050.66Thrust Ccefficient CT = T/q V0Fig. 11 Jet total-head coefficient CHT, vSThrust coefficient CTMini-<strong>RPV</strong> <strong>aerodynamic</strong> design has not achieved yetan adequate degree <strong>of</strong> efficiency for <strong>the</strong> missionspeed and endurance requirements. Considering typicalcurrent vehicles such as <strong>the</strong> Air Force/BoeingPave Tiger, <strong>the</strong> Atmy/Lockheed Aquila, <strong>the</strong> Israel WAircraft industries Scout, <strong>the</strong> Tadiran Mastiff MK3and <strong>the</strong> Developmental Sciences Sky Eye, it is foundthat <strong>the</strong> gross weight ranges from 220 to 380 lb,<strong>the</strong> maximum cruising speed ranges from 85 to 100Kn and <strong>the</strong> engine powers range from 22 to 30 HP.The <strong>aerodynamic</strong> efficiency index ranges from 2.5to 3.5.The wind-tunnel test model,2"'4 with its diameterD = 20.0 in. and 100 Kn speed, may be classifiedas a full-scale <strong>mini</strong>-<strong>RPV</strong>; Table 1 presents itsperformance data for 125, 150 and 175 lb grossweights with a suitable wing (CL = 0.40) and empennage.Table 1 20" Diameter (V = 6.2 ft3) Mini-<strong>RPV</strong>P 100 Kn (qo = 34.1 PSF)(Free Transition)1.8 I I I I1Gross Weight W, lbWing loading qoCL @ CL= 0.4PSF125 It13.6150 lb13.6175 lb13.60. 2 c01001 lo-II I I I J0.01 0.02 0. m 0. M 0.05Thrust Ccefficient CT = TPoVo'66Fig. 12 Jet velocity-ratio U,/U,coefficient CT1.4, I I I Ivs ThrustI I I I I0 0.01 0.02 0.03 0.M 0.05Thrust Ccefliclent Cl =T/qoVo'MFig. 13 Jet static base pressure coefficient CP,Thrust coefficient CTIvsWing area A = Wo/qoCL, ft2Wing chord, C ftWing span, B ftLift/drag ratio <strong>of</strong> wing,CL/CD @ CL = 0.40Drag <strong>of</strong> wing, Fw = WCLo / ~Thrust coeff. for wingCTwTotal thrust coeff. CTaFan air power coeff. CHP,Fan flow coeff. CQ,Fan flow 9CFSFan pressure-risecoeff.CHzsFan pressure-riseAH2 iPSFFan system-resi stancecoeff.@2/*Fan speed, nRPMFan diameter, d, in.Fan efficiency, '?F %Fan shaft powerHPJet total-head coeff. CHT5Jet velocity ratio U,/UoJet static basepressure coeff.cp5Aerodynamic efficiency F.index9.190.9589.5837.63.320.02850.034E0.0600.023713.502.5486.360.78533,9643.2589.752.352.661.351.0416.3411.031.05010.5037.63.990.03480.04120.06850.025214.352.8095.200.80535,7563.2590.502.782.901.421.1017.20__12.861.13411.3437.64.651.04061.04761.07551.026415.033.05103.700.81137,3113.2590.753.123.161.511.1018.22V6
~~4VWith free transition <strong>the</strong> fan shaft powers are3 HP and less at <strong>the</strong> 100 Kn speed; <strong>the</strong> <strong>aerodynamic</strong>efficiency index is over 16. The engine may bean available Fox Twin, yielding 3 HP @ 14,500 RPMand weighing 3 lb with mount and muffler. Table2 presents <strong>the</strong> performance data <strong>of</strong> <strong>the</strong> same 20 in.fuselage at 150 Kn speed with free transition,while Table 2a presents <strong>the</strong> corresponding data withtransition tripped @ 10% length on <strong>the</strong> fuselage,for gross weights <strong>of</strong> 150, 175 and 200 lb. It isfound that <strong>the</strong> fan shaft powers are less than 7HP with free transition and less than 8 HP withtripped transition; <strong>the</strong> corresponding <strong>aerodynamic</strong>efficiency index values are over 13 and 10, respectively.As a direct comparison with a current <strong>mini</strong>-<strong>RPV</strong>design, <strong>the</strong> fuselage diameter was increased to 34in. to match both <strong>the</strong> lateral dimension and <strong>the</strong>length <strong>of</strong> <strong>the</strong> Air Force/Boeing Pave Tiger's fuselage;Table 3 presents <strong>the</strong> performance data @ 100Kn with free transition while Table 3a presents<strong>the</strong> corresponding data with transition tripped @10% length, for gross weights <strong>of</strong> 225, 250 and 2751 b.7Table 2 20" Diameter (V = 6.2 ft') Mini-<strong>RPV</strong>@ 150 Kn (qo = 77.3 PSF)(Free Transition)~ __175 lb 203 lbWing loading qoCL @ C~=o.430.8 30.8Wing area A = Wo/qoCL,Wing span, BLift/drag ratio <strong>of</strong> w'CL/CO @ CL = 0.40ft2Wing chord, C =tCLDrag <strong>of</strong> wing, Fw = W0/%Thrust coeff. for wing CTwTotal thrust coeff.Fan air power coeff. CHP,Fan flow coeff. CQ,Fan flow QCT,CFSFan pressure-risecoeff. CH2 5Fan pressure-riseAH,,PSFFan system-resi stancecoeff. '$2/ $Fan speed, nRPMFan diameter, dSin.Fan efficiency, 'iF %Fan shaft powerHPJet total-head coeff. CHTsJet velocity ratioJet static basepressure coeff.Aerodynamic efficiency4 indexU,/Uocp5E4.870.6976.9737.63.990.015:0.01910.039!0.020;17.201.94150.00.74644,0713.2589.05.292.061.160.8613.005.680.7537.5337.64.650.01790.02260.04320.021017.892.05158.80.76345,4123.2589.65.742.201.200.8914.006.490.8058.0537.65.320.02050.02550.04710.021618.402.16166.90.76646,6173.2589.76.262.301.250.9314.69With free transition <strong>the</strong> fan shaft powers areless than 6 HP while with tripped transition <strong>the</strong>powers are less than 20 HP; this may be comparedwith <strong>the</strong> 28 HP enaine <strong>of</strong> <strong>the</strong> 250 lb Pave Tiaer.The <strong>aerodynamic</strong> efficiency index values are over14 and 11, respectively.Finally, Table 4 presents <strong>the</strong> performance data<strong>of</strong> <strong>the</strong> 34 in. diameter fuselage at 150 Kn withgross weights <strong>of</strong> 250, 275 and 300 lb and withtripped transition. It can be noted that this casewith 300 lb represents a substantial performanceimprovement over <strong>the</strong> Pave Tiger, in both speed (50%gain) and weight (20% gain); <strong>the</strong> fan shaft poweri s 16 HP and <strong>the</strong> <strong>aerodynamic</strong> efficiency index is8.75. It can be noted that, with tripped transition,<strong>the</strong>re is no laminar flow risk and that <strong>the</strong>turbulent power coefficients should actually belower because <strong>the</strong> Reynolds number is higher by <strong>the</strong>factor 1.7 x 1.5 = 2.55.A schematic layout <strong>of</strong> <strong>the</strong> proposed <strong>mini</strong>-<strong>RPV</strong> configurationi s shown in Fig. 14; <strong>the</strong> pylon/wingarrangement was proposed by Larrabee" for glidersso as to maximize <strong>the</strong> wing's lift. It can be notedthat <strong>the</strong> pylon/fuselage interference effect wasalready simulated in <strong>the</strong> wind-tunnel tests by <strong>the</strong>strut. The wing span is 162 in. and <strong>the</strong> usefulfuselage length is 83 in., while <strong>the</strong> overall fuselagelength is 127 in. The empennage is supportedby a single boom.Small General Aviation AircraftSmall GA aircraft cornwise ano<strong>the</strong>r cateoorv.~ ..to which this system analysis may be applied withinteresting results.Table 2a20" Diameter (V = 6.2 ft3) Mini-<strong>RPV</strong>@ 150 Kn (qo = 77.3 PSF)(Transition Tripped @ 10% Length)Gross Weight Wo lbTotal thrust coeff. CT,Fan air power coeff. CHPZSFan flow coeff. CQ,Fan flow QCFSFan pressure-risecoeff.CH,Fan pressure-riseAH* 5PSFFan system-resi stancecoeff.'$2/$Fan speed, nRPMFan diameter, d5 in.Fan efficiency, 'i~ %Fan shaft powerHPJet total-head coeff. CHTSJet velocity ratio U,/UoJet static basepressure coeff.cp5Aerodynamic efficiency Eindex__150 110.019c0.0500.022;18.92.24173.10.78149,0343.2588.36.752.281.280.9810.40~175 I t0.0220.054:0.022719.32.35181.60.77849,8353.2589.97.192.401.321.0211.19-200 lb0.02550.05870.023419.92.48191.70.78350,1403.2590.27.752.501.361.0611.84__7
~~~~Table 334" Diakter (V = 30.5 ft3) Mini-<strong>RPV</strong>@ 100 Kn (so = 34.1 PSF)(Free Transition)Gross Weight Wo lbWing loading qoCL @ C~=0.4PSFWing area A = Wo/qoCL, ftZWing chord, C ftWing span, B ftLift/drag ratio <strong>of</strong> wing,CL/CO @ CL = 0.40Drag <strong>of</strong> wing, Fw =CLThrust coeff. for wing CTwTotal thrust coeff. CT,Fan air power coeff. CHP,,Fan flow coeff. CQ5Fan flow QCFSFan pressure-risecoeff.CHssFan pressure-riseAH, _ _PSFFan system-resi stancecoeff. $2/*Fan speed, nRPMFan diameter, d in.Fan efficiency, n~ %Fan shaft powerHPJet total-head coeff. CHT5Jet velocity ratio U,/UoJet static basepressure coeff.CPSAerodynamic efficiency Eindex-225 lb13.616.51.28412.8437.65.981.01801.02281.04361.021034.952.0569.90.763:7,9165.52589.104.982.201.200.9014.0__!50 I t13.618.41.35613.5637.66.651.02011.02511.046f1.021f35.942.1472.9D.7738,3545.52589.405.292.301.240.9214.6__175 lb13.620.21.42114.2137.67.31'LO2211.02738.0495'.022036.602.2376.03.7708.6195.52539.605.652.381.260.9515.1Table 434" Diameter (V = 30.5 ft') Mini-<strong>RPV</strong>@ 150 Kn (so = 77.3 PSF)(Transition Tripped @ 10% Length)Gross Weight Wo lbWing loading qoCL @ C~'0.4PSFWing area A = Wo/qoCL, ftZWing chord, C ftWing span, B ftLift/drag ratio <strong>of</strong> wing,CL/CD @ CL = 0.40CLDrag <strong>of</strong> wing, Fw = W o / r lb0Thrust coeff. for wing CTwTotal thrust coeff. CT,Fan air power coeff. CHP,,Fan flow coeff. CQsFan flow QCFSFan pressure-risecoeff.CH25Fan pressure-riseAH*,PSFFan system-resi stancecoeff.m2/*Fan speed, nRPMFan diameter, d in.Fan efficiency, QF %Fan shaft powerHPJet total-head coeff. CHTsJet velocity ratio U&Jet static base CP 5pressure coeff.Aerodynamic efficiency Eindex250 lb 275 lb30.8 30.86.65 7.310.0089 0.00980.0128 0.01380.0390 0.04050.0198 0.020248.8 49.81.92 1.98148.4 153.00.724 0.73125,862 ' 26,2765.525 5.52588.4 88.615.00 15.701.90 1.961.15 1.160.87 0.897.728.19-I00 lb__30.89.740.9869.8637.67.981.01061.01461.04161.020550.52.02156.30.7385,5575.52588.816.202.001.180.908.75 WWTable 3a 34" Diameter (V = 30.5 ft') Mini-<strong>RPV</strong>P 100 Kn (qo = 34.1 PSF)(Transition Tripped @ 10% Length)Gross Weight Wo lbTotal thrust coeff. CTOFan air power coeff. CHP,Fan flow coeff. CQ,Fan flow QCFSFan pressure-risecoeff.CH,,Fan pressure-riseAH25PSFFan system-resistancecoeff.m2/+Fan speed, nRPMFan diameter, d5 in.Fan efficiency, n~ %Fan shaft powerHPJet total-head coeff. CHT,Jet velocity ratio U,/UoJet static basepressure coeff.CP 5Aerodynamic efficiency Eindex~275 lb0.02730.06120.023739.432.5486.60.78520,0185.52589.86.902.561.381.0812.26Table 5 lists <strong>the</strong> pertinent parameters <strong>of</strong> threecurrent 2-seat personal GA aircraft by Beech,Cessna and Piper; <strong>the</strong> gross weight is nearly <strong>the</strong>same (1670 to 1675 lb) and so is <strong>the</strong> speed (121to 127 MPH) and <strong>the</strong> engine power (108 to 115 HP).The <strong>aerodynamic</strong> efficiency index is in <strong>the</strong> vicinity<strong>of</strong> 5.0.The fuselage diameter is selected at 45 in. soas to accommodate two tandem seats; <strong>the</strong> cabinarrangement layout is shown in Fig. 15. It hasbeen observed that <strong>mini</strong>mum cabin height is 42 in.and <strong>the</strong> <strong>mini</strong>mum seat spacing dimension is 36 in.-The speed has been selected to be 200 MPHinstead <strong>of</strong> 125 MPH because it represents presentGA speed for small personal aircraft. Table 6 presents<strong>the</strong> performance data for gross weights <strong>of</strong>1400, 1675 and 1800 lb with tripped transition.It can be seen that <strong>the</strong> fan shaft power i s lessthan 72 HP and <strong>the</strong> <strong>aerodynamic</strong> efficiency indexis over 12.0. This performance yields a 60% speedimprovement, a 33% power gain and a 7.5% grossweight enhancement. lhe schematic layout <strong>of</strong> this2-seat GA configuration is shown in Fig. 16, witha mid-wing arrangement with 0.45 taper ratio and277 in. overall span. The useful fuselage lengthis 110 in. while <strong>the</strong> overall fuselage length is130 in. The empennage is supported by a twin boomand it comorises twin rudders.8
L >I48" I4-Seat Cabin Arrangement - 60" Oia. Fuselage- 110" LFig. 146.7'0.2725.04nUSchematic layout <strong>of</strong> <strong>mini</strong>-RPY configurationTable 5Empty weight W lbGross weight Wo IbWing span B ftWing area A ft'Wing loading W/A2-Seat E4 Aircraft @ 120 MPH(qo = 37.0 PSF)___IBeech Cessna Piper77 152 PA-38-112,kipper ierobat Tomahawk 2PSFLength 2. ftEngine powerMax. cruisespeedWing liftcoeff.AerodynamicefficiencyindexUoCLHPMPHE__1,1031,67530.013012.8824.01151210.3414.70124.724.1 23.11 122 1270.3225.05Note: The above data were derived from AviationWeek & Space Technology, March 12, 1984, p. 144.Fig. 152-Seat Cabin Arrangement - 45" Dia. FuselageCabin arrangement layout for GA aircraftTable 6 45" Diameter (V = 70.6 ft3) E4 Aircraft@ 200 MPH (qo = 104 PSF)(Transition Tripped @ 10% Length)--Gross Weight Wo lb 1400 1 b 675 1 I 800 1 b__ -Wing loading qoCL @ C~=0.3 31.2 31.2 31.2PSFWing area A = Wo/qoCL, ft2 44.8 53.7 57.7Mean wing chord, C ft 2.11 2.31 2.40Wing span, B ft 21.1 23.1 24.0Lift/drag ratio <strong>of</strong> wing,CL/CO @ CL i 0.3038.3 38.3 38.3Drag <strong>of</strong> wing, Fw = Wo/rlbCL0Thrust coeff. for wing CTw36.50.020643.71.024;47.01.0265Total thrust coeff. CTo 0.0256 1.030: 1.0321Fan air power coeff. CHP, 0.0588 1.0651 1.0685Fan flow coeff. CQ,0.0234 1.0241 1.0248Fan flow QCFS 117.1 122.1 124.1Fan pressure-rise2.45 2.66 2.74coef f . C"* 5Fan pressure-rise254.8AH,,PSF276.6 284.9Fan system-resistance0.793 0.794 0.796coeff. m'nFan speed, nRPM 25,777 !6,82! 17,211Fan diameter, d5 in. 7.31 7.31 7.31Fan efficiency, '1~ % 90.1 90.2 90.3Fan shaft powerHP 60.6 68.6 71.6Jet total-head coeff. CHTs 2.5 2.66 2.74Jet velocity ratio U,/Uo 1.37 1.41 1.44Jet static base cp5 0.92 1.10 1.11pressure coeff.Aerodynamic efficiency E 12.1 13.0 13.3index--9
~~~Table 7 lists th'e pertinent parameters <strong>of</strong> fivecurrent 4-seat GA aircraft by Maule, Mooney, Piper,Cessna and Beech, with speed from 196 to 201 MPH,gross weights from 2500 to 3400 lb and enginepowers from 200 to 285 HP. The <strong>aerodynamic</strong> efficiencyindex ranges from 6.5 to 7.9.Table 7 4-Seat 6R Aircraft @ 200 MPH(so = 104 PSF)The cabin dimensions for four seats are typically43 in. width, 48 in. height and 92 in.length; a fuselage diameter <strong>of</strong> 60 in. has beenselected and <strong>the</strong> cabin layout arrangement i s shownin Fig. 15.Table 8 presents <strong>the</strong> performance data for grossweights <strong>of</strong> 2500, 2900 and 3400 lb at 200 MPH withtripped transition. It is seen that for <strong>the</strong> lowestweight <strong>the</strong> fan shaft power is 110, for a gain <strong>of</strong>47%; for <strong>the</strong> middle weight <strong>the</strong> fan power is 120HP, for a gain <strong>of</strong> 40%, while for <strong>the</strong> top weight<strong>the</strong> fan power is 132 HP, for a gain <strong>of</strong> 53%.r - r f l; Schematic 2-Seat GA Aircraft Layout1 Confiouration1675 6 Gross Weight68 HP (Tripped Trans. ILengthEngine powerftHPMax' cruise U, MPHspeedWing liftcoeff.AerodynamicefficiencyindexCLE__2125340033.5181.018.824.4 24.7 27.3 28.6 26.7210.0 200.0 200.0 235.0 285.0196.0 201.0 198.0 199.0 198.00.157 0.148 0.167 0.172 0.1846.49 7.47 7.90 7.22 6.50Fig. 16Schematic layout <strong>of</strong> 2-seat GA aircraftconfigurationGross Weight W, lbWing loading qoCL @ C~=0.3PSFWing area A = Wo/qoCL, ft2Mean wing chord, C ftWing span, 8 ftLift/drag ratio <strong>of</strong> wing,CL/CO @ CL = 0.30Drag <strong>of</strong> wing, Fw = Wo/-lbCLCDThrust coeff. for wing CTwTotal thrust coeff. CTOFan air power coeff. CHP,,Fan flow coeff. CQ,Fan flow QCFSFan pressure-ri secoeff.CH..L DFan pressure-riseAH"./
The <strong>aerodynamic</strong> efficiency index is over 12.0.The schematic layout <strong>of</strong> <strong>the</strong> 4-seat GA configurationis shown in Fig. 17; a high-wing arrangement wasselected with a span <strong>of</strong> 360 in. and a 0.45 taperratio. The useful fuselage length i s 147 in. while<strong>the</strong> overall fuselaoe lenoth i s 174 in. The emDennageis supported -by twin booms and it comprisestwin rudders.ConclusionsIt has been shown that <strong>the</strong> simole addition <strong>of</strong>a conventional NACA wing to <strong>the</strong> tested optimizedsystem comprising axisymmetric body, boundary-layercontrol and stern jet propulsion yields a predictedaircraft perfonnance which is superior to current<strong>mini</strong>-<strong>RPV</strong> and small GA aircraft levels.Schematic Layout4-Seat GA AircraftConfiguration2903 Ib Gross Weight2% MPH Speed120 HP (Tripped Trans. )A 250 lb gross weight <strong>mini</strong>-<strong>RPV</strong> could be flownat 100 Kn with 7.0 HP; a 2-seat 1675 lb GA aircraftcould be flown at 200 MPH with 69 HP, and a 4-seat2900 lb GA aircraft could be flown at 200 MPH with120 HP.The general trend <strong>of</strong> <strong>the</strong> <strong>aerodynamic</strong> efficiencyindex E against <strong>the</strong> thrust coefficient CT is shownin Fig. 18 for both free transition and transitiontripped at 10% length; it can be seen that <strong>the</strong>thrust coefficient should be kept above a value<strong>of</strong> 0.025 in order to achieve <strong>aerodynamic</strong> efficiencyindex values above 12.0. This can be done byadjusting <strong>the</strong> gross weight Wo against <strong>the</strong> fuselagevolume V and <strong>the</strong> speed Uo.Better results can be expected if <strong>the</strong> liftsystem should be integrated, i.e. if <strong>the</strong> fuselagesuction air mass flow should be directed laterallyinto <strong>the</strong> wings to supply jet flaps or circulationcontrolwall-jets. The limitation <strong>the</strong>n would be<strong>the</strong> allowable wing loading and <strong>the</strong> wing's induceddrag, as <strong>the</strong> lift coefficient is substantiallyincreased by <strong>the</strong> jet-flap or by <strong>the</strong> circulationcontrol.The air mass flow would serve three purposes:(a) fuselage boundary-layer control, (b) wing liftenhancement, and (c) propulsion. Also <strong>the</strong> suction'smomentum drag is <strong>mini</strong>mized since only <strong>the</strong>inner boundary-layer flow i s drawn into <strong>the</strong> slotat Sta. 1 (Fig. 5); it is estimated that a 33%drag saving is achieved, as compared to free-streamflow intake, at <strong>the</strong> point <strong>of</strong> equilibrium for <strong>the</strong>body alone. The next step <strong>of</strong> this program is expectedto be <strong>the</strong> wind-tunnel test <strong>of</strong> <strong>the</strong> 20 in.diameter model in <strong>the</strong> arrangement <strong>of</strong> Fig. 14; <strong>the</strong>wing pylon would be installed exactly as <strong>the</strong>present strut. A second step would be <strong>the</strong> investigation<strong>of</strong> <strong>the</strong> optimum fineness ratio; <strong>the</strong> 2.72fineness ratio was selected originally for LTAapplication. A preliminary <strong>the</strong>oretical parametricstudy indicates that <strong>the</strong> optimum should be near6 and that fur<strong>the</strong>r power reduction can be expected.174" I181 Free Transitionand16 - Transition TrippedT aQ 58%\,**--o-C 14 - # .ox-Ea-.$< 12E=-lO-"35u II 8.-gi0- ,2'6--I'2-SeatGAB 123 MPH- I// Mini-<strong>RPV</strong>2 -,'@1WKn 701I I I I0 0.01 0.02 0.03 0.04 0.05Thrust Coefficient CT = T/qoVo'66-_/--/'# s t Transition,*' Tripped B 10%;:LMPH 7Fig. 17Schematic layout <strong>of</strong> 4-seat GA aircraftconfigurationFig. 18 Aerodynamic efficiency index E vsThrust coefficient CT11
~~ --~ ~~,References1. F. R. Goldschmied, "Integrated Hull Design,Boundary-Layer Control and Propulsion <strong>of</strong> SubmergedBodies," AIAA Journal <strong>of</strong> Hydronautics,Vol. 1, No. 1, pp. 1-11 (July 1967).2. F. R. Goldschmied. "Inteorated Hull Oesion.~~~Boundary-Layer Control and Propulsion <strong>of</strong> SubmergedBodies: Wind-Tunnel Verification,"AIAA Paper 82-1204, AIAA/SAE/ASME 18th JointPropulsion Conference, Clevela nd, OH (June1982).3. F. R. Goldschmied, "Wind-Tunnel Demonstration<strong>of</strong> an Optimized LTA System with 65% PowerReduction and Neutral Static Stability," AIAAPaper 83-1981, AIAA Lighter-Than-Air SystemsConference, Anaheim, CA (July 1983).4. F. R. Goldschmied, "Jet-Propulsion <strong>of</strong> SubsonicBodies with Jet Total-Head Equal to Free-Stream's,'' AIAA Paper 83-1790, AIAA AppliedAerodynamics Conference, Danvers, MA (July1983).5. F. R. Goldschmied, "Aerodynamic Integration<strong>of</strong> Ax i symme t ri c Body Pressure- Di s t r i but i on ,Slot-Suction Boundary-Layer Control and SternJet-Propulsion, I1 - Propulsion Evaluation,"AIAA Journal <strong>of</strong> Aircraft (to be published).6. J. S. Parsons, R. E. Goodson and F. R. Goldschmied,"Shaping <strong>of</strong> Axismetric Bodies forMinimum Drag in Incompressible Flow," AIAAJournal <strong>of</strong> Hydronautics, Vol. 8, No. 3, pp.100-107 (July 1974).7. I. H. Abbott, A. E. von Doenh<strong>of</strong>f and L. S.Stivers, Jr., "Sumnary <strong>of</strong> Airfoil Data," NACAReport 824 (1945).8. G. Kovich and R. J. Steinke, "Performance <strong>of</strong>Low-Pressure-Ratio Low-Tip-Speed Fan Stagewith Blade Tip Solidity <strong>of</strong> 0.65," NASA TMX-3341 (February 1976).9. J. A. Koegler, Jr., "A Parametric Wing DesignStudy for a Modern Laminar Flow Wing," NASATM 80154 (December 1979).10. C. 0. Wood and F. R. Goldschmied, "Design andSpecification Guidelines for Large Draft Fan:.and Systems," Electric Power Research instituteReport EPRI CS-3431 (January 1984).11. D. E. Reubush and J. F. Runckel, "Effect 0:Fineness Ratio on Boattail Drag <strong>of</strong> Circular-Arc Afterbodies Having Closure Ratios <strong>of</strong> 0.50with t Exhaust at Mach Numbers up to 1.30,"I3SA ThJ-7192 (May 1973).12. E. E. Larrabee, "Preservation <strong>of</strong> Wing Leading-Edge Suction at <strong>the</strong> Plane <strong>of</strong> !Fetry as aFactor in Wing-Fuselage Design, Proceedings<strong>of</strong> <strong>the</strong> NASA-Industry-University General AviationDrag Reductic? Workshop, J. Roskam, Ed.,University <strong>of</strong> Kansas (July 1975), pp. 107-119.12