

potential-impacts-of-climate-change-on-the-swan-and-canning-rivers
potential-impacts-of-climate-change-on-the-swan-and-canning-rivers
potential-impacts-of-climate-change-on-the-swan-and-canning-rivers

You also want an ePaper? Increase the reach of your titles
YUMPU automatically turns print PDFs into web optimized ePapers that Google loves.
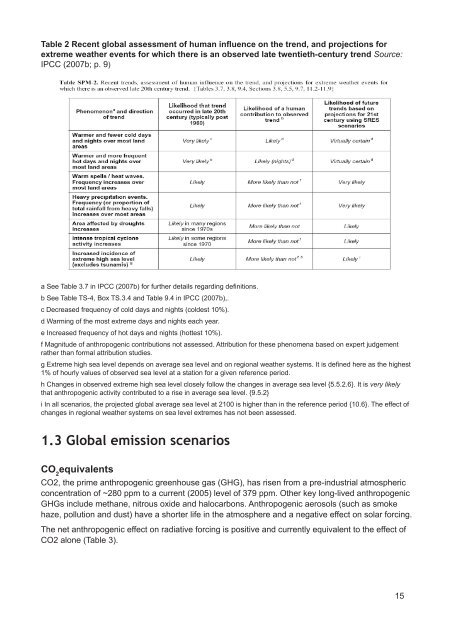
Table 2 Recent global assessment <str<strong>on</strong>g>of</str<strong>on</strong>g> human influence <strong>on</strong> <strong>the</strong> trend, <strong>and</strong> projecti<strong>on</strong>s for<br />
extreme wea<strong>the</strong>r events for which <strong>the</strong>re is an observed late twentieth-century trend Source:<br />
IPCC (2007b; p. 9)<br />
a See Table 3.7 in IPCC (2007b) for fur<strong>the</strong>r details regarding defi niti<strong>on</strong>s.<br />
b See Table TS-4, Box TS.3.4 <strong>and</strong> Table 9.4 in IPCC (2007b),.<br />
c Decreased frequency <str<strong>on</strong>g>of</str<strong>on</strong>g> cold days <strong>and</strong> nights (coldest 10%).<br />
d Warming <str<strong>on</strong>g>of</str<strong>on</strong>g> <strong>the</strong> most extreme days <strong>and</strong> nights each year.<br />
e Increased frequency <str<strong>on</strong>g>of</str<strong>on</strong>g> hot days <strong>and</strong> nights (hottest 10%).<br />
f Magnitude <str<strong>on</strong>g>of</str<strong>on</strong>g> anthropogenic c<strong>on</strong>tributi<strong>on</strong>s not assessed. Attributi<strong>on</strong> for <strong>the</strong>se phenomena based <strong>on</strong> expert judgement<br />
ra<strong>the</strong>r than formal attributi<strong>on</strong> studies.<br />
g Extreme high sea level depends <strong>on</strong> average sea level <strong>and</strong> <strong>on</strong> regi<strong>on</strong>al wea<strong>the</strong>r systems. It is defi ned here as <strong>the</strong> highest<br />
1% <str<strong>on</strong>g>of</str<strong>on</strong>g> hourly values <str<strong>on</strong>g>of</str<strong>on</strong>g> observed sea level at a stati<strong>on</strong> for a given reference period.<br />
h Changes in observed extreme high sea level closely follow <strong>the</strong> <str<strong>on</strong>g>change</str<strong>on</strong>g>s in average sea level {5.5.2.6}. It is very likely<br />
that anthropogenic activity c<strong>on</strong>tributed to a rise in average sea level. {9.5.2}<br />
i In all scenarios, <strong>the</strong> projected global average sea level at 2100 is higher than in <strong>the</strong> reference period {10.6}. The effect <str<strong>on</strong>g>of</str<strong>on</strong>g><br />
<str<strong>on</strong>g>change</str<strong>on</strong>g>s in regi<strong>on</strong>al wea<strong>the</strong>r systems <strong>on</strong> sea level extremes has not been assessed.<br />
1.3 Global emissi<strong>on</strong> scenarios<br />
CO 2<br />
equivalents<br />
CO2, <strong>the</strong> prime anthropogenic greenhouse gas (GHG), has risen from a pre-industrial atmospheric<br />
c<strong>on</strong>centrati<strong>on</strong> <str<strong>on</strong>g>of</str<strong>on</strong>g> ~280 ppm to a current (2005) level <str<strong>on</strong>g>of</str<strong>on</strong>g> 379 ppm. O<strong>the</strong>r key l<strong>on</strong>g-lived anthropogenic<br />
GHGs include methane, nitrous oxide <strong>and</strong> halocarb<strong>on</strong>s. Anthropogenic aerosols (such as smoke<br />
haze, polluti<strong>on</strong> <strong>and</strong> dust) have a shorter life in <strong>the</strong> atmosphere <strong>and</strong> a negative effect <strong>on</strong> solar forcing.<br />
The net anthropogenic effect <strong>on</strong> radiative forcing is positive <strong>and</strong> currently equivalent to <strong>the</strong> effect <str<strong>on</strong>g>of</str<strong>on</strong>g><br />
CO2 al<strong>on</strong>e (Table 3).<br />
15