

potential-impacts-of-climate-change-on-the-swan-and-canning-rivers
potential-impacts-of-climate-change-on-the-swan-and-canning-rivers
potential-impacts-of-climate-change-on-the-swan-and-canning-rivers

You also want an ePaper? Increase the reach of your titles
YUMPU automatically turns print PDFs into web optimized ePapers that Google loves.
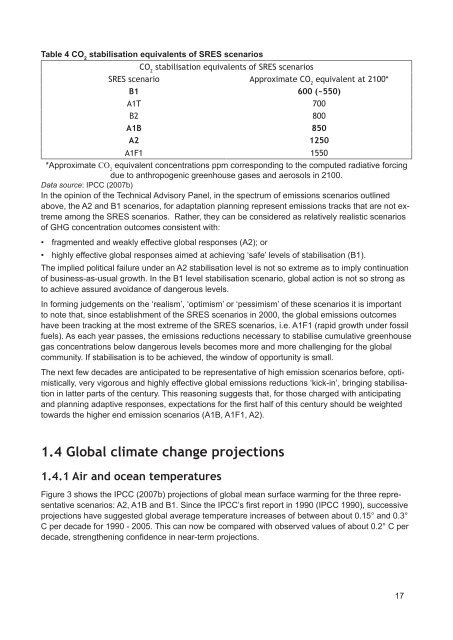
Table 4 CO 2<br />
stabilisati<strong>on</strong> equivalents <str<strong>on</strong>g>of</str<strong>on</strong>g> SRES scenarios<br />
CO 2<br />
stabilisati<strong>on</strong> equivalents <str<strong>on</strong>g>of</str<strong>on</strong>g> SRES scenarios<br />
SRES scenario Approximate CO 2<br />
equivalent at 2100*<br />
B1 600 (~550)<br />
A1T 700<br />
B2 800<br />
A1B 850<br />
A2 1250<br />
A1F1 1550<br />
*Approximate CO 2<br />
equivalent c<strong>on</strong>centrati<strong>on</strong>s ppm corresp<strong>on</strong>ding to <strong>the</strong> computed radiative forcing<br />
due to anthropogenic greenhouse gases <strong>and</strong> aerosols in 2100.<br />
Data source: IPCC (2007b)<br />
In <strong>the</strong> opini<strong>on</strong> <str<strong>on</strong>g>of</str<strong>on</strong>g> <strong>the</strong> Technical Advisory Panel, in <strong>the</strong> spectrum <str<strong>on</strong>g>of</str<strong>on</strong>g> emissi<strong>on</strong>s scenarios outlined<br />
above, <strong>the</strong> A2 <strong>and</strong> B1 scenarios, for adaptati<strong>on</strong> planning represent emissi<strong>on</strong>s tracks that are not extreme<br />
am<strong>on</strong>g <strong>the</strong> SRES scenarios. Ra<strong>the</strong>r, <strong>the</strong>y can be c<strong>on</strong>sidered as relatively realistic scenarios<br />
<str<strong>on</strong>g>of</str<strong>on</strong>g> GHG c<strong>on</strong>centrati<strong>on</strong> outcomes c<strong>on</strong>sistent with:<br />
• fragmented <strong>and</strong> weakly effective global resp<strong>on</strong>ses (A2); or<br />
• highly effective global resp<strong>on</strong>ses aimed at achieving ‘safe’ levels <str<strong>on</strong>g>of</str<strong>on</strong>g> stabilisati<strong>on</strong> (B1).<br />
The implied political failure under an A2 stabilisati<strong>on</strong> level is not so extreme as to imply c<strong>on</strong>tinuati<strong>on</strong><br />
<str<strong>on</strong>g>of</str<strong>on</strong>g> business-as-usual growth. In <strong>the</strong> B1 level stabilisati<strong>on</strong> scenario, global acti<strong>on</strong> is not so str<strong>on</strong>g as<br />
to achieve assured avoidance <str<strong>on</strong>g>of</str<strong>on</strong>g> dangerous levels.<br />
In forming judgements <strong>on</strong> <strong>the</strong> ‘realism’, ‘optimism’ or ‘pessimism’ <str<strong>on</strong>g>of</str<strong>on</strong>g> <strong>the</strong>se scenarios it is important<br />
to note that, since establishment <str<strong>on</strong>g>of</str<strong>on</strong>g> <strong>the</strong> SRES scenarios in 2000, <strong>the</strong> global emissi<strong>on</strong>s outcomes<br />
have been tracking at <strong>the</strong> most extreme <str<strong>on</strong>g>of</str<strong>on</strong>g> <strong>the</strong> SRES scenarios, i.e. A1F1 (rapid growth under fossil<br />
fuels). As each year passes, <strong>the</strong> emissi<strong>on</strong>s reducti<strong>on</strong>s necessary to stabilise cumulative greenhouse<br />
gas c<strong>on</strong>centrati<strong>on</strong>s below dangerous levels becomes more <strong>and</strong> more challenging for <strong>the</strong> global<br />
community. If stabilisati<strong>on</strong> is to be achieved, <strong>the</strong> window <str<strong>on</strong>g>of</str<strong>on</strong>g> opportunity is small.<br />
The next few decades are anticipated to be representative <str<strong>on</strong>g>of</str<strong>on</strong>g> high emissi<strong>on</strong> scenarios before, optimistically,<br />
very vigorous <strong>and</strong> highly effective global emissi<strong>on</strong>s reducti<strong>on</strong>s ‘kick-in’, bringing stabilisati<strong>on</strong><br />
in latter parts <str<strong>on</strong>g>of</str<strong>on</strong>g> <strong>the</strong> century. This reas<strong>on</strong>ing suggests that, for those charged with anticipating<br />
<strong>and</strong> planning adaptive resp<strong>on</strong>ses, expectati<strong>on</strong>s for <strong>the</strong> fi rst half <str<strong>on</strong>g>of</str<strong>on</strong>g> this century should be weighted<br />
towards <strong>the</strong> higher end emissi<strong>on</strong> scenarios (A1B, A1F1, A2).<br />
1.4 Global <str<strong>on</strong>g>climate</str<strong>on</strong>g> <str<strong>on</strong>g>change</str<strong>on</strong>g> projecti<strong>on</strong>s<br />
1.4.1 Air <strong>and</strong> ocean temperatures<br />
Figure 3 shows <strong>the</strong> IPCC (2007b) projecti<strong>on</strong>s <str<strong>on</strong>g>of</str<strong>on</strong>g> global mean surface warming for <strong>the</strong> three representative<br />
scenarios: A2, A1B <strong>and</strong> B1. Since <strong>the</strong> IPCC’s fi rst report in 1990 (IPCC 1990), successive<br />
projecti<strong>on</strong>s have suggested global average temperature increases <str<strong>on</strong>g>of</str<strong>on</strong>g> between about 0.15° <strong>and</strong> 0.3°<br />
C per decade for 1990 - 2005. This can now be compared with observed values <str<strong>on</strong>g>of</str<strong>on</strong>g> about 0.2° C per<br />
decade, streng<strong>the</strong>ning c<strong>on</strong>fi dence in near-term projecti<strong>on</strong>s.<br />
17