

potential-impacts-of-climate-change-on-the-swan-and-canning-rivers
potential-impacts-of-climate-change-on-the-swan-and-canning-rivers
potential-impacts-of-climate-change-on-the-swan-and-canning-rivers

Create successful ePaper yourself
Turn your PDF publications into a flip-book with our unique Google optimized e-Paper software.
Figure 9 Time series <str<strong>on</strong>g>of</str<strong>on</strong>g> Fremantle sea level anomaly with <strong>the</strong> linear trend removed The red line<br />
shows <strong>the</strong> interannual variability in <strong>the</strong> record obtained by running a 19 year Hanning window to<br />
remove <strong>the</strong> l<strong>on</strong>g-term tidal effects Source: Elliot <strong>and</strong> Pattiaratchi (in preparati<strong>on</strong>)<br />
1.5.5 Seas<strong>on</strong>al total rainfall<br />
A steep decrease in autumn/winter rainfall occurred in <strong>the</strong> early 1970s throughout <strong>the</strong> regi<strong>on</strong>, accompanied<br />
by a slight increase in spring <strong>and</strong> summer. These <str<strong>on</strong>g>change</str<strong>on</strong>g>s have been described in detail<br />
in reports <strong>and</strong> bulletins <str<strong>on</strong>g>of</str<strong>on</strong>g> IOCI <strong>and</strong> are illustrated in Figure 10. The <str<strong>on</strong>g>change</str<strong>on</strong>g>s are associated with<br />
<str<strong>on</strong>g>change</str<strong>on</strong>g>s in cyclogensis (see secti<strong>on</strong> 1.4.3).<br />
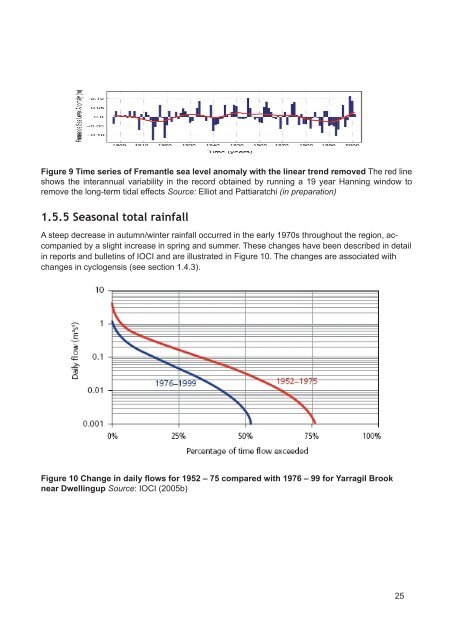
Figure 10 Change in daily flows for 1952 – 75 compared with 1976 – 99 for Yarragil Brook<br />
near Dwellingup Source: IOCI (2005b)<br />
25