- Page 1 and 2: Analytical reference materials, sta
- Page 3 and 4: Introduction
- Page 5 and 6: Content Content Introduction Introd
- Page 7 and 8: Content Solid fuels 246 Cement 251
- Page 9 and 10: Content Multielement standards and
- Page 11 and 12: Content EPA 500 Methods 715 EPA 600
- Page 13 and 14: Introduction Introduction About LGC
- Page 15 and 16: Introduction ULTRA Scientific ULTRA
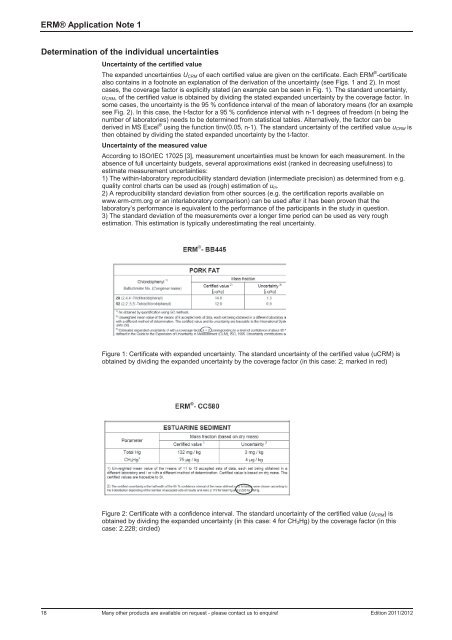
- Page 17 and 18: Introduction About proficiency test
- Page 19: ERM® Application Notes ERM ® Appl
- Page 23 and 24: ERM® Application Note 3 A STRATEGY
- Page 25 and 26: ERM® Application Note 6 In earlier
- Page 27 and 28: Matrix reference materials
- Page 29 and 30: Environmental matrix reference mate
- Page 31 and 32: Waters Code Product Unit New NIST-1
- Page 33 and 34: Waters Code Product Unit NWONTARIO-
- Page 35 and 36: Waters Code Product Unit New NWTM-2
- Page 37 and 38: Waters Code Product Unit New NIM-GB
- Page 39 and 40: Waters Code Product Unit RTC-QCI-03
- Page 41 and 42: Waters Code Product Unit RTC-QCI-03
- Page 43 and 44: Sediments Code Product Unit NIST-19
- Page 45 and 46: Sediments Code Product Unit RTC-CNS
- Page 47 and 48: Sediments Code Product Unit NCS DC7
- Page 49 and 50: Sediments Code Product Unit NCS DC7
- Page 51 and 52: Sediments Code Product Unit NCS DC7
- Page 53 and 54: Sediments Code Product Unit BCR-536
- Page 55 and 56: Sediments Code Product Unit CAN-STS
- Page 57 and 58: Sediments Code Product Unit RTC-CRM
- Page 59 and 60: Sediments Code Product Unit NIST-16
- Page 61 and 62: Sediments Code Product Unit NRCHIPA
- Page 63 and 64: Soils Code Product Unit New WEPAL-S
- Page 65 and 66: Soils Code Product Unit IRMM-443-7
- Page 67 and 68: Soils Code Product Unit New NIM-GBW
- Page 69 and 70: Soils Code Product Unit New NIM-GBW
- Page 71 and 72:
Soils Code Product Unit New NIM-GBW
- Page 73 and 74:
Soils Code Product Unit NIM-GBW0741
- Page 75 and 76:
Soils Code Product Unit New NIM-GBW
- Page 77 and 78:
Soils Code Product Unit New NIM-GBW
- Page 79 and 80:
Soils Code Product Unit CIL-EDF-518
- Page 81 and 82:
Soils Code Product Unit LGCQC3006 S
- Page 83 and 84:
Soils Code Product Unit ERM-CC008 S
- Page 85 and 86:
Soils Code Product Unit New RTC-CRM
- Page 87 and 88:
Soils Code Product Unit New RTC-CRM
- Page 89 and 90:
Soils Code Product Unit RTC-CRM359-
- Page 91 and 92:
Soils Code Product Unit RTC-CRM627-
- Page 93 and 94:
Soils Code Product Unit RTC-CRM111-
- Page 95 and 96:
Soils Code Product Unit New RTC-CRM
- Page 97 and 98:
Soils Code Product Unit RTC-CRM136-
- Page 99 and 100:
Soils Code Product Unit New RTC-CRM
- Page 101 and 102:
Soils Code Product Unit RTC-CRM813-
- Page 103 and 104:
Soils Code Product Unit RTC-CRM024-
- Page 105 and 106:
Soils Code Product Unit New RTC-CRM
- Page 107 and 108:
Soils Code Product Unit New RTC-CRM
- Page 109 and 110:
Soils Code Product Unit New RTC-CRM
- Page 111 and 112:
Soils Code Product Unit New METRANA
- Page 113 and 114:
Sewage sludges Sewage sludges Code
- Page 115 and 116:
Sewage sludges Code Product Unit RT
- Page 117 and 118:
Plants Plants Code Product Unit Tre
- Page 119 and 120:
Plants Code Product Unit Grasses an
- Page 121 and 122:
Plants Code Product Unit NIST-RM 84
- Page 123 and 124:
Plants Code Product Unit New WEPAL-
- Page 125 and 126:
Plants Code Product Unit New WEPAL-
- Page 127 and 128:
Ash, particulate and dust Code Prod
- Page 129 and 130:
Ash, particulate and dust Code Prod
- Page 131 and 132:
Ash, particulate and dust Code Prod
- Page 133 and 134:
Ash, particulate and dust Code Prod
- Page 135 and 136:
Filter media Code Product Unit NAMI
- Page 137 and 138:
Food matrix reference materials Cod
- Page 139 and 140:
Milk and milk products Code Product
- Page 141 and 142:
MUVA reference materials MUVA refer
- Page 143 and 144:
MUVA reference materials Code Produ
- Page 145 and 146:
Meat and meat products Code Product
- Page 147 and 148:
Meat and meat products Code Product
- Page 149 and 150:
Meat and meat products Code Product
- Page 151 and 152:
Fish and fish products Code Product
- Page 153 and 154:
Fish and fish products Code Product
- Page 155 and 156:
Fish and fish products Code Product
- Page 157 and 158:
Fish and fish products Code Product
- Page 159 and 160:
Fish and fish products Code Product
- Page 161 and 162:
Fish and fish products Code Product
- Page 163 and 164:
Cereals and genetically modified cr
- Page 165 and 166:
Cereals and genetically modified cr
- Page 167 and 168:
Cereals and genetically modified cr
- Page 169 and 170:
Cereals and genetically modified cr
- Page 171 and 172:
Cereals and genetically modified cr
- Page 173 and 174:
Vegetable matter Code Product Unit
- Page 175 and 176:
Vegetable matter Code Product Unit
- Page 177 and 178:
Vegetable matter Code Product Unit
- Page 179 and 180:
Vegetable matter Code Product Unit
- Page 181 and 182:
Food Authenticity Code Product Unit
- Page 183 and 184:
Food and drink products Code Produc
- Page 185 and 186:
Food and drink products Code Produc
- Page 187 and 188:
Food and drink products Code Produc
- Page 189 and 190:
Food and drink products Code Produc
- Page 191 and 192:
Animal food products Animal food pr
- Page 193 and 194:
Purified genomic DNA (gDNA) Code Pr
- Page 195 and 196:
Certified materials for microbiolog
- Page 197 and 198:
DR CALUX® TEQ reference materials
- Page 199 and 200:
Industrial reference materials
- Page 201 and 202:
The use of reference materials Refe
- Page 203 and 204:
Industrial reference materials Indu
- Page 205 and 206:
Rocks, ceramic materials and minera
- Page 207 and 208:
Rocks, ceramic materials and minera
- Page 209 and 210:
Rocks, ceramic materials and minera
- Page 211 and 212:
Rocks, ceramic materials and minera
- Page 213 and 214:
Rocks, ceramic materials and minera
- Page 215 and 216:
Rocks, ceramic materials and minera
- Page 217 and 218:
Rocks, ceramic materials and minera
- Page 219 and 220:
Clays Code Product Unit BAS-BCS-CRM
- Page 221 and 222:
Petrochemical standards Code Produc
- Page 223 and 224:
Petrochemical standards Code Produc
- Page 225 and 226:
Petrochemical standards Code Produc
- Page 227 and 228:
Petrochemical standards Code Produc
- Page 229 and 230:
Petrochemical standards Code Produc
- Page 231 and 232:
Petrochemical standards Code Produc
- Page 233 and 234:
Petrochemical standards Code Produc
- Page 235 and 236:
Petrochemical standards Code Produc
- Page 237 and 238:
Biodiesel standards Code Product Un
- Page 239 and 240:
Biodiesel standards Code Product Un
- Page 241 and 242:
ASTM Methods for petrochemical anal
- Page 243 and 244:
ASTM Methods for petrochemical anal
- Page 245 and 246:
ASTM Methods for petrochemical anal
- Page 247 and 248:
ASTM Methods for petrochemical anal
- Page 249 and 250:
Solid fuels Code Product Unit NCS F
- Page 251 and 252:
Solid fuels Code Product Unit NCS F
- Page 253 and 254:
Cement Code Product Unit NJV 94-3 N
- Page 255 and 256:
Glass and ceramics Code Product Uni
- Page 257 and 258:
Glass and ceramics Code Product Uni
- Page 259 and 260:
Glass and ceramics Code Product Uni
- Page 261 and 262:
Plastics Code Product Unit BCR-712
- Page 263 and 264:
Plastics Code Product Unit JSAC 065
- Page 265 and 266:
Paint and industrial sludges Code P
- Page 267 and 268:
Miscellaneous Code Product Unit BAS
- Page 269 and 270:
Miscellaneous matrix reference mate
- Page 271:
Customised standards and CERTAN ®
- Page 274 and 275:
CERTAN® - The ampoule in the bottl
- Page 276 and 277:
eVol® hand-held automated analytic
- Page 278 and 279:
SOLVENT CONTAINER & QUANTITY CERTAN
- Page 280 and 281:
® Y
- Page 282 and 283:
eVol® hand-held automated analytic
- Page 284 and 285:
in partnership with Genuine ATCC ®
- Page 286 and 287:
Natural products and food constitue
- Page 288 and 289:
Natural products and food constitue
- Page 290 and 291:
Natural products and food constitue
- Page 292 and 293:
Natural products and food constitue
- Page 294 and 295:
Natural products and food constitue
- Page 296 and 297:
Natural products and food constitue
- Page 298 and 299:
Natural products and food constitue
- Page 300 and 301:
Natural products and food constitue
- Page 302 and 303:
Amino acids Amino acids Code Produc
- Page 304 and 305:
Food additives Code Product Unit IP
- Page 306 and 307:
Mycotoxins Code Product Unit B-MYC0
- Page 308 and 309:
Mycotoxins Code Product Unit New B-
- Page 310 and 311:
Mycotoxins Code Product Unit Mycoto
- Page 312 and 313:
Shellfish toxins Code Product Unit
- Page 314 and 315:
Miscellaneous food related standard
- Page 316 and 317:
HPLC COSMOSIL columns from Nacalai
- Page 318 and 319:
Pesticides Code Product Unit FL-333
- Page 320 and 321:
Pesticides Code Product Unit New U-
- Page 322 and 323:
Pesticides Code Product Unit New U-
- Page 324 and 325:
Pesticides Code Product Unit FL-453
- Page 326 and 327:
Pesticides Code Product Unit FL-367
- Page 328 and 329:
Pesticides Code Product Unit New U-
- Page 330 and 331:
Pesticides Code Product Unit FL-354
- Page 332 and 333:
Pesticides Code Product Unit New U-
- Page 334 and 335:
Pesticides Code Product Unit CIL-CL
- Page 336 and 337:
Pesticides Code Product Unit U-PS-1
- Page 338 and 339:
Pesticides Code Product Unit NMIAP1
- Page 340 and 341:
Pesticides Code Product Unit FL-359
- Page 342 and 343:
Pesticides Code Product Unit New U-
- Page 344 and 345:
Pesticides Code Product Unit New U-
- Page 346 and 347:
Pesticides Code Product Unit IPO 29
- Page 348 and 349:
Pesticides Code Product Unit New U-
- Page 350 and 351:
Pesticides Code Product Unit U-EPA-
- Page 352 and 353:
Pesticides Code Product Unit FL-361
- Page 354 and 355:
Pesticides Code Product Unit IPO 52
- Page 356 and 357:
Pesticides Code Product Unit New U-
- Page 358 and 359:
Pesticides Code Product Unit FL-315
- Page 360 and 361:
Pesticides Code Product Unit FL-365
- Page 362 and 363:
Pesticides Code Product Unit New U-
- Page 364 and 365:
Pesticides Code Product Unit U-PP-2
- Page 366 and 367:
Pesticides Code Product Unit FL-359
- Page 368 and 369:
Pesticides Code Product Unit U-PPM-
- Page 370 and 371:
Pesticides Code Product Unit NE-USL
- Page 372 and 373:
Camphechlor (Toxaphene) congeners C
- Page 374 and 375:
Camphechlor (Toxaphene) congeners C
- Page 376 and 377:
Camphechlor (Toxaphene) congeners C
- Page 378 and 379:
Camphechlor (Toxaphene) congeners C
- Page 380 and 381:
Polyhalogenated compounds Polyhalog
- Page 382 and 383:
Polychloro-n-alkanes References 1.
- Page 384 and 385:
Polychlorinated biphenyls (PCBs) Co
- Page 386 and 387:
Polychlorinated biphenyls (PCBs) Co
- Page 388 and 389:
Polychlorinated biphenyls (PCBs) Co
- Page 390 and 391:
Polychlorinated biphenyls (PCBs) Co
- Page 392 and 393:
Polychlorinated biphenyls (PCBs) Co
- Page 394 and 395:
Polychlorinated biphenyls (PCBs) Co
- Page 396 and 397:
Polychlorinated biphenyls (PCBs) Co
- Page 398 and 399:
Polychlorinated biphenyls (PCBs) Co
- Page 400 and 401:
Polychlorinated biphenyls (PCBs) Co
- Page 402 and 403:
Polychlorinated biphenyls (PCBs) Co
- Page 404 and 405:
Polychlorinated biphenyls (PCBs) Co
- Page 406 and 407:
Polychlorinated biphenyls (PCBs) Co
- Page 408 and 409:
Polychlorinated naphthalenes Polych
- Page 410 and 411:
Polychlorinated benzenes Code Produ
- Page 412 and 413:
Chlorinated dibenzo-p-dioxins and c
- Page 414 and 415:
Chlorinated dibenzo-p-dioxins and c
- Page 416 and 417:
Chlorinated dibenzo-p-dioxins and c
- Page 418 and 419:
Perfluorinated compounds Code Produ
- Page 420 and 421:
BTEX mixtures Code Product Unit U-S
- Page 422 and 423:
BTEX mixtures Code Product Unit New
- Page 424 and 425:
Polycyclic aromatic compounds Code
- Page 426 and 427:
Polycyclic aromatic compounds Code
- Page 428 and 429:
Polycyclic aromatic compounds Code
- Page 430 and 431:
Polycyclic aromatic compounds Code
- Page 432 and 433:
Polycyclic aromatic compounds Code
- Page 434 and 435:
Polycyclic aromatic compounds Code
- Page 436 and 437:
Standards for the analysis of the m
- Page 438 and 439:
Weathered hydrocarbon fuel standard
- Page 440 and 441:
Veterinary medicines and pharmaceut
- Page 442 and 443:
Veterinary medicines and pharmaceut
- Page 444 and 445:
Veterinary medicines and pharmaceut
- Page 446 and 447:
Veterinary medicines and pharmaceut
- Page 448 and 449:
Veterinary medicines and pharmaceut
- Page 450 and 451:
Miscellaneous organic compounds Mis
- Page 452 and 453:
Volatile analyte mixtures Code Prod
- Page 454 and 455:
Volatile analyte mixtures Code Prod
- Page 456 and 457:
Volatile analyte mixtures Code Prod
- Page 458 and 459:
Volatile analyte mixtures Code Prod
- Page 460 and 461:
Semi-volatile analyte mixtures Code
- Page 462 and 463:
Semi-volatile analyte mixtures Code
- Page 464 and 465:
Explosives and their degradation pr
- Page 466 and 467:
Explosives and their degradation pr
- Page 468 and 469:
ULTRAkits® ULTRAkits ® Kits for q
- Page 470 and 471:
ULTRAkits® Code Product Unit U-WRK
- Page 472 and 473:
ULTRAkits® Code Product Unit U-WRK
- Page 474 and 475:
Miscellaneous individual analytes C
- Page 476 and 477:
Miscellaneous individual analytes C
- Page 478 and 479:
Miscellaneous individual analytes C
- Page 480 and 481:
Miscellaneous individual analytes C
- Page 482 and 483:
Miscellaneous individual analytes C
- Page 484 and 485:
Miscellaneous individual analytes C
- Page 486 and 487:
Miscellaneous individual analytes C
- Page 488 and 489:
Miscellaneous individual analytes C
- Page 490 and 491:
Miscellaneous individual analytes C
- Page 492 and 493:
Miscellaneous individual analytes C
- Page 494 and 495:
Miscellaneous individual analytes C
- Page 496 and 497:
Miscellaneous individual analytes C
- Page 498 and 499:
Miscellaneous individual analytes C
- Page 500 and 501:
Miscellaneous individual analytes C
- Page 502 and 503:
ULTRA QuEChTM Standards ULTRA QuECh
- Page 504 and 505:
Organotin compounds Code Product Un
- Page 506 and 507:
Aldehydes / Ketones-DNPH standards
- Page 508 and 509:
Cyanobacterial toxins Code Product
- Page 510 and 511:
Standards for the determination of
- Page 512 and 513:
Single element standards for ICP Si
- Page 514 and 515:
Single element standards for ICP Co
- Page 516 and 517:
Single element standards for ICP Co
- Page 518 and 519:
Single element standards for ICP Co
- Page 520 and 521:
Single element standards for ICP Co
- Page 522 and 523:
Single element standards for ICP Co
- Page 524 and 525:
ULTRA Scientific's EnviroConcentrat
- Page 526 and 527:
ULTRAgrade® single element standar
- Page 528 and 529:
ULTRAgrade® single element standar
- Page 530 and 531:
ULTRA Scientific's EnviroConcentrat
- Page 532 and 533:
ULTRAgrade® multi-element standard
- Page 534 and 535:
ULTRAgrade® multi-element standard
- Page 536 and 537:
Further multielement standards and
- Page 538 and 539:
Further multielement standards and
- Page 540 and 541:
High purity acids High purity acids
- Page 542 and 543:
Ion chromatography standards Code P
- Page 544 and 545:
Wet chemistry standards Code Produc
- Page 546 and 547:
Stable isotope labelled standards f
- Page 548 and 549:
Environmental contaminant standards
- Page 550 and 551:
Environmental contaminant standards
- Page 552 and 553:
Dioxin and furan individual standar
- Page 554 and 555:
Dioxin and furan individual standar
- Page 556 and 557:
Comprehensive unlabelled chlorodiox
- Page 558 and 559:
Comprehensive unlabelled chlorodiox
- Page 560 and 561:
Comprehensive unlabelled chlorodiox
- Page 562 and 563:
Dioxin & furan method standards, st
- Page 564 and 565:
Dioxin & furan method standards, st
- Page 566 and 567:
Dioxin & furan method standards, st
- Page 568 and 569:
Dioxin & furan method standards, st
- Page 570 and 571:
Dioxin & furan method standards, st
- Page 572 and 573:
Dioxin & furan method standards, st
- Page 574 and 575:
Dioxin & furan method standards, st
- Page 576 and 577:
Dioxin & furan method standards, st
- Page 578 and 579:
Dioxin & furan method standards, st
- Page 580 and 581:
Dioxin & furan method standards, st
- Page 582 and 583:
Dioxin & furan method standards, st
- Page 584 and 585:
Dioxin & furan method standards, st
- Page 586 and 587:
Dioxin & furan method standards, st
- Page 588 and 589:
Dioxin & furan method standards, st
- Page 590 and 591:
Dioxin & furan method standards, st
- Page 592 and 593:
Dioxin & furan method standards, st
- Page 594 and 595:
Dioxin & furan method standards, st
- Page 596 and 597:
Dioxin & furan method standards, st
- Page 598 and 599:
PCB standards and standard mixtures
- Page 600 and 601:
PCB standards and standard mixtures
- Page 602 and 603:
PCB standards and standard mixtures
- Page 604 and 605:
PCB standards and standard mixtures
- Page 606 and 607:
PCB standards and standard mixtures
- Page 608 and 609:
PCB standards and standard mixtures
- Page 610 and 611:
PCB standards and standard mixtures
- Page 612 and 613:
PCB standards and standard mixtures
- Page 614 and 615:
PCB standards and standard mixtures
- Page 616 and 617:
PCB standards and standard mixtures
- Page 618 and 619:
PCB standards and standard mixtures
- Page 620 and 621:
PCB standards and standard mixtures
- Page 622 and 623:
PCB standards and standard mixtures
- Page 624 and 625:
PCB standards and standard mixtures
- Page 626 and 627:
PCB standards and standard mixtures
- Page 628 and 629:
PCB standards and standard mixtures
- Page 630 and 631:
PCB standards and standard mixtures
- Page 632 and 633:
PCB standards and standard mixtures
- Page 634 and 635:
PCB standards and standard mixtures
- Page 636 and 637:
PCB standards and standard mixtures
- Page 638 and 639:
PCB standards and standard mixtures
- Page 640 and 641:
Isotope labelled brominated dipheny
- Page 642 and 643:
Isotope labelled brominated dipheny
- Page 644 and 645:
RoHS standards RoHS standards From
- Page 646 and 647:
RoHS standards Code Product Unit CI
- Page 648 and 649:
RoHS standards Code Product Unit CI
- Page 650 and 651:
RoHS standards Code Product Unit Ne
- Page 652 and 653:
Polycyclic aromatic hydrocarbons (P
- Page 654 and 655:
Polycyclic aromatic hydrocarbons (P
- Page 656 and 657:
Substituted benzothiophenes Code Pr
- Page 658 and 659:
Priority pollutant standard mixture
- Page 660 and 661:
Priority pollutant standard mixture
- Page 662 and 663:
Priority pollutants, endocrine disr
- Page 664 and 665:
Priority pollutants, endocrine disr
- Page 666 and 667:
Priority pollutants, endocrine disr
- Page 668 and 669:
Priority pollutants, endocrine disr
- Page 670 and 671:
Priority pollutants, endocrine disr
- Page 672 and 673:
Priority pollutants, endocrine disr
- Page 674 and 675:
Priority pollutants, endocrine disr
- Page 676 and 677:
Priority pollutants, endocrine disr
- Page 678 and 679:
Priority pollutants, endocrine disr
- Page 680 and 681:
Priority pollutants, endocrine disr
- Page 682 and 683:
Priority pollutants, endocrine disr
- Page 684 and 685:
Pesticide and chemical weapon stand
- Page 686 and 687:
Pesticide and chemical weapon stand
- Page 688 and 689:
Pesticide and chemical weapon stand
- Page 690 and 691:
Pesticide and chemical weapon stand
- Page 692 and 693:
Pesticide and chemical weapon stand
- Page 694 and 695:
Pesticide and chemical weapon stand
- Page 696 and 697:
Pesticide and chemical weapon stand
- Page 698 and 699:
Pesticide and chemical weapon stand
- Page 700 and 701:
Pesticide and chemical weapon stand
- Page 702 and 703:
Pesticide and chemical weapon stand
- Page 704 and 705:
Pesticide and chemical weapon stand
- Page 706 and 707:
Environmental standards from ULTRA
- Page 708 and 709:
ULTRAcheck® blind, quality control
- Page 710 and 711:
ULTRAcheck® blind, quality control
- Page 712 and 713:
ULTRAcheck® blind, quality control
- Page 714 and 715:
ULTRAcheck® blind, quality control
- Page 716 and 717:
ULTRAcheck® blind, quality control
- Page 718 and 719:
EPA 500 Methods Code Product Unit U
- Page 720 and 721:
EPA 500 Methods Code Product Unit U
- Page 722 and 723:
EPA 500 Methods Code Product Unit U
- Page 724 and 725:
EPA 500 Methods Code Product Unit U
- Page 726 and 727:
EPA 500 Methods Code Product Unit U
- Page 728 and 729:
EPA 500 Methods Code Product Unit N
- Page 730 and 731:
EPA 500 Methods Code Product Unit U
- Page 732 and 733:
EPA 500 Methods Code Product Unit U
- Page 734 and 735:
EPA 500 Methods Code Product Unit U
- Page 736 and 737:
EPA 500 Methods Code Product Unit U
- Page 738 and 739:
EPA 500 Methods Code Product Unit U
- Page 740 and 741:
EPA 500 Methods Code Product Unit U
- Page 742 and 743:
EPA 500 Methods Code Product Unit E
- Page 744 and 745:
EPA 600 Methods Code Product Unit U
- Page 746 and 747:
EPA 600 Methods Code Product Unit U
- Page 748 and 749:
EPA 600 Methods Code Product Unit E
- Page 750 and 751:
EPA 600 Methods Code Product Unit E
- Page 752 and 753:
EPA 600 Methods Code Product Unit U
- Page 754 and 755:
EPA 600 Methods Code Product Unit E
- Page 756 and 757:
EPA 600 Methods Code Product Unit U
- Page 758 and 759:
EPA 600 Methods Code Product Unit U
- Page 760 and 761:
EPA 600 Methods Code Product Unit U
- Page 762 and 763:
EPA 600 Methods Code Product Unit U
- Page 764 and 765:
EPA 600 Methods Code Product Unit E
- Page 766 and 767:
EPA 8000 Methods Code Product Unit
- Page 768 and 769:
EPA 8000 Methods Code Product Unit
- Page 770 and 771:
EPA 8000 Methods Code Product Unit
- Page 772 and 773:
EPA 8000 Methods Code Product Unit
- Page 774 and 775:
EPA 8000 Methods Code Product Unit
- Page 776 and 777:
EPA 8000 Methods Code Product Unit
- Page 778 and 779:
EPA 8000 Methods Code Product Unit
- Page 780 and 781:
EPA 8000 Methods Code Product Unit
- Page 782 and 783:
EPA 8000 Methods Code Product Unit
- Page 784 and 785:
EPA 8000 Methods Code Product Unit
- Page 786 and 787:
EPA 8000 Methods Code Product Unit
- Page 788 and 789:
EPA 8000 Methods Code Product Unit
- Page 790 and 791:
EPA 8000 Methods Code Product Unit
- Page 792 and 793:
EPA 8000 Methods Code Product Unit
- Page 794 and 795:
EPA 8000 Methods Code Product Unit
- Page 796 and 797:
EPA 8000 Methods Code Product Unit
- Page 798 and 799:
EPA 8000 Methods Code Product Unit
- Page 800 and 801:
Combustion element analyser standar
- Page 802 and 803:
Combustion element analyser standar
- Page 804 and 805:
Combustion element analyser standar
- Page 806 and 807:
Combustion element analyser standar
- Page 808 and 809:
Elemental combustion analyzer reage
- Page 811 and 812:
Elemental analysis Elemental analys
- Page 813 and 814:
Pure substances Pure substances Cod
- Page 815 and 816:
Isotopes Isotopes Code Product Unit
- Page 817 and 818:
Isotopes Code Product Unit ERM-AE10
- Page 819 and 820:
High purity inorganic chemicals Hig
- Page 821 and 822:
High purity inorganic chemicals Cod
- Page 823 and 824:
High purity inorganic chemicals Cod
- Page 825 and 826:
High purity inorganic chemicals Cod
- Page 827 and 828:
Physical property standards
- Page 829 and 830:
Thermal properties Thermal properti
- Page 831 and 832:
Thermal properties Code Product Uni
- Page 833 and 834:
Thermal properties Code Product Uni
- Page 835 and 836:
Thermal properties Code Product Uni
- Page 837 and 838:
Particles and surface properties Pa
- Page 839 and 840:
Particles and surface properties Co
- Page 841 and 842:
Particles and surface properties Co
- Page 843 and 844:
Particles and surface properties Co
- Page 845 and 846:
Particles and surface properties Co
- Page 847 and 848:
Particles and surface properties Co
- Page 849 and 850:
Particles and surface properties Co
- Page 851 and 852:
Reference Nanomaterials Reference N
- Page 853 and 854:
Optical properties Code Product Uni
- Page 855 and 856:
Optical properties Code Product Uni
- Page 857 and 858:
Optical properties Code Product Uni
- Page 859 and 860:
Optical properties Code Product Uni
- Page 861 and 862:
Optical properties Code Product Uni
- Page 863 and 864:
Optical properties Code Product Uni
- Page 865 and 866:
Ion activity Code Product Unit Micr
- Page 867 and 868:
Ion activity Code Product Unit NIST
- Page 869 and 870:
Electrical properties Code Product
- Page 871 and 872:
Viscosity Code Product Unit PSL2700
- Page 873 and 874:
Polymeric properties Certified liqu
- Page 875 and 876:
Polymeric properties Code Product U
- Page 877 and 878:
Miscellaneous Code Product Unit NIS
- Page 879 and 880:
Miscellaneous Code Product Unit GUM
- Page 881 and 882:
Miscellaneous Code Product Unit ERM
- Page 883 and 884:
Miscellaneous Code Product Unit New
- Page 885 and 886:
ULTRASep Filters Code Product Unit
- Page 887 and 888:
eVol® hand-held automated analytic
- Page 889 and 890:
eVol® hand-held automated analytic
- Page 891 and 892:
High purity solvents, acids and chr
- Page 893 and 894:
Introduction Introduction Picograde
- Page 895 and 896:
Ion pair reagents Ion pair reagents
- Page 897 and 898:
High purity solvents and acids Code
- Page 899 and 900:
High purity solvents and acids Code
- Page 901 and 902:
High purity solvents and acids Code
- Page 903 and 904:
High purity solvents and acids Code
- Page 905 and 906:
High purity solvents and acids Code
- Page 907 and 908:
High purity solvents and acids Code
- Page 909 and 910:
High purity solvents and acids Code
- Page 911 and 912:
High purity solvents and acids Code
- Page 913 and 914:
High purity solvents and acids Code
- Page 915 and 916:
High purity solvents and acids Code
- Page 917 and 918:
High purity solvents and acids Code
- Page 919 and 920:
High purity solvents and acids Code
- Page 921 and 922:
High purity solvents and acids Code
- Page 923 and 924:
High purity solvents and acids Code
- Page 925 and 926:
Index
- Page 927 and 928:
Code number index Code number index
- Page 929 and 930:
Code number index CDX-00014303-010
- Page 931 and 932:
Code number index CIL-CLM-4874-1.2
- Page 933 and 934:
Code number index CIL-EC-5181 .....
- Page 935 and 936:
Code number index CIL-JR-D32-25 ...
- Page 937 and 938:
Code number index CIL-ULM-6917-1.2
- Page 939 and 940:
Code number index ERM-BF428B ......
- Page 941 and 942:
Code number index FL-36734-1G .....
- Page 943 and 944:
Code number index IPO 191 .........
- Page 945 and 946:
Code number index NCS DC71304 .....
- Page 947 and 948:
Code number index NIST-RM 8010 ....
- Page 949 and 950:
Code number index STRM-1A2A3A4A-R .
- Page 951 and 952:
Code number index U-FLSA-119 ......
- Page 953 and 954:
Code number index U-ICP-305 .......
- Page 955 and 956:
Code number index U-PPM-525C-1 ....
- Page 957 and 958:
Code number index U-QCI-765 .......
- Page 959 and 960:
Code number index U-RPC-062 .......
- Page 961 and 962:
Code number index U-US-105N . 461,
- Page 963 and 964:
Product index 281-24-236 x 3006-210
- Page 965 and 966:
Benzophenone ......................
- Page 967 and 968:
4-Chloro-2-methylphenol ...........
- Page 969 and 970:
3,4-Dibromodiphenyl ether .........
- Page 971 and 972:
Docosanoic acid ...................
- Page 973 and 974:
Fresh water sediments - PCBs and PB
- Page 975 and 976:
n-Hexanol .........................
- Page 977 and 978:
Methyl-3,5-dichlorobenzoate .......
- Page 979 and 980:
cis-Nonachlor ................... 3
- Page 981 and 982:
cis-Permethrin ................. 35
- Page 983 and 984:
100, 101, 102, 103, 104, 105, 106,
- Page 985 and 986:
D-gamma-tocopherol ................
- Page 987 and 988:
LGC Standards proficiency testing L