SAPEM Chapter 2 - Sanral
SAPEM Chapter 2 - Sanral
SAPEM Chapter 2 - Sanral

You also want an ePaper? Increase the reach of your titles
YUMPU automatically turns print PDFs into web optimized ePapers that Google loves.
Serviceability Index<br />
South African Pavement Engineering Manual<br />
<strong>Chapter</strong> 2: Pavement Composition and Behaviour<br />
Figure 17. Surface Cracking and Potholing<br />
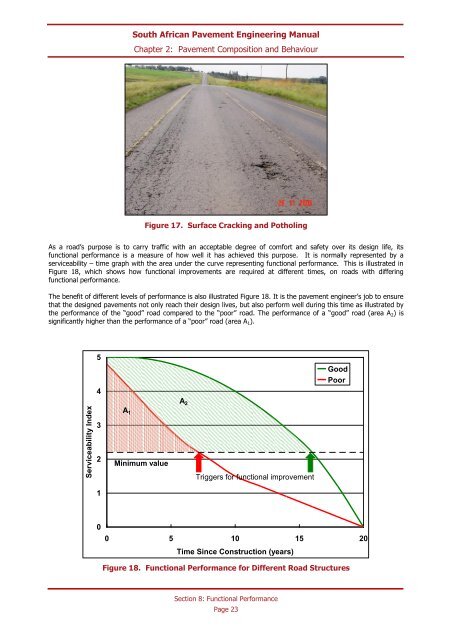
As a road’s purpose is to carry traffic with an acceptable degree of comfort and safety over its design life, its<br />
functional performance is a measure of how well it has achieved this purpose. It is normally represented by a<br />
serviceability – time graph with the area under the curve representing functional performance. This is illustrated in<br />
Figure 18, which shows how functional improvements are required at different times, on roads with differing<br />
functional performance.<br />
The benefit of different levels of performance is also illustrated Figure 18. It is the pavement engineer’s job to ensure<br />
that the designed pavements not only reach their design lives, but also perform well during this time as illustrated by<br />
the performance of the “good” road compared to the “poor” road. The performance of a “good” road (area A 2 ) is<br />
significantly higher than the performance of a “poor” road (area A 1 ).<br />
5<br />
4<br />
Good<br />
Poor<br />
A 1<br />
A 2<br />
Triggers for functional improvement<br />
3<br />
2<br />
Minimum value<br />
1<br />
0<br />
0 5 10 15 20<br />
Time Since Construction (years)<br />
Figure 18. Functional Performance for Different Road Structures<br />
Section 8: Functional Performance<br />
Page 23