Advancing Humanities and Social Sciences Research in Ireland
Advancing Humanities and Social Sciences Research in Ireland
Advancing Humanities and Social Sciences Research in Ireland

Create successful ePaper yourself
Turn your PDF publications into a flip-book with our unique Google optimized e-Paper software.
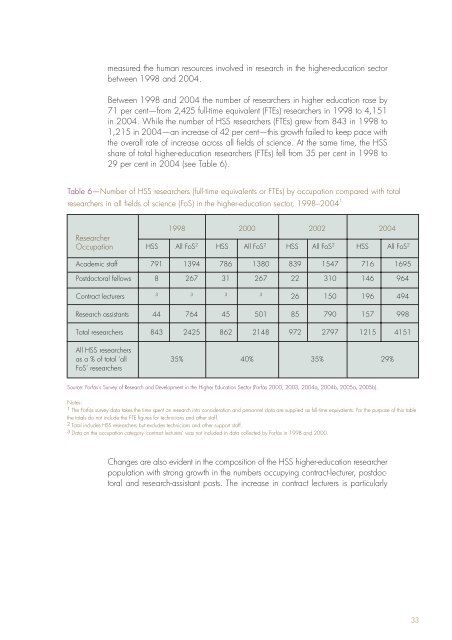
measured the human resources <strong>in</strong>volved <strong>in</strong> research <strong>in</strong> the higher-education sector<br />
between 1998 <strong>and</strong> 2004.<br />
Between 1998 <strong>and</strong> 2004 the number of researchers <strong>in</strong> higher education rose by<br />
71 per cent—from 2,425 full-time equivalent (FTEs) researchers <strong>in</strong> 1998 to 4,151<br />
<strong>in</strong> 2004. While the number of HSS researchers (FTEs) grew from 843 <strong>in</strong> 1998 to<br />
1,215 <strong>in</strong> 2004—an <strong>in</strong>crease of 42 per cent—this growth failed to keep pace with<br />
the overall rate of <strong>in</strong>crease across all fields of science. At the same time, the HSS<br />
share of total higher-education researchers (FTEs) fell from 35 per cent <strong>in</strong> 1998 to<br />
29 per cent <strong>in</strong> 2004 (see Table 6).<br />
Table 6—Number of HSS researchers (full-time equivalents or FTEs) by occupation compared with total<br />
researchers <strong>in</strong> all fields of science (FoS) <strong>in</strong> the higher-education sector, 1998–2004 1<br />
1998 2000 2002 2004<br />
<strong>Research</strong>er<br />
Occupation HSS All FoS 2 HSS All FoS 2 HSS All FoS 2 HSS All FoS 2<br />
Academic staff 791 1394 786 1380 839 1547 716 1695<br />
Postdoctoral fellows 8 267 31 267 22 310 146 964<br />
Contract lecturers<br />
3 3 3 3<br />
26 150 196 494<br />
<strong>Research</strong> assistants 44 764 45 501 85 790 157 998<br />
Total researchers 843 2425 862 2148 972 2797 1215 4151<br />
All HSS researchers<br />
as a % of total ‘all<br />
FoS’ researchers<br />
35% 40% 35% 29%<br />
Source: Forfás’s Survey of <strong>Research</strong> <strong>and</strong> Development <strong>in</strong> the Higher Education Sector (Forfás 2000, 2003, 2004a, 2004b, 2005a, 2005b).<br />
Notes:<br />
1 The Forfás survey data takes the time spent on research <strong>in</strong>to consideration <strong>and</strong> personnel data are supplied as full-time equivalents. For the purpose of this table<br />
the totals do not <strong>in</strong>clude the FTE figures for technicians <strong>and</strong> other staff.<br />
2 Total <strong>in</strong>cludes HSS researchers but excludes technicians <strong>and</strong> other support staff.<br />
3 Data on the occupation category ‘contract lecturers’ was not <strong>in</strong>cluded <strong>in</strong> data collected by Forfás <strong>in</strong> 1998 <strong>and</strong> 2000.<br />
Changes are also evident <strong>in</strong> the composition of the HSS higher-education researcher<br />
population with strong growth <strong>in</strong> the numbers occupy<strong>in</strong>g contract-lecturer, postdoctoral<br />
<strong>and</strong> research-assistant posts. The <strong>in</strong>crease <strong>in</strong> contract lecturers is particularly<br />
33