Analytical Measurement - Nuova Elva
Analytical Measurement - Nuova Elva
Analytical Measurement - Nuova Elva

You also want an ePaper? Increase the reach of your titles
YUMPU automatically turns print PDFs into web optimized ePapers that Google loves.
JUMO GmbH & Co. KG<br />
Delivery address:Mackenrodtstraße 14,<br />
36039 Fulda, Germany<br />
Postal address: 36035 Fulda, Germany<br />
Phone: +49 661 6003-0<br />
Fax: +49 661 6003-607<br />
e-mail: mail@jumo.net<br />
Internet: www.jumo.net<br />
JUMO Instrument Co. Ltd.<br />
JUMO House<br />
Temple Bank, Riverway<br />
Harlow, Essex CM 20 2TT, UK<br />
Phone: +44 1279 635533<br />
Fax: +44 1279 635262<br />
e-mail: sales@jumo.co.uk<br />
Internet: www.jumo.co.uk<br />
JUMO Process Control, Inc.<br />
8 Technology Boulevard<br />
Canastota, NY 13031, USA<br />
Phone: 315-697-JUMO<br />
1-800-554-JUMO<br />
Fax: 315-697-5867<br />
e-mail: info@jumo.us<br />
Internet: www.jumo.us<br />
Data Sheet 20.2565<br />
Page 2/12<br />
Functional description<br />
The instrument is designed for use on site. A<br />
rugged housing protects the electronics and<br />
the electrical connections from corrosive<br />
environmental conditions (IP67). As an<br />
alternative, the instrument can also be<br />
installed in a control panel, and is then<br />
protected to IP65 on the front. The electrical<br />
connection is made by easy-to-fit pluggable<br />
screw terminals.<br />
Transmitter<br />
Two-electrode cells (standard) as well as fourelectrode<br />
cells can be used for measurement.<br />
Two-electrode cells can be connected, in the<br />
usual increments for cell constants (K=0.01;<br />
0.1; 1.0; 3.0 and 10.0). Thanks to the widely<br />
adjustable relative cell constant, it is also<br />
possible to connect sensors with different cell<br />
constants (e.g. K=0.2).<br />
In the case of the 4-electrode cells, the values<br />
K=0.5 and 1.0 have been predefined for the<br />
cell constant. Here too, the instrument can be<br />
matched to sensors with different cell<br />
constants (e.g. K=0.4).<br />
The instrument can perform automatic<br />
temperature compensation, by acquiring the<br />
temperature of the sample solution.<br />
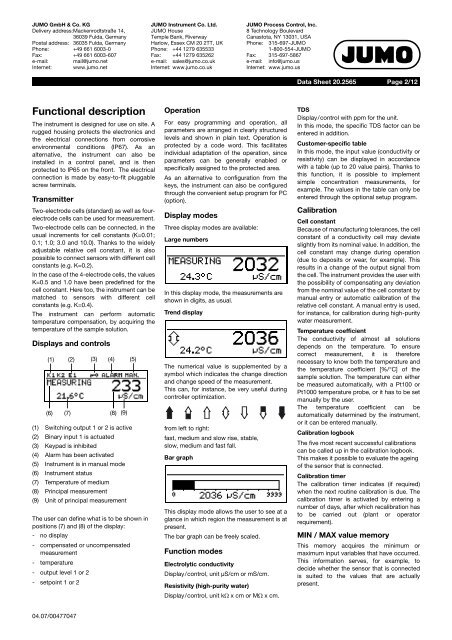
Displays and controls<br />
(1) (2) (3) (4) (5)<br />
(6) (7) (8) (9)<br />
(1) Switching output 1 or 2 is active<br />
(2) Binary input 1 is actuated<br />
(3) Keypad is inhibited<br />
(4) Alarm has been activated<br />
(5) Instrument is in manual mode<br />
(6) Instrument status<br />
(7) Temperature of medium<br />
(8) Principal measurement<br />
(9) Unit of principal measurement<br />
The user can define what is to be shown in<br />
positions (7) and (8) of the display:<br />
- no display<br />
- compensated or uncompensated<br />
measurement<br />
- temperature<br />
- output level 1 or 2<br />
- setpoint 1 or 2<br />
Operation<br />
For easy programming and operation, all<br />
parameters are arranged in clearly structured<br />
levels and shown in plain text. Operation is<br />
protected by a code word. This facilitates<br />
individual adaptation of the operation, since<br />
parameters can be generally enabled or<br />
specifically assigned to the protected area.<br />
As an alternative to configuration from the<br />
keys, the instrument can also be configured<br />
through the convenient setup program for PC<br />
(option).<br />
Display modes<br />
Three display modes are available:<br />
Large numbers<br />
In this display mode, the measurements are<br />
shown in digits, as usual.<br />
Trend display<br />
The numerical value is supplemented by a<br />
symbol which indicates the change direction<br />
and change speed of the measurement.<br />
This can, for instance, be very useful during<br />
controller optimization.<br />
from left to right:<br />
fast, medium and slow rise, stable,<br />
slow, medium and fast fall.<br />
Bar graph<br />
This display mode allows the user to see at a<br />
glance in which region the measurement is at<br />
present.<br />
The bar graph can be freely scaled.<br />
Function modes<br />
Electrolytic conductivity<br />
Display/control, unit µS/cm or mS/cm.<br />
Resistivity (high-purity water)<br />
Display/control, unit kΩ x cm or MΩ x cm.<br />
TDS<br />
Display/control with ppm for the unit.<br />
In this mode, the specific TDS factor can be<br />
entered in addition.<br />
Customer-specific table<br />
In this mode, the input value (conductivity or<br />
resistivity) can be displayed in accordance<br />
with a table (up to 20 value pairs). Thanks to<br />
this function, it is possible to implement<br />
simple concentration measurements, for<br />
example. The values in the table can only be<br />
entered through the optional setup program.<br />
Calibration<br />
Cell constant<br />
Because of manufacturing tolerances, the cell<br />
constant of a conductivity cell may deviate<br />
slightly from its nominal value. In addition, the<br />
cell constant may change during operation<br />
(due to deposits or wear, for example). This<br />
results in a change of the output signal from<br />
the cell. The instrument provides the user with<br />
the possibility of compensating any deviation<br />
from the nominal value of the cell constant by<br />
manual entry or automatic calibration of the<br />
relative cell constant. A manual entry is used,<br />
for instance, for calibration during high-purity<br />
water measurement.<br />
Temperature coefficient<br />
The conductivity of almost all solutions<br />
depends on the temperature. To ensure<br />
correct measurement, it is therefore<br />
necessary to know both the temperature and<br />
the temperature coefficient [%/°C] of the<br />
sample solution. The temperature can either<br />
be measured automatically, with a Pt100 or<br />
Pt1000 temperature probe, or it has to be set<br />
manually by the user.<br />
The temperature coefficient can be<br />
automatically determined by the instrument,<br />
or it can be entered manually.<br />
Calibration logbook<br />
The five most recent successful calibrations<br />
can be called up in the calibration logbook.<br />
This makes it possible to evaluate the ageing<br />
of the sensor that is connected.<br />
Calibration timer<br />
The calibration timer indicates (if required)<br />
when the next routine calibration is due. The<br />
calibration timer is activated by entering a<br />
number of days, after which recalibration has<br />
to be carried out (plant or operator<br />
requirement).<br />
MIN / MAX value memory<br />
This memory acquires the minimum or<br />
maximum input variables that have occurred.<br />
This information serves, for example, to<br />
decide whether the sensor that is connected<br />
is suited to the values that are actually<br />
present.<br />
04.07/00477047