The Status of Arts Education in Ohio's Public ... - Ohio Arts Council
The Status of Arts Education in Ohio's Public ... - Ohio Arts Council
The Status of Arts Education in Ohio's Public ... - Ohio Arts Council

You also want an ePaper? Increase the reach of your titles
YUMPU automatically turns print PDFs into web optimized ePapers that Google loves.
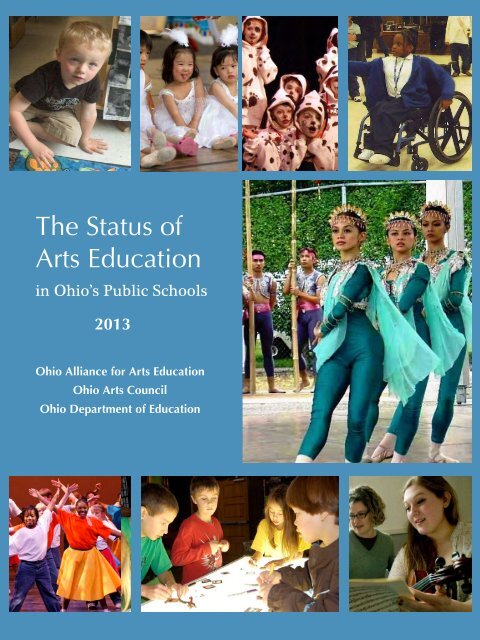
<strong>The</strong> <strong>Status</strong> <strong>of</strong><br />
<strong>Arts</strong> <strong>Education</strong><br />
<strong>in</strong> <strong>Ohio</strong>’s <strong>Public</strong> Schools<br />
2013<br />
<strong>Ohio</strong> Alliance for <strong>Arts</strong> <strong>Education</strong><br />
<strong>Ohio</strong> <strong>Arts</strong> <strong>Council</strong><br />
<strong>Ohio</strong> Department <strong>of</strong> <strong>Education</strong>
COVER PHOTOS<br />
(CLOCKWISE FROM TOP LEFT)<br />
COURTESY OF:<br />
PASSIONWORKS STUDIO<br />
COLUMBUS ASIAN FESTIVAL<br />
PORTSMOUTH AREA ARTS COUNCIL<br />
DANCING WHEELS<br />
COLUMBUS ASIAN FESTIVAL<br />
CINCINNATI SYMPHONY<br />
GRANVILLE STUDIO OF VISUAL ARTS<br />
BALLETMET
<strong>The</strong> <strong>Status</strong> <strong>of</strong> <strong>Arts</strong> <strong>Education</strong><br />
<strong>in</strong> <strong>Ohio</strong>’s <strong>Public</strong> Schools<br />
F<strong>in</strong>d<strong>in</strong>gs and Recommendations<br />
Based on a 2009-2010 Study<br />
by Quadrant <strong>Education</strong> Research<br />
Analysis and Report by:<br />
<strong>The</strong> <strong>Ohio</strong> Alliance for <strong>Arts</strong> <strong>Education</strong><br />
Made possible by a grant from<br />
the National Endowment for the <strong>Arts</strong><br />
<strong>The</strong> <strong>Ohio</strong> <strong>Arts</strong> <strong>Council</strong><br />
<strong>The</strong> <strong>Ohio</strong> Department Of <strong>Education</strong><br />
Published March 2013
We are grateful to the <strong>Ohio</strong> school leaders<br />
who participated <strong>in</strong> the <strong>Status</strong> Survey.<br />
All <strong>of</strong> our team members and partners are listed at the end <strong>of</strong> the report.<br />
To learn more about arts education <strong>in</strong> <strong>Ohio</strong>, please visit our websites.<br />
www.oaae.net<br />
www.oac.state.oh.us<br />
www.ode.state.oh.us<br />
To <strong>in</strong>quire about report contents or get <strong>in</strong>volved<br />
<strong>in</strong> strengthen<strong>in</strong>g arts education, contact:<br />
Donna Coll<strong>in</strong>s, Executive Director<br />
<strong>Ohio</strong> Alliance for <strong>Arts</strong> <strong>Education</strong><br />
614-224-1060<br />
dcoll<strong>in</strong>s@oaae.net<br />
Chiquita Mull<strong>in</strong>s Lee, <strong>Arts</strong> Learn<strong>in</strong>g Program Coord<strong>in</strong>ator<br />
<strong>Ohio</strong> <strong>Arts</strong> <strong>Council</strong><br />
614-466-2613<br />
Chiquita.Mull<strong>in</strong>sLee@oac.state.oh.us<br />
Nancy Pistone, F<strong>in</strong>e <strong>Arts</strong> Consultant<br />
<strong>Ohio</strong> Department <strong>of</strong> <strong>Education</strong><br />
614-466-7908<br />
Nancy.Pistone@education.ohio.gov<br />
Copyright © 2013
TABLE OF CONTENTS<br />
FOREWORD ............................................................................................................................................1<br />
VISION AND CONTEXT...........................................................................................................................3<br />
REPORT SUMMARY .............................................................................................................................11<br />
FINDINGS AND ANALYSIS ...................................................................................................................17<br />
GOALS ...................................................................................................................................................56<br />
RESOURCES.........................................................................................................................................61<br />
METHODOLOGY ...................................................................................................................................66<br />
PREVIOUS STATUS REPORTS............................................................................................................70
LIST OF TABLES<br />
TABLE 1: QUALITY CONDITIONS AND SUPPORTS ASSESSED IN OHIO’S<br />
STATUS SURVEY REFLECT NATIONAL STUDIES ..................................................................................................................... 10<br />
TABLE 2: QUICK GUIDE TO FINDINGS BY SECTION................................................................................................................ 18<br />
TABLE 3: ACCESS TO ARTS EDUCATION BY SCHOOL TYPE................................................................................................... 20<br />
TABLE 4. NUMBER AND PERCENTAGE OF OHIO'S PUBLIC SCHOOL DISTRICTS<br />
OFFERING EACH OF 29 ARTS COURSES .................................................................................................................................. 25<br />
TABLE 5: THE 25 DISTRICTS WITH THE HIGHEST NUMBER OF DIFFERENT ARTS COURSES.................................................... 26<br />
TABLE 6: COMPARISON OF EQUITY GAPS IN OHIO AND NATION BASED ON ODE DATA ....................................................... 30<br />
TABLE 7: NUMBER OF COURSES TAUGHT FOR EACH UNIQUE ARTS COURSE<br />
AND PERCENTAGE OF EACH COURSE TAUGHT BY A TEACHER WITH A LICENSE IN THE DISCIPLINE...................................... 33<br />
TABLE 8: PERCENTAGES OF TEACHERS IN EACH DISCIPLINE SERVING<br />
ONE, TWO, THREE AND FOUR OR MORE SCHOOLS................................................................................................................. 35<br />
TABLE 9: MEAN AND MAXIMUM NUMBER OF STUDENTS TAUGHT BY A<br />
SINGLE TEACHER IN EACH COURSE ....................................................................................................................................... 36<br />
TABLE 10: NUMBER OF MUSIC TEACHERS IN EACH DISTRICT TYPE COMPARED<br />
TO NUMBER AND PERCENTAGE OF STUDENTS ENROLLED IN MUSIC..................................................................................... 37<br />
TABLE 11: NUMBER OF VISUAL ARTS TEACHERS IN EACH DISTRICT TYPE COMPARED<br />
TO NUMBER AND PERCENTAGE OF STUDENTS ENROLLED IN VISUAL ARTS........................................................................... 38<br />
TABLE 12: EXAMPLES OF TECHNOLOGIES SCHOOLS REPORTED USING................................................................................. 41<br />
TABLE 13: BENEFITS OF ARTISTS IN RESIDENCE REPORTED BY STATUS SURVEY PARTICIPANTS........................................ 42<br />
TABLE 14: BUDGET RANGE BY SCHOOL TYPE ....................................................................................................................... 53<br />
TABLE 15: FUNDING FROM OUTSIDE SOURCES: PERCENTAGES OF SCHOOLS AND MEDIAN AMOUNTS ................................. 53<br />
TABLE 16: DIFFERENCES IN SCHOOL CHARACTERISTICS EXAMINED IN ODE DATA............................................................. 67<br />
TABLE 17: TYPE AND SIZE OF SCHOOLS RESPONDING TO THE STATUS SURVEY.................................................................... 69
LIST OF FIGURES<br />
FIGURE 1: ACCESS TO THE ARTS IN OHIO'S TRADITIONAL PUBLIC SCHOOLS........................................................................ 19<br />
FIGURE 2: PERCENTAGE OF SCHOOLS WITH AT LEAST ONE STUDENT ENROLLED IN AN ARTS COURSE ................................ 20<br />
FIGURE 3: NUMBER OF ARTS DISCIPLINES OFFERED IN TRADITIONAL PUBLIC AND COMMUNITY SCHOOLS ........................ 21<br />
FIGURE 4: TOTAL TEACHERS BY DISCIPLINE AND SCHOOL LEVEL ........................................................................................ 22<br />
FIGURE 5: PERCENTAGE OF STUDENTS WITHOUT ACCESS TO COURSES IN EACH DISCIPLINE ........................................... 22<br />
FIGURE 6: PERCENTAGE OF SCHOOLS IN EACH DISTRICT TYPE<br />
GROUPED BY NUMBER OF DISCIPLINES OFFERED .................................................................................................................. 23<br />
FIGURE 7: PARTICIPATION IN EXTRACURRICULAR ARTS INSTRUCTION ................................................................................. 27<br />
FIGURE 8: ACCESS TO MUSIC AND VISUAL ARTS—<br />
NATIONAL SAMPLE COMPARED TO OHIO SURVEY................................................................................................................. 28<br />
FIGURE 9: ACCESS TO DANCE AND DRAMA/THEATRE COURSES—<br />
NATIONAL SAMPLE COMPARED TO OHIO SURVEY................................................................................................................. 29<br />
FIGURE 10: ADOPTION AND USE OF CONTENT STANDARDS AS OF 2009 ................................................................................ 31<br />
FIGURE 11: PERCENTAGES OF SCHOOLS BY TEACHER LICENSURE IN THE ARTS ................................................................... 32<br />
FIGURE 12: PERCENTAGE OF SCHOOLS OFFERING EACH TYPE OF INCENTIVE ....................................................................... 34<br />
FIGURE 13: PERCENTAGE OF BUILDINGS WITH AT LEAST ONE FTE ARTS EDUCATOR .......................................................... 35<br />
FIGURE 14: PERCENTAGE OF SCHOOLS PROVIDING ONE HOUR OR MORE<br />
OF ARTS INSTRUCTION A WEEK ............................................................................................................................................. 39<br />
FIGURE 15: PERCENTAGES OF ARTS COURSES TAUGHT IN DEDICATED CLASSROOMS<br />
BY ARTS DISCIPLINE AND SCHOOL LEVEL ............................................................................................................................. 40<br />
FIGURE 16: COMPARING PERCENTAGES OF SCHOOLS ALIGNED WITH STANDARDS ............................................................... 43<br />
FIGURE 17: PERCENTAGE OF SCHOOLS WITH ARTS SPECIALIST ON STAFF —<br />
NATIONAL SAMPLE COMPARED TO OHIO SURVEY................................................................................................................. 44<br />
FIGURE 18: PERCENTAGE OF SCHOOLS WITH DEDICATED CLASSROOMS —<br />
NATIONAL SAMPLE COMPARED TO OHIO SURVEY................................................................................................................. 45<br />
FIGURE 19: PERCENTAGE OF SCHOOLS USING TECHNOLOGY IN ARTS INSTRUCTION —<br />
NATIONAL SAMPLE COMPARED TO OHIO SURVEY................................................................................................................. 45
FIGURE 20: USE OF ARTS PARTNERSHIPS AND ARTIST RESIDENCIES—<br />
NATIONAL SAMPLE COMPARED TO OHIO SURVEY................................................................................................................. 46<br />
FIGURE 21: AVAILABILITY OF ARTS COORDINATORS—<br />
NATIONAL SAMPLE COMPARED TO OHIO SAMPLE................................................................................................................. 47<br />
FIGURE 22: MEDIAN K-12 ENROLLMENT FOR MUSIC AND VISUAL ARTS.............................................................................. 50<br />
FIGURE 23: ENROLLMENT IN ARTS COURSES BY DISCIPLINE AND DISTRICT TYPE ................................................................ 50<br />
FIGURE 24: MUSIC AND VISUAL ARTS MEDIAN ENROLLMENT BY SCHOOL LEVEL ............................................................... 51<br />
FIGURE 25: RANGE OF ARTS EDUCATION BUDGETS .............................................................................................................. 52<br />
FIGURE 26: ARTS EDUCATION BUDGETS PER STUDENT......................................................................................................... 53<br />
FIGURE 27: PERCENTAGE OF SCHOOLS THAT INCLUDED ARTS SPECIALISTS IN IMPROVEMENT PLANNING—<br />
NATIONAL SAMPLE COMPARED TO OHIO SURVEY................................................................................................................. 54<br />
FIGURE 28: ARTS COURSE REQUIREMENTS AND COURSE WEIGHTING —<br />
NATIONAL SAMPLE COMPARED TO OHIO SURVEY................................................................................................................. 54
FOREWORD<br />
<strong>The</strong> <strong>Ohio</strong> Alliance for <strong>Arts</strong> <strong>Education</strong> (OAAE), the <strong>Ohio</strong> <strong>Arts</strong> <strong>Council</strong> (OAC) and the <strong>Ohio</strong><br />
Department <strong>of</strong> <strong>Education</strong> (ODE) are pleased to present <strong>The</strong> <strong>Status</strong> <strong>of</strong> <strong>Arts</strong> <strong>Education</strong> <strong>in</strong> <strong>Ohio</strong>’s<br />
<strong>Public</strong> Schools.<br />
This report builds on <strong>Ohio</strong>’s cont<strong>in</strong>ued <strong>in</strong>terest <strong>in</strong> the strength <strong>of</strong> arts learn<strong>in</strong>g and its role <strong>in</strong><br />
school academic programs. It provides basel<strong>in</strong>e data for anyone seek<strong>in</strong>g a “big picture”<br />
understand<strong>in</strong>g <strong>of</strong> what the level <strong>of</strong> support for high-quality arts education has been among<br />
<strong>Ohio</strong>’s public schools and districts, how available resources are be<strong>in</strong>g used, and where<br />
additional resources and efforts may be needed. It addresses key elements <strong>of</strong> <strong>Ohio</strong>’s arts<br />
education <strong>in</strong>frastructure, particularly people, resources and policies at the local level that affect<br />
delivery <strong>of</strong> arts <strong>in</strong>struction and allocation <strong>of</strong> resources to arts education. Anyone who makes<br />
decisions that could affect K-12 students’ access to arts education and their cont<strong>in</strong>ued progress <strong>in</strong><br />
learn<strong>in</strong>g <strong>in</strong>, about and through the arts should read this report. That <strong>in</strong>cludes teachers—those who<br />
provide arts <strong>in</strong>struction and their colleagues who work with them to improve educational quality.<br />
It <strong>in</strong>cludes <strong>in</strong>dividuals and organizations that advocate for access and quality <strong>in</strong> arts education,<br />
support the arts, conduct educational research and provide staff development to schools. F<strong>in</strong>ally,<br />
it <strong>in</strong>cludes those who shape policy and legislation, fund programs and lead <strong>in</strong>itiatives.<br />
New Jersey-based Quadrant <strong>Arts</strong> <strong>Education</strong> Research (Quadrant)—a national leader <strong>in</strong> arts<br />
education research, analysis and market <strong>in</strong>telligence—led the data collection and analysis.<br />
Leaders from the OAAE, OAC and ODE discussed the results at length and worked as a team<br />
to guide the development <strong>of</strong> this report.<br />
Quadrant began the study <strong>in</strong> January 2010 by analyz<strong>in</strong>g<br />
ODE data on all <strong>Ohio</strong> public schools to reveal common<br />
characteristics and differences across the landscape <strong>of</strong> arts<br />
education <strong>in</strong> <strong>Ohio</strong>. Quadrant analyzed ODE data on 3,327<br />
schools, <strong>in</strong>clud<strong>in</strong>g 2,969 traditional public schools <strong>in</strong> 612<br />
school districts and 246 community schools.<br />
<strong>The</strong> second phase was the onl<strong>in</strong>e <strong>Status</strong> Survey, which was<br />
open to all <strong>of</strong> <strong>Ohio</strong>’s public schools from April through<br />
August 2010. Sixteen percent <strong>of</strong> <strong>Ohio</strong>’s public schools—<br />
542 schools serv<strong>in</strong>g approximately 295,000 <strong>of</strong> <strong>Ohio</strong>’s 1.8<br />
million students—responded to the <strong>Status</strong> Survey.<br />
Traditional public schools<br />
are part <strong>of</strong> local school<br />
systems that are governed<br />
by local boards <strong>of</strong><br />
education.<br />
Community schools <strong>in</strong><br />
<strong>Ohio</strong> are publicly funded<br />
and publicly accountable<br />
schools run by nonpr<strong>of</strong>it<br />
educational organizations.<br />
Also known as “public<br />
charter schools,” community<br />
schools are authorized<br />
under ORC §3314.<br />
This report presents f<strong>in</strong>d<strong>in</strong>gs based on analysis <strong>of</strong> both the ODE data and the responses to the<br />
<strong>Status</strong> Survey. <strong>The</strong> two data sources told the same general story. Responses to the survey<br />
added more depth to some <strong>of</strong> the ODE data and produced additional <strong>in</strong>formation about arts<br />
education programs <strong>in</strong> <strong>Ohio</strong>’s public schools. (Additional details on methodology appear on<br />
page 66.)<br />
<strong>Status</strong> <strong>of</strong> <strong>Arts</strong> <strong>Education</strong> <strong>in</strong> <strong>Ohio</strong>’s <strong>Public</strong> Schools 1
Courtesy: Yellow Spr<strong>in</strong>gs Kids Playhouse<br />
Courtesy: Contemporary Youth Orchestra<br />
Courtesy: Kate Kern, <strong>Arts</strong> Learn<strong>in</strong>g Residency<br />
Courtesy: Danc<strong>in</strong>g Wheels<br />
<strong>Status</strong> <strong>of</strong> <strong>Arts</strong> <strong>Education</strong> <strong>in</strong> <strong>Ohio</strong>’s <strong>Public</strong> Schools 2
VISION AND CONTEXT<br />
WHY DO WE STUDY THE STATUS OF ARTS EDUCATION?<br />
Courtesy: Yellow Spr<strong>in</strong>gs Kids Playhouse<br />
<strong>The</strong> vision <strong>of</strong> <strong>Ohio</strong>’s State Board <strong>of</strong> <strong>Education</strong> is “for all<br />
students to graduate from the pre-K-12 education system<br />
with the knowledge, skills and behaviors necessary<br />
to be well prepared for success.”<br />
We—the <strong>Ohio</strong> Alliance for <strong>Arts</strong> <strong>Education</strong>, the <strong>Ohio</strong> <strong>Arts</strong><br />
<strong>Council</strong> and the <strong>Ohio</strong> Department <strong>of</strong> <strong>Education</strong>—believe that<br />
arts education plays a vital and <strong>of</strong>ten overlooked role <strong>in</strong><br />
realiz<strong>in</strong>g that bold vision. Regularly assess<strong>in</strong>g the status <strong>of</strong><br />
arts education <strong>in</strong> <strong>Ohio</strong>’s public schools statewide is part <strong>of</strong><br />
our shared commitment to ma<strong>in</strong>ta<strong>in</strong><strong>in</strong>g an arts education<br />
<strong>in</strong>frastructure that supports the success <strong>of</strong> <strong>Ohio</strong>’s students.<br />
We believe that high-quality arts education develops habits <strong>of</strong> m<strong>in</strong>d<br />
that prepare students for successful postsecondary studies and the<br />
world <strong>of</strong> work. Our belief is congruent with evidence from research,<br />
expert recommendations, and the expectations with<strong>in</strong> <strong>Ohio</strong>’s legal<br />
codes, standards and requirements for public education.<br />
Our arts education vision for <strong>Ohio</strong>’s students <strong>in</strong>cludes:<br />
• Frequent, standards-based arts learn<strong>in</strong>g experiences delivered by<br />
qualified arts educators and designed to produce high-quality<br />
results.<br />
• Opportunities to explore and excel <strong>in</strong> dance, music,<br />
drama/theatre and the visual arts.<br />
• Integration <strong>of</strong> arts education with the challenges <strong>of</strong> learn<strong>in</strong>g,<br />
shar<strong>in</strong>g a school culture and improv<strong>in</strong>g school outcomes.<br />
One way to assess progress toward this vision is to exam<strong>in</strong>e the<br />
extent and equity <strong>of</strong> students’ access to arts education, the presence<br />
<strong>of</strong> school conditions that support high-quality arts <strong>in</strong>struction and<br />
the <strong>in</strong>fluences <strong>of</strong> districts and communities on arts education<br />
programs. F<strong>in</strong>d<strong>in</strong>gs <strong>in</strong> those three areas, which are presented <strong>in</strong><br />
this report, will help us take more <strong>in</strong>formed action to prevent<br />
the erosion <strong>of</strong> <strong>Ohio</strong>’s arts education <strong>in</strong>frastructure and make<br />
the most <strong>of</strong> arts learn<strong>in</strong>g resources and opportunities.<br />
<strong>The</strong> <strong>Ohio</strong> Alliance for <strong>Arts</strong><br />
<strong>Education</strong> (OAAE) works to<br />
promote, develop, support and<br />
improve the quality <strong>of</strong> arts<br />
education <strong>in</strong> <strong>Ohio</strong>’s schools.<br />
<strong>The</strong> <strong>Ohio</strong> <strong>Arts</strong> <strong>Council</strong> (OAC)<br />
is a state agency that funds<br />
and supports quality arts<br />
experiences to strengthen<br />
<strong>Ohio</strong> communities culturally,<br />
educationally and<br />
economically.<br />
<strong>The</strong> <strong>Ohio</strong> Department <strong>of</strong><br />
<strong>Education</strong> (ODE) is the<br />
government agency that<br />
oversees and supports primary<br />
and secondary education for<br />
<strong>Ohio</strong>’s 1.8 million public school<br />
students. ODE works with the<br />
State Board <strong>of</strong> <strong>Education</strong>,<br />
Governor and <strong>Ohio</strong> General<br />
Assembly to shape<br />
educational policy and law and<br />
provide support to <strong>Ohio</strong>’s<br />
public schools.<br />
<strong>Status</strong> <strong>of</strong> <strong>Arts</strong> <strong>Education</strong> <strong>in</strong> <strong>Ohio</strong>’s <strong>Public</strong> Schools 3
We believe the f<strong>in</strong>d<strong>in</strong>gs provide a broad picture <strong>of</strong> what schools, districts, communities and the<br />
education system as a whole are do<strong>in</strong>g to improve access and equity, create the school and classroom<br />
conditions most necessary for high-quality arts <strong>in</strong>struction, and provide system support to susta<strong>in</strong> and<br />
strengthen arts education.<br />
That broad picture can be a useful framework both for exam<strong>in</strong><strong>in</strong>g the status <strong>of</strong> arts education <strong>in</strong> more<br />
depth and address<strong>in</strong>g the challenges ahead. This report will <strong>in</strong>form our <strong>in</strong>dividual and jo<strong>in</strong>t efforts to<br />
tra<strong>in</strong> teachers and guide school leaders, spotlight the benefits <strong>of</strong> arts education, support and celebrate<br />
arts learn<strong>in</strong>g projects throughout the state, and contribute to state and national education <strong>in</strong>itiatives.<br />
We hope this report will start a fruitful dialogue about public policies and local decisions that will<br />
strengthen support for arts education <strong>in</strong> <strong>Ohio</strong>—a dialogue that leads to committed action and<br />
measurable improvements <strong>in</strong> the educational experiences <strong>of</strong> all <strong>Ohio</strong> students.<br />
Courtesy: K12 Gallery for Young People<br />
<strong>Status</strong> <strong>of</strong> <strong>Arts</strong> <strong>Education</strong> <strong>in</strong> <strong>Ohio</strong>’s <strong>Public</strong> Schools 4
RESEARCH EVIDENCE: THE BENEFITS OF ARTS LEARNING<br />
High-quality arts education engages students <strong>in</strong> the work <strong>of</strong> learn<strong>in</strong>g, th<strong>in</strong>k<strong>in</strong>g,<br />
communicat<strong>in</strong>g, creat<strong>in</strong>g and collaborat<strong>in</strong>g. It also fosters the 21st century skills needed for<br />
advanced learn<strong>in</strong>g and career success. Moreover, arts education helps meet the <strong>in</strong>creas<strong>in</strong>g<br />
demand for imag<strong>in</strong>ation and creativity that enrich culture, drive economic progress and<br />
help solve the problems <strong>of</strong> a complex, global society.<br />
THE ARTS AND DEVELOPMENT OF COGNITIVE FUNCTIONS<br />
Studies l<strong>in</strong>k arts <strong>in</strong>struction to development <strong>of</strong> skills needed for<br />
learn<strong>in</strong>g, such as the spatial-temporal reason<strong>in</strong>g used <strong>in</strong><br />
mathematics and the phonological awareness needed for learn<strong>in</strong>g<br />
to read (We<strong>in</strong>berger, 1998; Hetland, 2000; National Institute <strong>of</strong><br />
Child Health and Human Development, 2000). <strong>The</strong> Dana<br />
Foundation (Asbury & Rich, 2008) has shown that learn<strong>in</strong>g <strong>in</strong> the<br />
arts strengthens neural networks used <strong>in</strong> other types <strong>of</strong> learn<strong>in</strong>g.<br />
THE ARTS AND EDUCATIONAL OUTCOMES<br />
Large-scale studies have shown that at-risk students with high<br />
levels <strong>of</strong> arts engagement achieved better outcomes <strong>in</strong> academics,<br />
college enrollment, civic engagement and participation <strong>in</strong><br />
pr<strong>of</strong>essional careers than did their peers with low levels <strong>of</strong><br />
engagement (Catterall, Dumais & Hampden-Thompson, 2012;<br />
Catterall, 2009).<br />
Research Resources<br />
<strong>Arts</strong>EdSearch: <strong>The</strong> <strong>Arts</strong> <strong>Education</strong><br />
Partnership (AEP) <strong>of</strong>fers an onl<strong>in</strong>e<br />
clear<strong>in</strong>ghouse that collects and<br />
summarizes arts education studies<br />
and analyzes their implications for<br />
policy and practice.<br />
Onl<strong>in</strong>e publications that report on<br />
research-based arts education <strong>in</strong><br />
<strong>Ohio</strong> <strong>in</strong>clude <strong>Arts</strong> On L<strong>in</strong>e Update,<br />
published by OAAE, L<strong>in</strong>ks &<br />
Threads, published jo<strong>in</strong>tly by OAC<br />
and ODE, and <strong>Arts</strong> Update,<br />
published by ODE. See the<br />
Additional Read<strong>in</strong>gs section (page<br />
64) for details on those resources.<br />
<strong>The</strong> Dana Foundation publishes a<br />
Web page that highlights the<br />
relationship between arts learn<strong>in</strong>g<br />
and cognitive development.<br />
THE ARTS AND CAREER READINESS<br />
<strong>The</strong> range <strong>of</strong> careers <strong>in</strong> the arts is widen<strong>in</strong>g and creative <strong>in</strong>dustries that require artistic ideas and skills<br />
are emerg<strong>in</strong>g and grow<strong>in</strong>g. Artistic th<strong>in</strong>k<strong>in</strong>g now <strong>in</strong>fuses technological <strong>in</strong>novation and the design <strong>of</strong><br />
everyday products (National Center on <strong>Education</strong> and the Economy, 2007; Carroll, 2007; National<br />
Governors Association Center for Best Practices, 2012). Moreover, <strong>in</strong>-depth learn<strong>in</strong>g experiences <strong>in</strong><br />
the arts are opportunities to practice deal<strong>in</strong>g with ambiguity, mak<strong>in</strong>g novel connections, th<strong>in</strong>k<strong>in</strong>g<br />
across discipl<strong>in</strong>es and cultures, work<strong>in</strong>g <strong>in</strong> teams and manag<strong>in</strong>g time and resources—skills and habits<br />
<strong>of</strong> m<strong>in</strong>d needed <strong>in</strong> all types <strong>of</strong> careers (Greene, 1995; Ruppert, 2006; W<strong>in</strong>ner, Hetland, Veenema &<br />
Sheridan, 2007; Lichtenberg, Woock & Wright, 2008; Partnership for 21st Century Skills, 2012;<br />
National Research <strong>Council</strong>, 2012). Lead<strong>in</strong>g creative visionaries, <strong>in</strong>novators, thought leaders and<br />
economic experts have mentioned the role <strong>of</strong> artistic th<strong>in</strong>k<strong>in</strong>g <strong>in</strong> driv<strong>in</strong>g economic growth. (Wagner,<br />
2012, 2010; Florida, 2002; Noppe-Brandon, Deasy, & Gitter, 2011; Eger, 2011).<br />
This grow<strong>in</strong>g body <strong>of</strong> studies and reports on the benefits <strong>of</strong> high-quality arts learn<strong>in</strong>g<br />
experiences underscores the need to monitor the status <strong>of</strong> arts education <strong>in</strong> <strong>Ohio</strong>’s<br />
public schools.<br />
<strong>Status</strong> <strong>of</strong> <strong>Arts</strong> <strong>Education</strong> <strong>in</strong> <strong>Ohio</strong>’s <strong>Public</strong> Schools 5
OHIO’S CODES, STANDARDS AND REQUIREMENTS: EXPECTATIONS FOR ARTS LEARNING<br />
Embedded <strong>in</strong> <strong>Ohio</strong>’s framework <strong>of</strong> educational codes, standards and requirements is the<br />
belief that strong arts <strong>in</strong>struction is an essential component <strong>of</strong> excellence <strong>in</strong> education. That<br />
policy framework guides and strengthens efforts to improve arts education <strong>in</strong> <strong>Ohio</strong>’s public<br />
schools.<br />
OHIO’S PRESCRIBED CURRICULUM<br />
<strong>The</strong> <strong>Ohio</strong> Revised Code <strong>in</strong>cludes the f<strong>in</strong>e arts <strong>in</strong> the state’s<br />
prescribed curriculum for traditional public schools<br />
(ORC §3313.60). <strong>The</strong> Operat<strong>in</strong>g Standards for <strong>Ohio</strong><br />
Schools (Chapter 3301.35 <strong>of</strong> the <strong>Ohio</strong> Adm<strong>in</strong>istrative<br />
Code) require each traditional public school and school<br />
district to implement a district-wide curriculum and<br />
<strong>in</strong>structional program <strong>in</strong> the f<strong>in</strong>e arts, <strong>in</strong>clud<strong>in</strong>g music.<br />
ODE provides a PDF version <strong>of</strong> the operat<strong>in</strong>g standards.<br />
Community schools are exempt from implement<strong>in</strong>g the<br />
prescribed curriculum and from follow<strong>in</strong>g the Operat<strong>in</strong>g<br />
Standards for <strong>Ohio</strong> Schools.<br />
<strong>The</strong> <strong>Ohio</strong> Revised Code (ORC) conta<strong>in</strong>s all<br />
acts passed by the <strong>Ohio</strong> General Assembly<br />
and signed by the governor. ORC §3301<br />
presents acts relevant to schools.<br />
Operat<strong>in</strong>g Standards for <strong>Ohio</strong> Schools are<br />
part <strong>of</strong> the <strong>Ohio</strong> Adm<strong>in</strong>istrative Code<br />
(OAC). <strong>The</strong> operat<strong>in</strong>g standards (OAC<br />
§3301.35) “establish specific expectations<br />
and provide additional guidel<strong>in</strong>es for school<br />
districts and schools to use <strong>in</strong> creat<strong>in</strong>g the<br />
best learn<strong>in</strong>g conditions for meet<strong>in</strong>g the<br />
personalized and <strong>in</strong>dividualized needs <strong>of</strong><br />
each student and achiev<strong>in</strong>g state and local<br />
educational goals and objectives.”<br />
LEARNING STANDARDS<br />
<strong>The</strong> <strong>Ohio</strong> Revised Code requires that the State Board <strong>of</strong> <strong>Education</strong> adopt and periodically revisit the<br />
state’s learn<strong>in</strong>g standards (ORC §3301.079). In June 2012, <strong>Ohio</strong>’s State Board <strong>of</strong> <strong>Education</strong> (SBE)<br />
adopted updated the learn<strong>in</strong>g standards for dance, drama/theatre, music and the visual arts. <strong>The</strong> updated<br />
standards provide a new framework that reflects the learn<strong>in</strong>g goals <strong>of</strong> the future while reta<strong>in</strong><strong>in</strong>g the<br />
content most valued from the arts standards <strong>Ohio</strong> adopted <strong>in</strong> 2003. <strong>The</strong> revised framework:<br />
• Includes reorganized grade clusters—K-2, 3-5, 6-8—and high school achievement levels.<br />
• Highlights how learn<strong>in</strong>g <strong>in</strong> the arts contributes to endur<strong>in</strong>g understand<strong>in</strong>gs, such as critical th<strong>in</strong>k<strong>in</strong>g,<br />
collaboration and literacy.<br />
• Guides <strong>in</strong>tegration <strong>of</strong> cognitive and creative learn<strong>in</strong>g processes—perceiv<strong>in</strong>g/know<strong>in</strong>g/creat<strong>in</strong>g;<br />
produc<strong>in</strong>g/perform<strong>in</strong>g; and respond<strong>in</strong>g/reflect<strong>in</strong>g.<br />
<strong><strong>Ohio</strong>'s</strong> arts learn<strong>in</strong>g standards are available at the ODE website for download<strong>in</strong>g.<br />
ASSESSMENT REQUIREMENTS<br />
<strong>Ohio</strong>’s operat<strong>in</strong>g standards require districts to provide for an assessment system that aligns with each <strong>of</strong><br />
their courses <strong>of</strong> study. <strong>The</strong> operat<strong>in</strong>g standards establish that teachers should assess student work<br />
regularly accord<strong>in</strong>g to accepted standards <strong>of</strong> practice <strong>in</strong> the selection, adm<strong>in</strong>istration, <strong>in</strong>terpretation and<br />
use <strong>of</strong> assessments (OAC §3301.35.04.G).<br />
<strong>Status</strong> <strong>of</strong> <strong>Arts</strong> <strong>Education</strong> <strong>in</strong> <strong>Ohio</strong>’s <strong>Public</strong> Schools 6
GIFTED EDUCATION REQUIREMENTS<br />
<strong>The</strong> <strong>Ohio</strong> Revised Code (ORC §3324.04)<br />
requires each district to adopt a plan for<br />
identify<strong>in</strong>g students who are gifted. <strong>The</strong><br />
Operat<strong>in</strong>g Standards for Identify<strong>in</strong>g and<br />
Serv<strong>in</strong>g Gifted Students def<strong>in</strong>e gifted students<br />
as “those who perform or show potential for<br />
perform<strong>in</strong>g at remarkably high levels <strong>of</strong><br />
accomplishment when compared to others <strong>of</strong><br />
their age, experience or environment.” <strong>The</strong><br />
standards <strong>in</strong>clude criteria for identify<strong>in</strong>g<br />
students as exhibit<strong>in</strong>g superior cognitive<br />
ability, specific academic ability superior to<br />
that <strong>of</strong> children <strong>of</strong> similar age <strong>in</strong> a specific<br />
academic ability field (<strong>in</strong>clud<strong>in</strong>g the arts) or<br />
creative th<strong>in</strong>k<strong>in</strong>g ability superior to children <strong>of</strong><br />
a similar age (OAC §3301-51-15).<br />
<strong>The</strong> standards for gifted education also<br />
<strong>in</strong>clude guidel<strong>in</strong>es for select<strong>in</strong>g and<br />
adm<strong>in</strong>ister<strong>in</strong>g assessments and<br />
<strong>in</strong>form<strong>in</strong>g parents about policies and<br />
assessment results.<br />
ODE has published fact sheets that<br />
answer questions about identify<strong>in</strong>g gifted<br />
students and serv<strong>in</strong>g gifted students<br />
through the use <strong>of</strong> educational options<br />
and virtual learn<strong>in</strong>g.<br />
Go to the ODE website to download the<br />
standards and fact sheets.<br />
Traditional public school districts are required by law to identify students who are gifted <strong>in</strong> grades K-<br />
12 based on specific criteria <strong>in</strong> law (ORC § 3324.03) and to report annually on the number <strong>of</strong> students<br />
screened, assessed and identified as gifted (ORC §3324.05). Community schools are not required by<br />
law to identify students who are gifted.<br />
<strong>Ohio</strong> law does not require public school districts or community schools to provide gifted education<br />
services to students who have been identified as gifted. <strong>The</strong> state standards for gifted education list<br />
examples <strong>of</strong> <strong>in</strong>structional sett<strong>in</strong>gs and services for gifted students (OAC §3301.51.15.D).<br />
STATE GRADUATION REQUIREMENTS<br />
Each traditional public school and community school student enter<strong>in</strong>g n<strong>in</strong>th grade after July 2010<br />
must complete two semesters or the equivalent <strong>of</strong> f<strong>in</strong>e arts to graduate from high school (ORC<br />
§3313.603 K). <strong>Arts</strong> courses completed <strong>in</strong> grades seven and eight can count toward the graduation<br />
requirements and can earn high school credit if taught by a teacher with a certificate or license that is<br />
valid for teach<strong>in</strong>g high school and approved by the local board <strong>of</strong> education or community school<br />
govern<strong>in</strong>g authority (ORC §3313.603.G).<br />
<strong>The</strong> ODE website <strong>in</strong>cludes<br />
frequently asked questions<br />
about the f<strong>in</strong>e arts<br />
graduation requirements.<br />
Although two semesters <strong>of</strong> arts courses completed <strong>in</strong> grades<br />
7 and 8 will count toward the graduation requirement,<br />
students will receive high school credit only for high school<br />
level courses (ORC §3313.603.K). High school students also<br />
can meet the requirement for five units <strong>of</strong> electives (ORC<br />
§3313.603.8) by complet<strong>in</strong>g courses <strong>in</strong> the f<strong>in</strong>e arts.<br />
<strong>Status</strong> <strong>of</strong> <strong>Arts</strong> <strong>Education</strong> <strong>in</strong> <strong>Ohio</strong>’s <strong>Public</strong> Schools 7
CREDIT FLEXIBILITY<br />
<strong>Ohio</strong> has adopted a policy <strong>of</strong> credit flexibility to<br />
<strong>in</strong>crease the number <strong>of</strong> students who are ready to<br />
meet the demands <strong>of</strong> our global and technological<br />
age. This opens new possibilities for arts learn<strong>in</strong>g.<br />
Accord<strong>in</strong>g to the <strong>Ohio</strong> Revised Code (ORC<br />
§3313.603J) students can earn units <strong>of</strong> high school<br />
credit based on a demonstration <strong>of</strong> subject area<br />
competency, <strong>in</strong>stead <strong>of</strong> or <strong>in</strong> comb<strong>in</strong>ation with<br />
complet<strong>in</strong>g hours <strong>of</strong> classroom <strong>in</strong>struction. <strong>Ohio</strong>’s<br />
operat<strong>in</strong>g standards <strong>in</strong>clude rules and guidel<strong>in</strong>es<br />
for implement<strong>in</strong>g this credit flexibility. Local<br />
boards <strong>of</strong> education are required to adopt credit<br />
flexibility policies and communicate the option<br />
annually to parents and students. <strong>The</strong> provision<br />
applies to both traditional public and community<br />
schools. <strong>Ohio</strong>’s plan for credit flexibility and other<br />
relevant guidance documents are available through<br />
the ODE website.<br />
Through credit flexibility, <strong>in</strong>dividual high<br />
school students <strong>in</strong> <strong>Ohio</strong> can propose<br />
their own plans for demonstrat<strong>in</strong>g<br />
subject area competency <strong>in</strong> ways other<br />
than traditional coursework.<br />
Students can replace or comb<strong>in</strong>e<br />
traditional coursework with <strong>in</strong>ternships,<br />
<strong>in</strong>dependent study projects, travel,<br />
community service and other<br />
nontraditional approaches.<br />
<strong>The</strong>y also can use credit flexibility to<br />
<strong>in</strong>tegrate their studies. For example, a<br />
student who earns a credit for writ<strong>in</strong>g<br />
and produc<strong>in</strong>g a play could use half <strong>of</strong><br />
that credit toward meet<strong>in</strong>g the f<strong>in</strong>e arts<br />
requirement and half toward meet<strong>in</strong>g the<br />
English requirement.<br />
EDUCATOR LICENSURE STANDARDS<br />
<strong>The</strong> <strong>Ohio</strong> Teacher <strong>Education</strong> and Licensure Standards are sections <strong>of</strong> the <strong>Ohio</strong> Adm<strong>in</strong>istrative Code<br />
(OAC §3301.24) and <strong>Ohio</strong> Revised Code (ORC §33.19.074) that establish requirements for educator<br />
licens<strong>in</strong>g. <strong>The</strong> standards <strong>in</strong>clude requirements for obta<strong>in</strong><strong>in</strong>g and ma<strong>in</strong>ta<strong>in</strong><strong>in</strong>g all available types <strong>of</strong><br />
educator licenses, certificates and permits issued by the <strong>Ohio</strong> Department <strong>of</strong> <strong>Education</strong>.<br />
<strong>The</strong> standards def<strong>in</strong>e appropriate licensure for a certified arts specialist:<br />
• A Multi-Age license <strong>in</strong> dance, drama/theatre, music or the visual arts valid for teach<strong>in</strong>g <strong>in</strong> grades<br />
prek<strong>in</strong>dergarten through twelve (3301.24.05.D.4).<br />
• An Adolescence to Young Adult license <strong>in</strong> one <strong>of</strong> those discipl<strong>in</strong>es valid for teach<strong>in</strong>g grades 7-12.<br />
Qualifications for arts specialists constitute at least an academic major or its equivalent with sufficient<br />
advanced coursework <strong>in</strong> all areas to be taught as specified by the teacher preparation <strong>in</strong>stitution and<br />
approved by ODE. <strong>Arts</strong> specialists also complete a m<strong>in</strong>imum <strong>of</strong> three semester hours focused on the<br />
teach<strong>in</strong>g <strong>of</strong> read<strong>in</strong>g <strong>in</strong> the content areas they teach. Teachers with Early Childhood licensure are<br />
considered qualified to teach the arts <strong>in</strong> grades pre-K-3. Teachers with Physical <strong>Education</strong> (7-12) licenses<br />
also can teach dance. Teachers with Integrated Language <strong>Arts</strong> licenses also can teach drama/theatre.<br />
Clearly, <strong>Ohio</strong>’s standards, requirements and codes provide a supportive framework for<br />
<strong>of</strong>fer<strong>in</strong>g high-quality arts education <strong>in</strong> <strong>Ohio</strong>’s public schools.<br />
<strong>Status</strong> <strong>of</strong> <strong>Arts</strong> <strong>Education</strong> <strong>in</strong> <strong>Ohio</strong>’s <strong>Public</strong> Schools 8
THE FOUNDATIONS OF QUALITY: SYSTEM SUPPORT FOR ARTS LEARNING<br />
While states provide a framework for high-quality arts education, studies <strong>of</strong> successful<br />
programs and practices establish how schools and districts create an environment that<br />
promotes excellence <strong>in</strong> arts teach<strong>in</strong>g and learn<strong>in</strong>g.<br />
<strong>The</strong> survey questions and exam<strong>in</strong>ation <strong>of</strong> ODE data that <strong>in</strong>formed this report reflect widely recognized<br />
national studies that def<strong>in</strong>e conditions and support for high-quality arts education. Those studies are<br />
presented <strong>in</strong> the follow<strong>in</strong>g publications:<br />
<strong>Arts</strong> <strong>Education</strong> <strong>in</strong> <strong>Public</strong> Elementary and Secondary Schools: 1999-2000 and 2009-<br />
10. This report from the National Center for <strong>Education</strong> Statistics (NCES) <strong>in</strong> the Institute <strong>of</strong><br />
<strong>Education</strong> Sciences (IES), U.S. Department <strong>of</strong> <strong>Education</strong>, provides national data on access to arts<br />
education and the conditions and personnel that <strong>in</strong>fluence the quality <strong>of</strong> arts <strong>in</strong>struction (Parsad &<br />
Spiegelman, 2012).<br />
Opportunity-to-Learn Standards for <strong>Arts</strong> <strong>Education</strong>. <strong>The</strong> Consortium <strong>of</strong> National <strong>Arts</strong><br />
<strong>Education</strong> Associations specify the physical and educational conditions necessary to enable every<br />
student, with sufficient effort, to meet the voluntary national content and achievement standards <strong>in</strong><br />
the arts (Consortium <strong>of</strong> National <strong>Arts</strong> <strong>Education</strong> Associations, 1995).<br />
Ga<strong>in</strong><strong>in</strong>g the <strong>Arts</strong> Advantage: Lessons from School Districts that Value <strong>Arts</strong><br />
<strong>Education</strong>. This 1999 report from the President’s Commission on <strong>Arts</strong> and Humanities (PCAH)<br />
cites opportunities and conditions that are “critical success factors” <strong>in</strong> high-quality arts education<br />
programs (President’s Commission on <strong>Arts</strong> and Humanities, 1999).<br />
Re<strong>in</strong>vest<strong>in</strong>g <strong>in</strong> the <strong>Arts</strong>: W<strong>in</strong>n<strong>in</strong>g America’s Future Through Creative Schools. <strong>The</strong><br />
2011 report <strong>of</strong> the PCAH reports that “opportunities are not equitably distributed among schools<br />
and the students they serve” and recommends some areas <strong>of</strong> <strong>in</strong>vestment that will maximize the<br />
benefits <strong>of</strong> arts education (President’s Commission on <strong>Arts</strong> and Humanities, 2011).<br />
<strong>The</strong> Qualities <strong>of</strong> Quality: Understand<strong>in</strong>g Excellence <strong>in</strong> <strong>Arts</strong> <strong>Education</strong>. Based on a study<br />
commissioned by the Wallace Foundation and conducted by Project Zero at the Harvard Graduate<br />
School <strong>of</strong> <strong>Education</strong>, this report exam<strong>in</strong>es “the complex factors, actors, and sett<strong>in</strong>gs that must be<br />
aligned to achieve quality <strong>in</strong> arts education” (Seidel, Tishman, W<strong>in</strong>ner, Hetland & Palmer, 2009).<br />
Improv<strong>in</strong>g the Assessment <strong>of</strong> Student Learn<strong>in</strong>g <strong>in</strong> the <strong>Arts</strong>: State <strong>of</strong> the Field and<br />
Recommendations. Based on a study commissioned by the National Endowment for the <strong>Arts</strong><br />
and conducted by WestEd, this report highlights the need for greater attention to arts assessment and<br />
discusses conditions vital for success <strong>in</strong> that area (Herp<strong>in</strong>, Wash<strong>in</strong>gton & Li, 2012).<br />
In other words, this report presents data on conditions and supports <strong>in</strong> <strong>Ohio</strong>’s public<br />
schools that are commonly thought to be contribut<strong>in</strong>g factors to the quality <strong>of</strong> arts<br />
education programs.<br />
<strong>Status</strong> <strong>of</strong> <strong>Arts</strong> <strong>Education</strong> <strong>in</strong> <strong>Ohio</strong>’s <strong>Public</strong> Schools 9
Table 1 shows how the areas assessed <strong>in</strong> <strong>Ohio</strong>’s study <strong>of</strong> ODE data and its <strong>Status</strong> Survey reflect those<br />
cited <strong>in</strong> the publications cited on page 9.<br />
Table 1: Quality Conditions and Supports Assessed <strong>in</strong> <strong>Ohio</strong>’s<br />
<strong>Status</strong> Survey Reflect National Studies<br />
Assessed <strong>in</strong><br />
<strong>Ohio</strong>’s <strong>Status</strong> <strong>of</strong><br />
<strong>Arts</strong> <strong>Education</strong><br />
Report<br />
NCES<br />
(2012)<br />
Opportunity<br />
to Learn<br />
Standards<br />
(1995)<br />
PCAH<br />
(1999)<br />
PCAH<br />
(2011)<br />
Project<br />
Zero<br />
(2009)<br />
WestEd<br />
(2012)<br />
Equitable Access to<br />
<strong>Arts</strong> <strong>Education</strong> √ √ √<br />
Teacher<br />
Qualifications √ √ √<br />
District <strong>Arts</strong><br />
√ √ √<br />
Coord<strong>in</strong>ator<br />
Variety/Sequential<br />
√ √<br />
Program <strong>of</strong> Study<br />
Use <strong>of</strong> Standards<br />
√ √ √<br />
<strong>Arts</strong> Assessment<br />
√ √ √ √ √<br />
Pr<strong>of</strong>essional<br />
√ √ √<br />
Development<br />
Dedicated Space<br />
√ √ √<br />
for <strong>Arts</strong> Learn<strong>in</strong>g<br />
Instructional Time<br />
√ √ √<br />
Services for Gifted<br />
√ √<br />
Students<br />
Specialized and AP<br />
√ √<br />
<strong>Arts</strong> Courses<br />
Use <strong>of</strong> Community<br />
√ √ √ √ √<br />
Assets<br />
Use <strong>of</strong> Teach<strong>in</strong>g<br />
Artists<br />
√ √ √ √<br />
A Vision and/or Plan<br />
√ √ √<br />
Adequate F<strong>in</strong>ancial<br />
Resources<br />
√ √ √ √<br />
<strong>Status</strong> <strong>of</strong> <strong>Arts</strong> <strong>Education</strong> <strong>in</strong> <strong>Ohio</strong>’s <strong>Public</strong> Schools 10
REPORT SUMMARY<br />
F<strong>in</strong>d<strong>in</strong>gs based on ODE data and the <strong>Status</strong> Survey are presented <strong>in</strong> three subsections:<br />
Ensur<strong>in</strong>g Access and Equity: <strong>The</strong> extent to which arts <strong>in</strong>struction is available <strong>in</strong> and<br />
distributed among <strong>Ohio</strong>’s public schools and districts.<br />
Creat<strong>in</strong>g Conditions for High Quality: <strong>The</strong> extent<br />
to which schools and districts understand and foster<br />
the conditions that support high-quality arts<br />
<strong>in</strong>struction.<br />
Susta<strong>in</strong><strong>in</strong>g <strong>Arts</strong> <strong>Education</strong>: <strong>The</strong> extent to which<br />
<strong>Ohio</strong>’s public school students, districts, arts<br />
educators, parents and communities engage <strong>in</strong><br />
actions that susta<strong>in</strong> arts education.<br />
Courtesy: OAC Poetry Out Loud<br />
Based on ODE and <strong>Status</strong> Survey data, the key f<strong>in</strong>d<strong>in</strong>gs presented <strong>in</strong> this<br />
report are as follows:<br />
1. N<strong>in</strong>ety-three percent <strong>of</strong> all <strong>Ohio</strong> public schools provided access to some arts<br />
<strong>in</strong>struction <strong>in</strong> 2009-2010.<br />
• Of that 93 percent, students <strong>in</strong> 97 percent <strong>of</strong> traditional public schools and 61<br />
percent <strong>of</strong> the 246 community schools had arts <strong>in</strong>struction.<br />
• Ten percent <strong>of</strong> major urban public schools provided no access to the arts.<br />
• Approximately 54,700 students <strong>in</strong> <strong>Ohio</strong>’s public schools did not have access<br />
to arts <strong>in</strong>struction <strong>in</strong> school dur<strong>in</strong>g 2009-2010.<br />
2. Access to dance and drama/theatre was limited <strong>in</strong> <strong>Ohio</strong>’s K-12 public schools:<br />
• Four percent <strong>of</strong> elementary, 1 percent <strong>of</strong> middle and 7 percent <strong>of</strong> high schools<br />
<strong>of</strong>fered <strong>in</strong>struction <strong>in</strong> dance.<br />
• Two percent <strong>of</strong> elementary, 6 percent <strong>of</strong> middle and 39 percent <strong>of</strong> high<br />
schools <strong>of</strong>fered <strong>in</strong>struction <strong>in</strong> drama/theatre.<br />
Courtesy: Mary Sheridan, Picker<strong>in</strong>gton Local Schools<br />
Courtesy: Holly Pratt, <strong>Arts</strong> Learn<strong>in</strong>g Residency<br />
<strong>Status</strong> <strong>of</strong> <strong>Arts</strong> <strong>Education</strong> <strong>in</strong> <strong>Ohio</strong>’s <strong>Public</strong> Schools 11
3. Access to gifted education services <strong>in</strong> the arts also was limited:<br />
• Forty-two percent <strong>of</strong> schools reported that they identified students gifted <strong>in</strong> the<br />
visual and perform<strong>in</strong>g arts.<br />
• Of the 19,771 students identified as gifted, 1,048 received gifted education services.<br />
4. Many <strong>of</strong> the conditions that facilitate high-quality arts <strong>in</strong>struction were widely present<br />
<strong>in</strong> <strong>Ohio</strong>’s schools <strong>in</strong> 2009-2010<br />
• Eighty-three percent <strong>of</strong> <strong>Ohio</strong> arts educators were licensed <strong>in</strong> the discipl<strong>in</strong>es they<br />
taught.<br />
• N<strong>in</strong>ety percent <strong>of</strong> public schools reported implement<strong>in</strong>g <strong>Ohio</strong>’s arts learn<strong>in</strong>g<br />
standards and 94 percent reported assess<strong>in</strong>g their students <strong>in</strong> the arts.<br />
• Sixty-four percent <strong>of</strong> schools provided teacher pr<strong>of</strong>essional development <strong>in</strong> the arts.<br />
5. Use <strong>of</strong> dedicated facilities and equipment for arts <strong>in</strong>struction varied by arts discipl<strong>in</strong>e<br />
and <strong>in</strong>creased <strong>in</strong> both the middle school and high school levels.<br />
6. Seventy-eight percent <strong>of</strong> schools reported that no one at the district level was<br />
responsible for implement<strong>in</strong>g and evaluat<strong>in</strong>g arts programs.<br />
7. Student enrollment <strong>in</strong> the arts dropped sharply <strong>in</strong> high school. Median high school<br />
arts enrollment was below 30 percent <strong>in</strong> 2009-2010.<br />
8. Student enrollment <strong>in</strong> the arts varied across district types. Students <strong>in</strong> high-<strong>in</strong>come<br />
districts participated at lower rates than those <strong>in</strong> high-poverty districts.<br />
Each subsection concludes with a comparison <strong>of</strong> the <strong>Ohio</strong> results with those presented <strong>in</strong><br />
<strong>Arts</strong> <strong>Education</strong> <strong>in</strong> <strong>Public</strong> Elementary and Secondary Schools: 1999-2000 and 2009-10, a<br />
report from the National Center for <strong>Education</strong> Statistics (NCES).<br />
<strong>Status</strong> <strong>of</strong> <strong>Arts</strong> <strong>Education</strong> <strong>in</strong> <strong>Ohio</strong>’s <strong>Public</strong> Schools 12<br />
Courtesy (clockwise from top left): Jazz <strong>Arts</strong> Group <strong>of</strong> Columbus, <strong>Arts</strong><br />
Learn<strong>in</strong>g Residency; Michelle Pajak-Reynolds, <strong>Arts</strong> Learn<strong>in</strong>g Residency;<br />
Cleveland Municipal School District
ENSURING ACCESS AND EQUITY<br />
Measur<strong>in</strong>g the status <strong>of</strong> arts education beg<strong>in</strong>s with access—how available arts <strong>in</strong>struction is<br />
overall—and equity—how the availability <strong>of</strong> arts learn<strong>in</strong>g opportunities differs when schools are<br />
grouped by geographical, demographic and <strong>in</strong>come characteristics.<br />
Most <strong>Ohio</strong> students had access to arts <strong>in</strong>struction <strong>in</strong> 2009-2010, yet only a small<br />
percentage <strong>of</strong> <strong>Ohio</strong>’s public schools <strong>of</strong>fered more than two arts discipl<strong>in</strong>es.<br />
• As stated earlier, 93 percent <strong>of</strong> <strong>Ohio</strong>’s public schools provided<br />
arts <strong>in</strong>struction <strong>in</strong> the 2009-2010 school year. When broken<br />
down by school type, 97 percent <strong>of</strong> traditional public schools<br />
and 61 percent <strong>of</strong> community schools provided arts <strong>in</strong>struction.<br />
• About 54,700 <strong>of</strong> <strong>Ohio</strong>’s 1.8 million students did not have access to arts courses.<br />
• One percent <strong>of</strong> <strong>Ohio</strong>’s public schools <strong>of</strong>fered <strong>in</strong>struction <strong>in</strong> all four discipl<strong>in</strong>es.<br />
<strong>Ohio</strong>’s traditional public schools <strong>of</strong>fered arts <strong>in</strong>struction at every grade level with arts<br />
<strong>of</strong>fer<strong>in</strong>gs clustered around music and visual arts.<br />
• Among <strong>Ohio</strong>’s traditional public schools, 84 percent <strong>of</strong>fered arts <strong>in</strong>struction <strong>in</strong> music and<br />
visual arts.<br />
• Among <strong>Ohio</strong>’s 612 school districts, 87 percent <strong>of</strong>fered <strong>in</strong>struction at every grade level <strong>in</strong><br />
at least one discipl<strong>in</strong>e.<br />
Accord<strong>in</strong>g to 2009-2010 ODE data, some significant arts education <strong>in</strong>terests and needs<br />
were not widely met <strong>in</strong> <strong>Ohio</strong>.<br />
• Less than 2 percent <strong>of</strong> the <strong>Ohio</strong> public schools with arts courses <strong>of</strong>fered dance courses.<br />
N<strong>in</strong>e percent <strong>of</strong> those schools <strong>of</strong>fered drama/theatre courses.<br />
• Enrollment <strong>in</strong> dance and drama/theatre courses was less than 2 percent <strong>of</strong> students.<br />
• Fifty-eight percent <strong>of</strong> <strong>Ohio</strong>’s public schools did not identify students gifted <strong>in</strong> the arts as<br />
required by <strong>Ohio</strong> law. <strong>Ohio</strong>’s public schools identified 19,771 students as gifted <strong>in</strong> the<br />
arts. Schools provided gifted education services <strong>in</strong> the arts to 1,048 <strong>of</strong> those students.<br />
Compar<strong>in</strong>g 2009-2010 results from the <strong>Ohio</strong> and the National Center for <strong>Education</strong><br />
Statistics (NCES) studies shows only slight differences <strong>in</strong> access and equity.<br />
• Access to music and visual arts was slightly better <strong>in</strong> <strong>Ohio</strong> than it was nationally.<br />
• Access to dance and drama/theatre was less common <strong>in</strong> <strong>Ohio</strong> than it was nationally.<br />
• <strong>The</strong> gap <strong>in</strong> access between poor and wealthy districts was somewhat narrower <strong>in</strong> <strong>Ohio</strong><br />
than it was nationally.<br />
Note: NCES did not collect data on gifted education <strong>in</strong> the arts.<br />
See page 19 for<br />
detailed <strong>in</strong>formation on<br />
access and equity.<br />
<strong>Status</strong> <strong>of</strong> <strong>Arts</strong> <strong>Education</strong> <strong>in</strong> <strong>Ohio</strong>’s <strong>Public</strong> Schools 13
CREATING CONDITIONS FOR HIGH-QUALITY ARTS INSTRUCTION<br />
Schools can create conditions that facilitate high-quality arts <strong>in</strong>struction.<br />
Most teachers provid<strong>in</strong>g arts <strong>in</strong>struction <strong>in</strong> <strong>Ohio</strong>’s public schools were appropriately<br />
licensed.<br />
• ODE data and <strong>Status</strong> Survey data <strong>in</strong>dicate that all arts<br />
courses <strong>in</strong> 83 percent <strong>of</strong> <strong>Ohio</strong>’s public schools were<br />
taught by educators licensed to teach one or more arts<br />
discipl<strong>in</strong>es.<br />
• Use <strong>of</strong> visit<strong>in</strong>g artists and teachers from other subject<br />
areas was more common for courses <strong>in</strong> dance and<br />
drama/theatre than for music and visual arts courses.<br />
See page 31 for detailed<br />
<strong>in</strong>formation on the<br />
prevalence <strong>of</strong> some key<br />
conditions that support<br />
quality arts <strong>in</strong>struction.<br />
Most schools follow <strong>Ohio</strong>’s arts learn<strong>in</strong>g standards and assess student learn<strong>in</strong>g <strong>in</strong><br />
the arts.<br />
• N<strong>in</strong>ety percent <strong>of</strong> <strong>Status</strong> Survey respondents reported that their arts curricula were<br />
aligned with <strong>Ohio</strong>’s arts learn<strong>in</strong>g standards and 94 percent reported us<strong>in</strong>g arts<br />
assessments.<br />
• Survey results show that teacher-developed arts assessments were the norm <strong>in</strong> 84<br />
percent <strong>of</strong> schools. Less than 10 percent <strong>of</strong> schools reported us<strong>in</strong>g district- or<br />
vendor-developed assessments.<br />
Many <strong>Ohio</strong> public schools provided teacher pr<strong>of</strong>essional development <strong>in</strong> the arts and<br />
recognized the need to provide arts educators with dedicated arts classrooms.<br />
Accord<strong>in</strong>g to <strong>Status</strong> Survey results:<br />
• Teachers participated <strong>in</strong> pr<strong>of</strong>essional development <strong>in</strong> the arts <strong>in</strong> nearly two-thirds<br />
<strong>of</strong> <strong>Ohio</strong>’s public schools.<br />
• Seventy percent <strong>of</strong> K-8 schools and 80 percent <strong>of</strong> high schools had dedicated arts<br />
classrooms.<br />
• A district arts coord<strong>in</strong>ator was available to 22 percent <strong>of</strong> the schools surveyed.<br />
Compar<strong>in</strong>g 2009-2010 results from the <strong>Ohio</strong> and NCES studies shows three notable<br />
differences <strong>in</strong> quality conditions.<br />
• Alignment with arts learn<strong>in</strong>g standards was more prevalent <strong>in</strong> <strong>Ohio</strong> than it was<br />
nationally.<br />
• District-level arts coord<strong>in</strong>ators were less prevalent <strong>in</strong> <strong>Ohio</strong> than they were nationally.<br />
• In all but high school music, the use <strong>of</strong> technology <strong>in</strong> arts classrooms was less<br />
prevalent <strong>in</strong> <strong>Ohio</strong> than it was nationally.<br />
<strong>Status</strong> <strong>of</strong> <strong>Arts</strong> <strong>Education</strong> <strong>in</strong> <strong>Ohio</strong>’s <strong>Public</strong> Schools 14
SUSTAINING ARTS EDUCATION<br />
Student participation, school and district policies, arts educator roles and the resources schools,<br />
districts, parents and community groups provide help ma<strong>in</strong>ta<strong>in</strong> strong arts education programs.<br />
Elementary and middle schools had high participation rates <strong>in</strong> music and visual arts <strong>in</strong><br />
2009-2010. <strong>The</strong> high school participation rate for those subjects was less than a third <strong>of</strong><br />
students.<br />
• Median enrollment <strong>in</strong> music among <strong>Ohio</strong>’s public schools was<br />
61 percent <strong>in</strong> 2009-2010. It was 48 percent for the visual arts.<br />
• Median enrollment <strong>in</strong> music and the visual arts exceeded 95<br />
percent <strong>in</strong> elementary school and 85 percent <strong>in</strong> middle school.<br />
• Median enrollment at the high school level was 21 percent for<br />
music and 28 percent for the visual arts.<br />
In most schools, graduation requirements, the weights assigned to arts courses and the<br />
role <strong>of</strong> arts educators <strong>in</strong> school improvement support strong arts programs.<br />
• Seventy-n<strong>in</strong>e percent <strong>of</strong> high schools respond<strong>in</strong>g to the <strong>Status</strong> Survey said they<br />
required students to complete at least one credit <strong>in</strong> the arts <strong>in</strong> order to graduate.<br />
• Eighty-four percent <strong>of</strong> high schools surveyed said they assigned the same weight to<br />
grades earned <strong>in</strong> arts courses as they did to grades earned <strong>in</strong> other academic courses.<br />
• Seventy-four percent <strong>of</strong> schools reported that their school improvement teams<br />
<strong>in</strong>cluded arts educators.<br />
School budget allocations for arts education <strong>in</strong> 2009-2010 varied widely.<br />
See page 49 for detailed<br />
<strong>in</strong>formation on student<br />
arts enrollment and the<br />
systemic factors that<br />
may affect participation.<br />
• Exclud<strong>in</strong>g teacher salaries, the median per-student budget by school type was $3.00<br />
for elementary schools; $4.67 for middle schools; and $9.16 for high schools. <strong>The</strong><br />
study did not obta<strong>in</strong> comparative data for other subjects.<br />
• Among high schools, 57 percent budgeted over $5,000 for arts education, while 22<br />
percent <strong>of</strong> middle schools and 11 percent <strong>of</strong> elementary schools budgeted at that level.<br />
NCES did not provide data on high school arts enrollment or budgets. <strong>The</strong> 2009-2010<br />
NCES data showed some differences <strong>in</strong> policies and roles affect<strong>in</strong>g arts education.<br />
• <strong>Ohio</strong> had a higher percentage <strong>of</strong> high schools with graduation requirements that<br />
<strong>in</strong>cluded at least one credit <strong>in</strong> the arts than did the national sample.<br />
• Only 18 <strong>Ohio</strong> schools assigned a lower weight to arts courses than to other courses <strong>of</strong><br />
similar length, but the practice was even less prevalent nationally.<br />
• Includ<strong>in</strong>g arts specialists on school improvement teams was less prevalent <strong>in</strong> <strong>Ohio</strong>’s<br />
public high schools than <strong>in</strong> high schools nationally (74% vs. 88%).<br />
<strong>Status</strong> <strong>of</strong> <strong>Arts</strong> <strong>Education</strong> <strong>in</strong> <strong>Ohio</strong>’s <strong>Public</strong> Schools 15
Courtesy: OAC Poetry Out Loud<br />
Courtesy: Toddler Rock, Rock and Roll Hall <strong>of</strong> Fame<br />
Courtesy: Greater Columbus <strong>Arts</strong> <strong>Council</strong><br />
Courtesy: Columbus Asian Festival<br />
Courtesy: Youngstown SMARTS Program<br />
<strong>Status</strong> <strong>of</strong> <strong>Arts</strong> <strong>Education</strong> <strong>in</strong> <strong>Ohio</strong>’s <strong>Public</strong> Schools 16
FINDINGS AND ANALYSIS<br />
WHAT DO THE DATA SAY? HOW DOES OHIO COMPARE?<br />
Results from the <strong>Status</strong> Survey and analysis <strong>of</strong> ODE data provide a general picture <strong>of</strong> the status<br />
<strong>of</strong> arts education <strong>in</strong> <strong>Ohio</strong>’s public schools and the challenges that rema<strong>in</strong> to be met. F<strong>in</strong>d<strong>in</strong>gs are<br />
presented <strong>in</strong> three ma<strong>in</strong> subsections: 1) Ensur<strong>in</strong>g Access and Equity, 2) Creat<strong>in</strong>g Conditions for<br />
High Quality and 3) Susta<strong>in</strong><strong>in</strong>g <strong>Arts</strong> <strong>Education</strong>.<br />
Each subsection conta<strong>in</strong>s the follow<strong>in</strong>g components:<br />
• An open<strong>in</strong>g summary <strong>of</strong> results.<br />
• <strong>The</strong> <strong>Status</strong> Survey results and <strong>in</strong>formation from Quadrant’s<br />
analysis <strong>of</strong> ODE data with key f<strong>in</strong>d<strong>in</strong>gs highlighted.<br />
• Charts to help visualize the data and tables to provide more<br />
detail.<br />
• A brief comparison <strong>of</strong> <strong>Ohio</strong>’s results and those presented <strong>in</strong> a<br />
2009-2010 arts education status report for the nation issued by<br />
the National Center for <strong>Education</strong> Statistics.<br />
• A set <strong>of</strong> priorities based on the f<strong>in</strong>d<strong>in</strong>gs.<br />
Table 2 on the next page provides a quick guide for locat<strong>in</strong>g<br />
topics <strong>of</strong> specific <strong>in</strong>terest.<br />
Sources for the national data<br />
are <strong>Arts</strong> <strong>Education</strong> <strong>in</strong> <strong>Public</strong><br />
Elementary and Secondary<br />
Schools: 1999–2000 and<br />
2009–10 (NCES 2012-14)<br />
and the supplemental tables to<br />
that report.<br />
<strong>The</strong> <strong>Ohio</strong> study used three<br />
school types, classify<strong>in</strong>g<br />
schools with grades 6-8 as<br />
middle schools. <strong>The</strong> NCES<br />
survey grouped schools as<br />
elementary schools (grades K-<br />
8) and secondary schools<br />
(grades 9-12). <strong>The</strong>refore,<br />
<strong>Ohio</strong>’s results for elementary<br />
and middle schools are<br />
averaged when compared to<br />
NCES results.<br />
Courtesy: <strong>Arts</strong> Commission <strong>of</strong> Greater Toledo<br />
<strong>Status</strong> <strong>of</strong> <strong>Arts</strong> <strong>Education</strong> <strong>in</strong> <strong>Ohio</strong>’s <strong>Public</strong> Schools 17
Table 2: Quick Guide to F<strong>in</strong>d<strong>in</strong>gs By Section<br />
To make navigation easier, a different color is<br />
used to dist<strong>in</strong>guish each section <strong>of</strong> the f<strong>in</strong>d<strong>in</strong>gs.<br />
Page<br />
Ensur<strong>in</strong>g Access and Equity 19 <strong>Arts</strong> specialists on staff 35<br />
Access to <strong>in</strong>struction <strong>in</strong> any arts discipl<strong>in</strong>e 19 Number <strong>of</strong> schools served by arts specialists 35<br />
Traditional public schools 20 Average number <strong>of</strong> students per course 36<br />
Community schools<br />
Schools <strong>in</strong> each <strong>of</strong> the eight district<br />
typologies<br />
Number <strong>of</strong> arts discipl<strong>in</strong>es provided (traditional<br />
public and community schools)<br />
20 Difference <strong>in</strong> number <strong>of</strong> arts educators across<br />
district types<br />
Page<br />
20 Number <strong>of</strong> unique courses taught 38<br />
21 Prevalence <strong>of</strong> district-level arts coord<strong>in</strong>ation 38<br />
Low access to dance and drama/theatre 22 Supplemental support 38<br />
37<br />
Percentages <strong>of</strong> students without access by<br />
discipl<strong>in</strong>e<br />
22 Instructional time 39<br />
Differences <strong>in</strong> number <strong>of</strong> arts discipl<strong>in</strong>es taught<br />
by district type<br />
23<br />
Dedicated classrooms and equipment 40<br />
Use <strong>of</strong> technology 41<br />
Access to sequential arts <strong>in</strong>struction 24 Use <strong>of</strong> community assets 42<br />
Variety <strong>of</strong> arts courses 24 Comparison with national results 43<br />
Access to gifted education <strong>in</strong> the arts 27 Susta<strong>in</strong><strong>in</strong>g <strong>Arts</strong> <strong>Education</strong> 49<br />
Access to extracurricular arts <strong>in</strong>struction 27 Median arts enrollment for all students 49<br />
Comparison with national results 28 Enrollment rates by district type 50<br />
Creat<strong>in</strong>g Conditions for High Quality 31 High school participation rates 51<br />
Implementation <strong>of</strong> standards 31 Graduation requirements and course weight<strong>in</strong>g 51<br />
Assessment 32 Role <strong>of</strong> arts education <strong>in</strong> school improvement 52<br />
Teacher licensure 32 Budget<strong>in</strong>g for arts education 52<br />
Pr<strong>of</strong>essional development 34 Comparison with national results 54<br />
<strong>Status</strong> <strong>of</strong> <strong>Arts</strong> <strong>Education</strong> <strong>in</strong> <strong>Ohio</strong>’s <strong>Public</strong> Schools 18
ENSURING ACCESS AND EQUITY<br />
<strong>Public</strong> schools and districts committed to access and equity <strong>in</strong><br />
arts education strive to do the follow<strong>in</strong>g:<br />
• Reach all students, regardless <strong>of</strong> location,<br />
socioeconomics or district size.<br />
• Provide learn<strong>in</strong>g opportunities <strong>in</strong> all four arts discipl<strong>in</strong>es.<br />
• Ensure sequential <strong>in</strong>struction <strong>in</strong> the arts from<br />
k<strong>in</strong>dergarten through grade 12.<br />
• Offer courses that address students’ <strong>in</strong>terests and<br />
challenge them to advance and grow.<br />
F<strong>in</strong>d<strong>in</strong>gs from the 2010 <strong>Status</strong> Survey, considered alongside<br />
<strong>Ohio</strong> Department <strong>of</strong> <strong>Education</strong> (ODE) data from 2009-2010,<br />
provide <strong>in</strong>formation about <strong>Ohio</strong>’s status <strong>in</strong> each <strong>of</strong> those areas.<br />
Courtesy: C<strong>in</strong>c<strong>in</strong>nati Symphony<br />
FINDINGS: WHAT DO THE DATA SAY?<br />
Summary: A high percentage <strong>of</strong> <strong>Ohio</strong>’s public school students have access to 13 years <strong>of</strong> <strong>in</strong>struction <strong>in</strong><br />
two <strong>of</strong> the four f<strong>in</strong>e arts discipl<strong>in</strong>es addressed <strong>in</strong> <strong>Ohio</strong>’s arts learn<strong>in</strong>g standards, namely music and visual<br />
arts. Access to <strong>in</strong>struction <strong>in</strong> the two other discipl<strong>in</strong>es, dance and drama/theatre, is limited. <strong>The</strong> highest<br />
percentages <strong>of</strong> schools that did not <strong>of</strong>fer access to the arts were among community schools and traditional<br />
public schools <strong>in</strong> major urban school districts with very high poverty.<br />
PROVIDING ARTS LEARNING OPPORTUNITIES FOR ALL STUDENTS<br />
Access to arts education beg<strong>in</strong>s with ongo<strong>in</strong>g arts<br />
learn<strong>in</strong>g opportunities dur<strong>in</strong>g the school day for<br />
every student.<br />
Accord<strong>in</strong>g to ODE data, 93 percent <strong>of</strong> <strong>Ohio</strong>’s public schools<br />
<strong>of</strong>fer access to some arts <strong>in</strong>struction.<br />
Figure 1: Access to the <strong>Arts</strong> <strong>in</strong><br />
<strong><strong>Ohio</strong>'s</strong> Traditional <strong>Public</strong> Schools<br />
No Access to<br />
<strong>Arts</strong> Instruction<br />
7%<br />
Key F<strong>in</strong>d<strong>in</strong>g: Schools report<strong>in</strong>g zero access to the<br />
arts serve approximately 54,700 <strong>of</strong> <strong>Ohio</strong>’s 1.8<br />
million public school students.<br />
Access to<br />
Some <strong>Arts</strong><br />
Instruction<br />
93%<br />
<strong>Status</strong> <strong>of</strong> <strong>Arts</strong> <strong>Education</strong> <strong>in</strong> <strong>Ohio</strong>’s <strong>Public</strong> Schools 19
Key F<strong>in</strong>d<strong>in</strong>g: Complete lack <strong>of</strong> access to arts education dur<strong>in</strong>g the school day is more<br />
prevalent among <strong>Ohio</strong>’s community schools and major urban districts.<br />
Thirty-n<strong>in</strong>e percent <strong>of</strong> the community schools that<br />
reported enrollment data to ODE <strong>in</strong> 2009-2010 had zero<br />
students enrolled <strong>in</strong> arts courses compared to 3 percent<br />
<strong>of</strong> traditional public schools (Figure 2). Moreover, 19<br />
percent <strong>of</strong> community schools reported enrollment <strong>in</strong><br />
only one arts discipl<strong>in</strong>e compared to 4 percent <strong>of</strong><br />
traditional public schools.<br />
Community schools are authorized to<br />
operate under a different section <strong>of</strong> law<br />
(ORC §3314) and do not have a<br />
prescribed curriculum or a<br />
requirement to provide <strong>in</strong>struction <strong>in</strong><br />
the f<strong>in</strong>e arts.<br />
Figure 2: Percentage <strong>of</strong> Schools with at Least One Student Enrolled <strong>in</strong> an <strong>Arts</strong> Course<br />
Community Schools<br />
61%<br />
Traditional <strong>Public</strong> Schools<br />
97%<br />
0% 10% 20% 30% 40% 50% 60% 70% 80% 90% 100%<br />
As Table 3 shows, most high-poverty schools provide access to arts education, but 10 percent <strong>of</strong><br />
schools <strong>in</strong> major urban districts with very high poverty (Type 5) reported zero students enrolled<br />
<strong>in</strong> the arts.<br />
Table 3: Access To <strong>Arts</strong> <strong>Education</strong> By School Type<br />
<strong>Ohio</strong>’s <strong>Public</strong> School District Types<br />
<strong>Arts</strong><br />
Enrollment<br />
1. Rural/Agricultural – high poverty, low median <strong>in</strong>come 98%<br />
2. Rural/Agricultural – small student population, low poverty, lowto-moderate<br />
median <strong>in</strong>come<br />
98%<br />
3. Rural/Small Town – moderate-to-high median <strong>in</strong>come 97%<br />
4. Urban – low median <strong>in</strong>come, high poverty 97%<br />
5. Major Urban – very high poverty 90%<br />
6. Urban/Suburban – high median <strong>in</strong>come 98%<br />
7. Urban/Suburban – very high median <strong>in</strong>come, very low poverty 92%<br />
8. Unclassified schools 79%<br />
<strong>Status</strong> <strong>of</strong> <strong>Arts</strong> <strong>Education</strong> <strong>in</strong> <strong>Ohio</strong>’s <strong>Public</strong> Schools 20
PROVIDING INSTRUCTION IN ALL ARTS DISCIPLINES<br />
Access to arts education <strong>in</strong>cludes opportunities for all <strong>Ohio</strong> students to study<br />
music, dance, the visual arts and drama/theatre.<br />
Accord<strong>in</strong>g to ODE data, 93 percent <strong>of</strong> schools reported <strong>of</strong>fer<strong>in</strong>g <strong>in</strong>struction <strong>in</strong> two or more arts<br />
discipl<strong>in</strong>es <strong>in</strong> the 2009-2010 school year (Figure 3). One percent <strong>of</strong>fered <strong>in</strong>struction <strong>in</strong> all four<br />
discipl<strong>in</strong>es. Less than half <strong>of</strong> the 246 community schools <strong>in</strong>cluded <strong>in</strong> the analysis provided two or<br />
more discipl<strong>in</strong>es. Music and visual arts are the <strong>of</strong>fer<strong>in</strong>gs among 99 percent <strong>of</strong> the schools with<br />
two arts discipl<strong>in</strong>es.<br />
Accord<strong>in</strong>g to the <strong>Status</strong> Survey:<br />
• N<strong>in</strong>ety-seven percent <strong>of</strong> elementary, 97 percent <strong>of</strong> middle and 97 percent <strong>of</strong> high schools<br />
<strong>of</strong>fered <strong>in</strong>struction <strong>in</strong> music.<br />
• Eighty-eight percent <strong>of</strong> elementary and 93 percent <strong>of</strong> middle schools <strong>of</strong>fered <strong>in</strong>struction <strong>in</strong> the<br />
visual arts while 98 percent <strong>of</strong> high schools <strong>of</strong>fered <strong>in</strong>struction <strong>in</strong> the visual arts.<br />
• Four percent <strong>of</strong> elementary, 1 percent <strong>of</strong> middle and 7 percent <strong>of</strong> high schools <strong>of</strong>fered<br />
<strong>in</strong>struction <strong>in</strong> dance.<br />
• Two percent <strong>of</strong> elementary, 6 percent <strong>of</strong> middle and 39 percent <strong>of</strong> high schools <strong>of</strong>fered<br />
<strong>in</strong>struction <strong>in</strong> drama/theatre.<br />
Key F<strong>in</strong>d<strong>in</strong>g: Most schools <strong>of</strong>fer <strong>in</strong>struction <strong>in</strong> two arts discipl<strong>in</strong>es.<br />
Figure 3: Number <strong>of</strong> <strong>Arts</strong> Discipl<strong>in</strong>es Offered <strong>in</strong><br />
Traditional <strong>Public</strong> and Community Schools<br />
100%<br />
90%<br />
80%<br />
84%<br />
70%<br />
60%<br />
50%<br />
40%<br />
39%<br />
36%<br />
30%<br />
20%<br />
10%<br />
0%<br />
19%<br />
4% 4%<br />
8%<br />
5%<br />
1% 1%<br />
Zero Discipl<strong>in</strong>es One Discipl<strong>in</strong>e Two Discipl<strong>in</strong>es Three Discipl<strong>in</strong>es Four Discipl<strong>in</strong>es<br />
<strong>Public</strong> Schools<br />
Community Schools<br />
<strong>Status</strong> <strong>of</strong> <strong>Arts</strong> <strong>Education</strong> <strong>in</strong> <strong>Ohio</strong>’s <strong>Public</strong> Schools 21
Key F<strong>in</strong>d<strong>in</strong>g: Dance and drama/theatre are seldom taught <strong>in</strong> <strong>Ohio</strong>’s public schools.<br />
A total <strong>of</strong> 86 courses <strong>in</strong> dance and<br />
413 courses <strong>in</strong> drama/theatre<br />
were taught <strong>in</strong> <strong>Ohio</strong>’s public<br />
schools <strong>in</strong> 2009-2010,<br />
compared to 10,068 <strong>in</strong> visual<br />
arts and 9,682 <strong>in</strong> music.<br />
Figure 4: Total Teachers by Discipl<strong>in</strong>e and School Level<br />
4000<br />
3,725<br />
3000 2,741 2,746<br />
<strong>The</strong> ODE data showed a total <strong>of</strong><br />
10,673 <strong>Ohio</strong> teachers who<br />
provided <strong>in</strong>struction <strong>in</strong> one or<br />
more arts discipl<strong>in</strong>es. Of those<br />
teachers, 64 taught dance, and<br />
390 taught drama/theatre. In<br />
contrast, 6,075 taught visual<br />
arts and 4,724 taught music.<br />
Figure 4 shows the numbers <strong>of</strong><br />
teachers by discipl<strong>in</strong>e and<br />
school level.<br />
2000<br />
1000<br />
0<br />
1,854 1,777 1,817<br />
291<br />
17 29 20 70 27<br />
Elementary Middle High<br />
Dance<br />
Music<br />
Figure 5 shows what those numbers<br />
mean <strong>in</strong> terms <strong>of</strong> students. Each bar<br />
represents the percentage <strong>of</strong> students who<br />
do NOT have access to <strong>in</strong>struction <strong>in</strong><br />
each discipl<strong>in</strong>e.<br />
Teachers are counted more than once if they work <strong>in</strong><br />
schools that comb<strong>in</strong>e elementary, middle, and high<br />
school grades or if they teach <strong>in</strong> multiple schools.<br />
Figure 5: Percentage <strong>of</strong> Students WITHOUT<br />
Access to Courses <strong>in</strong> Each Discipl<strong>in</strong>e*<br />
% <strong>of</strong> Students<br />
100%<br />
90%<br />
80%<br />
70%<br />
60%<br />
50%<br />
40%<br />
30%<br />
20%<br />
10%<br />
0%<br />
98%<br />
83%<br />
5%<br />
5%<br />
Dance Music Drama/<strong>The</strong>atre Visual <strong>Arts</strong><br />
# Without Access: 1,691,302 85,636 1,442,821 91,204<br />
*Course enrollment is a duplicated count. Enrollment for each arts course was counted. In other<br />
words, a student enrolled <strong>in</strong> two courses <strong>in</strong> a s<strong>in</strong>gle arts discipl<strong>in</strong>e was counted twice.<br />
<strong>Status</strong> <strong>of</strong> <strong>Arts</strong> <strong>Education</strong> <strong>in</strong> <strong>Ohio</strong>’s <strong>Public</strong> Schools 22
Comparisons among district types—grouped by size, location and median <strong>in</strong>come—<strong>in</strong>dicate some<br />
<strong>in</strong>equities <strong>in</strong> access. Figure 6 shows that 12 percent <strong>of</strong> districts categorized as Type 5—major urban<br />
districts with large student populations and very<br />
high poverty—provided <strong>in</strong>struction <strong>in</strong> more than<br />
two arts discipl<strong>in</strong>es. However, 10 percent <strong>of</strong> major<br />
urban districts report zero students enrolled <strong>in</strong> arts<br />
courses. This means that a high number <strong>of</strong> the<br />
students who lack access to arts education live <strong>in</strong><br />
urban districts with high or very high poverty<br />
(Types 4 and 5). Those districts, along with low<strong>in</strong>come<br />
rural districts (Type 1), also show higher<br />
percentages <strong>of</strong> schools <strong>of</strong>fer<strong>in</strong>g access to <strong>in</strong>struction<br />
<strong>in</strong> only one arts discipl<strong>in</strong>e.<br />
<strong>Ohio</strong>’s 15 Major<br />
Urban Districts (Type 5)<br />
Akron City<br />
Canton City<br />
Cleveland Municipal<br />
Cleveland Heights/<br />
University Heights City<br />
C<strong>in</strong>c<strong>in</strong>nati City<br />
Columbus City<br />
Dayton City<br />
Total: 360,000 students<br />
East Cleveland City<br />
Euclid City<br />
Hamilton City<br />
Lora<strong>in</strong> City<br />
Spr<strong>in</strong>gfield City<br />
Toledo City<br />
Warren City<br />
Youngstown City<br />
Figure 6: Percentage <strong>of</strong> Schools <strong>in</strong> Each District Type Grouped by Number <strong>of</strong><br />
Discipl<strong>in</strong>es Offered<br />
% <strong>of</strong> Schools<br />
100%<br />
90%<br />
80%<br />
70%<br />
60%<br />
50%<br />
40%<br />
30%<br />
20%<br />
10%<br />
0%<br />
Zero One Discipl<strong>in</strong>e Two Discipl<strong>in</strong>es Three Discipl<strong>in</strong>es Four Discipl<strong>in</strong>es<br />
85% 88% 87%<br />
88%<br />
84%<br />
79%<br />
74%<br />
7%<br />
3%<br />
10%<br />
8%<br />
2% 4% 6% 8%<br />
5% 7% 9%<br />
12%<br />
8%<br />
3% 5%<br />
2%<br />
3% 4% 3% 2% 2%<br />
1% 1%<br />
0.5% 0%<br />
0.2% 0%<br />
0.5%<br />
1. Rural/<br />
Agricultural –<br />
high poverty<br />
2. Rural/<br />
Agricultural –<br />
low-to-moderate<br />
median <strong>in</strong>come<br />
3. Rural/<br />
Small Town –<br />
moderate-to-high<br />
median <strong>in</strong>come<br />
4. Urban –<br />
high poverty<br />
5. Major Urban –<br />
very high poverty<br />
6. Urban/<br />
Suburban –<br />
high median<br />
<strong>in</strong>come<br />
7. Urban/<br />
Suburban –<br />
very high<br />
median <strong>in</strong>come<br />
<strong>Status</strong> <strong>of</strong> <strong>Arts</strong> <strong>Education</strong> <strong>in</strong> <strong>Ohio</strong>’s <strong>Public</strong> Schools 23
ENSURING SEQUENTIAL ARTS INSTRUCTION ACROSS GRADE LEVELS<br />
Provid<strong>in</strong>g access to the arts <strong>in</strong>cludes <strong>of</strong>fer<strong>in</strong>g sequential courses <strong>in</strong> each <strong>of</strong> the<br />
four arts discipl<strong>in</strong>es spann<strong>in</strong>g K-12 grade levels. Those courses establish and<br />
build on a foundation for understand<strong>in</strong>g and accomplishments <strong>in</strong> the arts.<br />
Clearly, the ODE data show that few <strong>Ohio</strong> students can access 13 years <strong>of</strong> <strong>in</strong>struction <strong>in</strong> dance or<br />
drama/theatre. However, ODE data <strong>in</strong>dicate that 87 percent <strong>of</strong> districts <strong>in</strong> 2009-2010 reported<br />
provid<strong>in</strong>g a sequence <strong>of</strong> courses spann<strong>in</strong>g k<strong>in</strong>dergarten through grade 12 <strong>in</strong> the visual arts and/or<br />
music.<br />
Accord<strong>in</strong>g to ODE data, 83 school districts (13 percent) did not enroll students <strong>in</strong> arts courses at<br />
every grade level between k<strong>in</strong>dergarten and 12th grade <strong>in</strong> 2009-2010. Fifty-one <strong>of</strong> those school<br />
districts enrolled at least one student <strong>in</strong> an arts course <strong>in</strong> 12 grades. In most cases, k<strong>in</strong>dergarten<br />
was the grade with zero students enrolled <strong>in</strong> arts courses.<br />
PROVIDING A WELL-ROUNDED ARTS EDUCATION<br />
Access to arts education <strong>in</strong>cludes opportunities for all students, especially those<br />
who aspire to careers <strong>in</strong> the arts and other creative <strong>in</strong>dustries, to develop a solid<br />
background and deep understand<strong>in</strong>g <strong>in</strong> the arts.<br />
Based on course titles, <strong>Ohio</strong>’s public schools delivered 29 different courses <strong>in</strong> the arts <strong>in</strong> 2009-<br />
2010, <strong>in</strong>clud<strong>in</strong>g enrollment <strong>in</strong> eight music courses, 17 courses <strong>in</strong> visual arts, 2 courses <strong>in</strong> dance<br />
and 2 courses <strong>in</strong> drama/theatre.<br />
While 97 percent or more <strong>of</strong> districts <strong>of</strong>fered visual arts (K-12) and <strong>in</strong>strumental and vocal music,<br />
22 <strong>of</strong> the other courses listed were available <strong>in</strong> less than 40 percent <strong>of</strong> <strong>Ohio</strong>’s 612 school districts.<br />
<strong>The</strong> range <strong>of</strong> music and visual arts courses reported expanded after grade 5. <strong>The</strong> number <strong>of</strong><br />
schools <strong>of</strong>fer<strong>in</strong>g courses <strong>in</strong> <strong>in</strong>strumental music and vocal/choral music <strong>in</strong>creased <strong>in</strong> grades 5 and<br />
6, and rema<strong>in</strong>ed steady through high school. <strong>The</strong> variety <strong>of</strong> visual arts courses <strong>of</strong>fered <strong>in</strong>creased<br />
beg<strong>in</strong>n<strong>in</strong>g <strong>in</strong> grades 5, 6 and 7 and rema<strong>in</strong>ed steady through high school. <strong>The</strong> few dance and<br />
drama/theatre courses <strong>of</strong>fered were <strong>in</strong>troductory or broad at all grade levels.<br />
Table 4 (next page) shows the number and percentage <strong>of</strong> districts that reported <strong>of</strong>fer<strong>in</strong>g each <strong>of</strong><br />
the 29 courses.<br />
Note: <strong>The</strong> term ‘course’ refers to a unique arts course <strong>of</strong>fered with<strong>in</strong> a grade. If multiple schools<br />
<strong>in</strong> a district <strong>of</strong>fer a specific course <strong>in</strong> the same grade, that course would count only once; a<br />
course <strong>of</strong>fered <strong>in</strong> two grades would be counted twice. For example, Comprehensive Dance taught<br />
<strong>in</strong> grade 6 and Comprehensive Dance taught <strong>in</strong> Grade 7 would each be counted as a unique<br />
course, but each would be counted once, even if several schools <strong>in</strong> the district taught the course.<br />
<strong>Status</strong> <strong>of</strong> <strong>Arts</strong> <strong>Education</strong> <strong>in</strong> <strong>Ohio</strong>’s <strong>Public</strong> Schools 24
Table 4. Number and Percentage <strong>of</strong> <strong>Ohio</strong>’s <strong>Public</strong> School Districts<br />
Offer<strong>in</strong>g Each <strong>of</strong> 29 <strong>Arts</strong> Courses<br />
Course/<br />
ODE Course Code<br />
# <strong>of</strong> Districts<br />
Offer<strong>in</strong>g<br />
% <strong>of</strong><br />
Districts<br />
Offer<strong>in</strong>g<br />
Course/<br />
ODE Course Code<br />
# <strong>of</strong> Districts<br />
Offer<strong>in</strong>g<br />
% <strong>of</strong> Districts<br />
Offer<strong>in</strong>g<br />
Visual <strong>Arts</strong> – 99.8% <strong>of</strong> districts <strong>of</strong>fer at least one<br />
course<br />
Visual <strong>Arts</strong> (K-12) 020012 606 99%<br />
Draw<strong>in</strong>g and Pa<strong>in</strong>t<strong>in</strong>g<br />
020250<br />
430 70%<br />
Drama/<strong>The</strong>atre – 34% <strong>of</strong> districts <strong>of</strong>fer at least one<br />
course<br />
Drama/<strong>The</strong>atre <strong>Arts</strong><br />
050600<br />
Drama/<strong>The</strong>atre (K-8)<br />
050337<br />
Ceramics 020242 252 41% Total Drama/<strong>The</strong>atre 413<br />
Photography and<br />
Filmmak<strong>in</strong>g 020270<br />
Art Appreciation 020100 184 30%<br />
Design 020210 188 31%<br />
Advanced Visual <strong>Arts</strong><br />
029902<br />
Graphic <strong>Arts</strong>/Unified <strong>Arts</strong><br />
020320<br />
202 33%<br />
17 3%<br />
217 35% Dance – 4% <strong>of</strong> districts <strong>of</strong>fer at least one course<br />
Introduction to Dance<br />
080312<br />
Comprehensive<br />
Dance 080315<br />
178 29% Total Dance 86<br />
19 3%<br />
11 2%<br />
143 23% Music – 99.8% <strong>of</strong> districts <strong>of</strong>fer at least one course<br />
Art History 020101 105 17% Music (k-8) 122000 538 88%<br />
Crafts 020240 130 21%<br />
Sculpture 020290 137 22%<br />
AP Studio Art Draw<strong>in</strong>g<br />
029100<br />
52 8%<br />
Pr<strong>in</strong>tmak<strong>in</strong>g 020280 39 6%<br />
AP Studio 2D Design<br />
029110<br />
AP Studio 3D Design<br />
029120<br />
Instrumental Music<br />
120500<br />
Vocal/Choral Music<br />
120400<br />
General Music<br />
120000<br />
Music Appreciation<br />
120800<br />
607 99%<br />
591 97%<br />
421 69%<br />
232 38%<br />
31 5% Music <strong>The</strong>ory 120300 231 38%<br />
15 2%<br />
AP Art History 029130 19 3%<br />
Other Visual <strong>Arts</strong> courses<br />
029999<br />
Total Visual <strong>Arts</strong> 10,068<br />
AP Music <strong>The</strong>ory<br />
129926<br />
Other Music courses<br />
129999<br />
148 24% Total Music 9,682<br />
Courses are def<strong>in</strong>ed by the <strong>Ohio</strong> Department <strong>of</strong> <strong>Education</strong>. Total number <strong>of</strong> schools districts = 612.<br />
43 7%<br />
184 30%<br />
<strong>Status</strong> <strong>of</strong> <strong>Arts</strong> <strong>Education</strong> <strong>in</strong> <strong>Ohio</strong>’s <strong>Public</strong> Schools 25
Table 5 identifies the 25 school districts <strong>of</strong>fer<strong>in</strong>g the highest number <strong>of</strong> different arts courses per grade<br />
level. Only one <strong>of</strong> the 25 was a rural/small town district (Wayne Local). <strong>The</strong> rest were urban or<br />
urban/suburban (typologies 4, 5, 6 and 7). <strong>The</strong>se 25 districts, shown for illustrative purposes only, <strong>of</strong>fer<br />
the most varied arts education <strong>in</strong> terms <strong>of</strong> the number <strong>of</strong> different arts courses.<br />
Table 5: <strong>The</strong> 25 Districts with the Highest Number <strong>of</strong> Different <strong>Arts</strong> Courses<br />
District Name (Type)<br />
District<br />
IRN<br />
Visual<br />
<strong>Arts</strong><br />
Dance<br />
Drama/<br />
<strong>The</strong>atre<br />
Music<br />
# arts<br />
courses <strong>in</strong><br />
all grades<br />
# <strong>of</strong> grades<br />
(with arts<br />
enrollment)<br />
# arts<br />
courses<br />
per grade<br />
# <strong>of</strong> Courses (summed for all courses<br />
<strong>of</strong> that type, for all grades <strong>of</strong>fered)<br />
Toledo City (5) 44909 50 0 4 27 81 7 11.6<br />
C<strong>in</strong>c<strong>in</strong>nati City (5) 43752 48 18 9 42 117 13 9.0<br />
Akron City (5) 43489 52 13 14 31 110 13 8.5<br />
Dayton City (5) 43844 47 9 10 43 109 13 8.4<br />
Columbus City (5) 43802 38 16 15 31 100 13 7.7<br />
Cleveland City (5) 43786 46 13 13 26 98 13 7.5<br />
Centerville City (7) 43737 19 8 4 21 52 7 7.4<br />
Solon City (7) 46607 32 0 0 17 49 7 7.0<br />
Olentangy Local (7) 46763 46 0 4 38 88 13 6.8<br />
Worth<strong>in</strong>gton City (7) 45138 27 0 4 15 46 7 6.6<br />
Reynoldsburg City (6) 47001 22 0 0 17 39 6 6.5<br />
Lima City (4) 44222 32 16 8 28 84 13 6.5<br />
Canton City (5) 43711 50 0 3 29 82 13 6.3<br />
Lora<strong>in</strong> City (5) 44263 38 6 7 31 82 13 6.3<br />
Oak Hills Local (6) 47373 38 0 3 36 77 13 5.9<br />
Wayne Local (3) 50468 21 0 0 25 46 8 5.8<br />
Mason City (7) 50450 46 0 4 24 74 13 5.7<br />
Shaker Heights City (7) 44750 45 0 4 25 74 13 5.7<br />
South-Western City (6) 44800 40 0 4 29 73 13 5.6<br />
Stow-Munroe Falls<br />
City (6) 44834 39 0 4 30 73 13 5.6<br />
Sylvania City (7) 44875 36 0 4 33 73 13 5.6<br />
Newark City (4) 44453 44 0 0 28 72 13 5.5<br />
Sycamore<br />
Community City (7) 44867 34 0 4 34 72 13 5.5<br />
<strong>Status</strong> <strong>of</strong> <strong>Arts</strong> <strong>Education</strong> <strong>in</strong> <strong>Ohio</strong>’s <strong>Public</strong> Schools 26
Table 5: <strong>The</strong> 25 Districts with the Highest Number <strong>of</strong> Different <strong>Arts</strong> Courses<br />
District Name (Type)<br />
District<br />
IRN<br />
Visual<br />
<strong>Arts</strong><br />
Dance<br />
Drama/<br />
<strong>The</strong>atre<br />
Music<br />
# arts<br />
courses <strong>in</strong><br />
all grades<br />
# <strong>of</strong> grades<br />
(with arts<br />
enrollment)<br />
# arts<br />
courses<br />
per grade<br />
# <strong>of</strong> Courses (summed for all courses<br />
<strong>of</strong> that type, for all grades <strong>of</strong>fered)<br />
Warren City (5) 44990 39 0 1 32 72 13 5.5<br />
Delaware City (6) 43877 39 0 4 28 71 13 5.5<br />
IDENTIFYING AND SERVING STUDENTS WHO ARE GIFTED IN THE ARTS<br />
Access to arts education <strong>in</strong>cludes ensur<strong>in</strong>g that students who are gifted <strong>in</strong> the arts<br />
receive appropriate arts <strong>in</strong>struction.<br />
Forty-two percent <strong>of</strong> schools that responded to the <strong>Status</strong> Survey reported that they identified students<br />
gifted <strong>in</strong> the visual and perform<strong>in</strong>g arts. Accord<strong>in</strong>g to ODE data, <strong>Ohio</strong>’s public schools identified 19,771<br />
students as gifted <strong>in</strong> the visual and perform<strong>in</strong>g arts <strong>in</strong> 2009-2010. Of those 19,771 students, 1,048<br />
received gifted education services <strong>in</strong> the arts.<br />
PROVIDING EXTRACURRICULAR ARTS EXPERIENCES<br />
Access to arts education <strong>in</strong>cludes provid<strong>in</strong>g opportunities to apply and extend<br />
arts knowledge and skills ga<strong>in</strong>ed <strong>in</strong> the classroom or simply enjoy the arts.<br />
Extracurricular <strong>in</strong>struction <strong>in</strong> at least one arts discipl<strong>in</strong>e was reported by 72 percent <strong>of</strong> high schools,<br />
49 percent <strong>of</strong> middle schools and 37 percent <strong>of</strong> elementary schools. As shown <strong>in</strong> Figure 7,<br />
extracurricular music and drama/theatre showed the highest participation, especially <strong>in</strong> high schools.<br />
Figure 7: Participation <strong>in</strong> Extracurricular <strong>Arts</strong> Instruction<br />
100%<br />
90%<br />
80%<br />
70%<br />
60%<br />
50%<br />
40%<br />
30%<br />
20%<br />
10%<br />
0%<br />
Dance Music Drama/<strong>The</strong>atre Visual <strong>Arts</strong><br />
Elementary<br />
Middle<br />
High<br />
<strong>Status</strong> <strong>of</strong> <strong>Arts</strong> <strong>Education</strong> <strong>in</strong> <strong>Ohio</strong>’s <strong>Public</strong> Schools 27
ANALYSIS: HOW DOES OHIO COMPARE TO A NATIONAL SAMPLE?<br />
Overall access to the arts <strong>in</strong> <strong>Ohio</strong>’s public schools reflects access nationally.<br />
N<strong>in</strong>ety-three percent <strong>of</strong> all public schools <strong>in</strong> <strong>Ohio</strong> <strong>of</strong>fer access to some form <strong>of</strong> <strong>in</strong>struction <strong>in</strong> the<br />
arts—the same percentage result<strong>in</strong>g from analysis <strong>of</strong> a national sample by the National Center for<br />
<strong>Education</strong> Statistics. (See page 17 for <strong>in</strong>formation about the NCES study.)<br />
<strong>Ohio</strong>’s public schools compare favorably to the national sample <strong>in</strong> <strong>of</strong>fer<strong>in</strong>g access<br />
to music and visual arts <strong>in</strong>struction.<br />
Compar<strong>in</strong>g ODE data to the NCES sample <strong>in</strong>dicates that the percentage <strong>of</strong> <strong>Ohio</strong>’s public schools<br />
provid<strong>in</strong>g access to music and visual arts <strong>in</strong>struction was slightly higher than the national average<br />
for the same period studied. (See Figure 8.)<br />
More than 80 percent <strong>of</strong> traditional public schools <strong>in</strong> <strong>Ohio</strong> <strong>of</strong>fer courses <strong>in</strong> both music and the<br />
visual arts, and 87 percent <strong>of</strong> <strong>Ohio</strong>’s school districts provide a sequence <strong>of</strong> <strong>in</strong>struction <strong>in</strong> at least<br />
one <strong>of</strong> those discipl<strong>in</strong>es spann<strong>in</strong>g k<strong>in</strong>dergarten through grade 12.<br />
Figure 8: Access to Music and Visual <strong>Arts</strong>—National Sample Compared to <strong>Ohio</strong> Survey<br />
100%<br />
90%<br />
94%<br />
97%<br />
83%<br />
90%<br />
91%<br />
98% 98%<br />
89%<br />
80%<br />
70%<br />
60%<br />
50%<br />
40%<br />
National<br />
<strong>Ohio</strong><br />
30%<br />
20%<br />
10%<br />
0%<br />
Music (Elementary)<br />
Visual <strong>Arts</strong><br />
(Elementary)<br />
Music (Secondary)<br />
Visual <strong>Arts</strong><br />
(Secondary)<br />
Source for National Data: NCES 2012-14.<br />
*NCES did not provide an aggregate percentage. <strong>The</strong> statement that 93 percent <strong>of</strong> schools <strong>in</strong><br />
the national sample <strong>of</strong>fered access to at least one art form comes from averag<strong>in</strong>g the<br />
percentages <strong>of</strong> elementary (K-8) and high schools report<strong>in</strong>g access to music. (<strong>The</strong> percentage<br />
<strong>of</strong> schools <strong>of</strong>fer<strong>in</strong>g music was higher than any <strong>of</strong> the other arts discipl<strong>in</strong>es.)<br />
<strong>Status</strong> <strong>of</strong> <strong>Arts</strong> <strong>Education</strong> <strong>in</strong> <strong>Ohio</strong>’s <strong>Public</strong> Schools 28
Access to dance and drama/theatre is limited nationwide, but access is slightly<br />
more limited <strong>in</strong> <strong>Ohio</strong>’s high schools than nationally.<br />
Compar<strong>in</strong>g <strong>Ohio</strong>’s results to the national data shows that <strong>Ohio</strong> lags <strong>in</strong> provid<strong>in</strong>g access to dance<br />
and drama/theatre <strong>in</strong> high school. <strong>Ohio</strong>’s results for grades K-8 reflect the national averages.<br />
(See Figure 9.)<br />
Figure 9: Access to Dance and Drama/<strong>The</strong>atre Courses—<br />
National Sample Compared to <strong>Ohio</strong> Survey<br />
100%<br />
90%<br />
80%<br />
70%<br />
60%<br />
50%<br />
40%<br />
30%<br />
45%<br />
39%<br />
National<br />
<strong>Ohio</strong><br />
20%<br />
10%<br />
3% 3% 4% 4%<br />
12%<br />
7%<br />
0%<br />
Dance<br />
(Elementary)<br />
Drama/<strong>The</strong>atre<br />
(Elementary)<br />
Dance<br />
(Secondary)<br />
Drama/<strong>The</strong>atre<br />
(Secondary)<br />
Note: In the national survey, grades K-8 are categorized as elementary schools. <strong>The</strong><br />
<strong>Ohio</strong> data shown above were obta<strong>in</strong>ed by comb<strong>in</strong><strong>in</strong>g the percentages for elementary<br />
and middle schools.<br />
Access to <strong>in</strong>struction <strong>in</strong> one or more arts discipl<strong>in</strong>es is lower <strong>in</strong> high-poverty<br />
districts nationally, but <strong>Ohio</strong>’s equity gap seems to be narrower.<br />
<strong>The</strong> ODE data <strong>in</strong>dicate that lack <strong>of</strong> access to arts <strong>in</strong>struction is most prevalent where there is<br />
poverty—most notably 10 percent <strong>of</strong> schools <strong>in</strong> <strong>Ohio</strong>’s 15 major high-poverty urban districts and<br />
39 percent <strong>of</strong> community schools, which typically serve low-<strong>in</strong>come communities. As Table 6<br />
(next page) shows, however, access to arts education among <strong>Ohio</strong>’s high-poverty schools and the<br />
NCES sample are similar. <strong>The</strong> equity gap also appears to be narrower <strong>in</strong> <strong>Ohio</strong>—partly because<br />
access to the arts is better among <strong>Ohio</strong>’s high-poverty districts than it is among their counterparts<br />
<strong>in</strong> the national sample, and partly because <strong>Ohio</strong>’s highest <strong>in</strong>come districts (Type 7) do not<br />
compare favorably with the high-<strong>in</strong>come segment.<br />
<strong>Status</strong> <strong>of</strong> <strong>Arts</strong> <strong>Education</strong> <strong>in</strong> <strong>Ohio</strong>’s <strong>Public</strong> Schools 29
Table 6: Comparison <strong>of</strong> Equity Gaps <strong>in</strong> <strong>Ohio</strong> and Nation Based on ODE Data<br />
High<br />
Income<br />
Students<br />
Nationally<br />
Among schools with 0-25 percent <strong>of</strong> students<br />
eligible for free and reduced-price lunch:<br />
• 97% <strong>of</strong> elementary schools <strong>of</strong>fer <strong>in</strong>struction<br />
<strong>in</strong> at least one arts discipl<strong>in</strong>e.<br />
• 96% <strong>of</strong> secondary schools <strong>of</strong>fer <strong>in</strong>struction<br />
<strong>in</strong> at least one arts discipl<strong>in</strong>e.<br />
In <strong>Ohio</strong><br />
Schools <strong>in</strong> urban/suburban districts with very<br />
high <strong>in</strong>come:<br />
• 92% <strong>of</strong>fer <strong>in</strong>struction <strong>in</strong> at least one arts<br />
discipl<strong>in</strong>e.<br />
Low<br />
Income<br />
Students<br />
Schools with more than three quarters <strong>of</strong><br />
students eligible for free and reduced-price lunch<br />
<strong>of</strong>fer<strong>in</strong>g <strong>in</strong>struction <strong>in</strong> at least one arts discipl<strong>in</strong>e:<br />
• 89% <strong>of</strong> elementary schools <strong>of</strong>fer <strong>in</strong>struction <strong>in</strong><br />
at least one arts discipl<strong>in</strong>e.<br />
• 81% <strong>of</strong> secondary schools <strong>of</strong>fer <strong>in</strong>struction <strong>in</strong><br />
at least one arts discipl<strong>in</strong>e.<br />
<strong>Ohio</strong>’s schools <strong>in</strong> high-poverty districts:<br />
• 90% <strong>of</strong> schools <strong>in</strong> large, high-poverty major<br />
urban districts (Type 5) <strong>of</strong>fer <strong>in</strong>struction <strong>in</strong> at<br />
least one arts discipl<strong>in</strong>e.<br />
• 97% <strong>of</strong> schools <strong>in</strong> smaller urban districts with<br />
high poverty and 99% <strong>of</strong> high-poverty rural<br />
districts <strong>of</strong>fer <strong>in</strong>struction <strong>in</strong> at least one arts<br />
discipl<strong>in</strong>e.<br />
Data <strong>in</strong>dicate that breadth and depth <strong>of</strong> access to arts <strong>in</strong>struction vary.<br />
Data <strong>in</strong>dicate that 84 percent <strong>of</strong> <strong>Ohio</strong>’s traditional public schools <strong>of</strong>fer both music and visual arts courses<br />
from grades K-12. An exam<strong>in</strong>ation <strong>of</strong> the 25 different courses taught <strong>in</strong> those two discipl<strong>in</strong>es reveals that<br />
most specialized arts courses are <strong>of</strong>fered <strong>in</strong> fewer than 40 percent <strong>of</strong> districts. Moreover, each <strong>of</strong> the five<br />
AP arts courses is <strong>of</strong>fered <strong>in</strong> fewer than 10 percent <strong>of</strong> districts.<br />
While <strong>Ohio</strong>’s study presents district-level data on the types <strong>of</strong> courses <strong>of</strong>fered, the NCES study presented<br />
school-level data. Nevertheless, the national school-level data show a similar pattern for grades K-8.<br />
N<strong>in</strong>ety percent <strong>of</strong> schools <strong>of</strong>fered general music, but less than 50 percent <strong>of</strong>fered chorus or <strong>in</strong>strumental<br />
music, and only 28 percent <strong>of</strong>fered str<strong>in</strong>gs/orchestra.<br />
PRIORITIES: WHERE SHOULD WE FOCUS OUR EFFORTS?<br />
Based on the report f<strong>in</strong>d<strong>in</strong>gs related to access and equity, the <strong>Ohio</strong> Alliance for <strong>Arts</strong><br />
<strong>Education</strong>, the <strong>Ohio</strong> <strong>Arts</strong> <strong>Council</strong> and the <strong>Ohio</strong> Department <strong>of</strong> <strong>Education</strong> will emphasize<br />
the follow<strong>in</strong>g priorities <strong>in</strong> their efforts to susta<strong>in</strong> and strengthen <strong>Ohio</strong>’s arts education<br />
<strong>in</strong>frastructure:<br />
• Determ<strong>in</strong><strong>in</strong>g the specific needs <strong>of</strong> schools that provide limited or no access to arts<br />
<strong>in</strong>struction and develop<strong>in</strong>g strategies for assist<strong>in</strong>g those schools.<br />
• Increas<strong>in</strong>g understand<strong>in</strong>g <strong>of</strong> what <strong>Ohio</strong>’s operat<strong>in</strong>g standards require and help<strong>in</strong>g<br />
districts ensure that local policies meet those standards.<br />
• Explor<strong>in</strong>g strategies to assist schools <strong>in</strong>terested <strong>in</strong> <strong>of</strong>fer<strong>in</strong>g dance and<br />
drama/theatre <strong>in</strong>struction.<br />
• Pursu<strong>in</strong>g additional options for meet<strong>in</strong>g the learn<strong>in</strong>g needs <strong>of</strong> gifted students.<br />
<strong>Status</strong> <strong>of</strong> <strong>Arts</strong> <strong>Education</strong> <strong>in</strong> <strong>Ohio</strong>’s <strong>Public</strong> Schools 30
CREATING CONDITIONS FOR HIGH QUALITY<br />
<strong>The</strong> follow<strong>in</strong>g conditions support high-quality arts education:<br />
• A course <strong>of</strong> study <strong>in</strong> the arts that aligns with arts learn<strong>in</strong>g<br />
standards, specifies learn<strong>in</strong>g and performance objectives and<br />
establishes scope and sequence.<br />
• Effective assessment <strong>of</strong> student progress.<br />
• Teachers who engage <strong>in</strong> ongo<strong>in</strong>g pr<strong>of</strong>essional learn<strong>in</strong>g.<br />
• Leadership and work<strong>in</strong>g conditions that support<br />
collaboration, reflection and cont<strong>in</strong>uous improvement.<br />
• Supportive classroom environments and community<br />
partnerships.<br />
Courtesy: Akron <strong>Public</strong> Schools<br />
F<strong>in</strong>d<strong>in</strong>gs from the <strong>Status</strong> Survey, considered alongside ODE data from 2009-2010, provide <strong>in</strong>formation<br />
about <strong>Ohio</strong>’s status <strong>in</strong> support<strong>in</strong>g each <strong>of</strong> those areas.<br />
FINDINGS: WHAT DO THE DATA SAY?<br />
Summary: N<strong>in</strong>ety percent <strong>of</strong> schools have aligned arts <strong>in</strong>struction with <strong>Ohio</strong>’s arts learn<strong>in</strong>g standards<br />
and 88 percent use teacher-developed arts assessments. Educators who are licensed to teach the arts<br />
provide all arts <strong>in</strong>struction <strong>in</strong> 83 percent <strong>of</strong> schools. Sixty-four percent <strong>of</strong> schools provide some<br />
pr<strong>of</strong>essional development <strong>in</strong> the arts. Use <strong>of</strong> dedicated classrooms varies by arts discipl<strong>in</strong>e and school<br />
level. Technology <strong>in</strong> arts classrooms is most prevalent <strong>in</strong> high schools.<br />
ADOPTING AND ADDRESSING OHIO’S ARTS LEARNING STANDARDS<br />
<strong>Ohio</strong>’s arts learn<strong>in</strong>g standards provide schools<br />
with a framework for high-quality arts <strong>in</strong>struction.<br />
Accord<strong>in</strong>g to the <strong>Status</strong> Survey, 71 percent <strong>of</strong> schools reported that<br />
their local boards <strong>of</strong> education adopted <strong>Ohio</strong>’s arts learn<strong>in</strong>g standards.<br />
N<strong>in</strong>ety percent <strong>of</strong> survey respondents have aligned their arts curricula<br />
with those standards.<br />
As Figure 10 shows, 10 percent <strong>of</strong> schools reported that their<br />
boards <strong>of</strong> education had not adopted the arts learn<strong>in</strong>g standards,<br />
and 19 percent reported align<strong>in</strong>g their curricula with the standards<br />
without board adoption. Fifty-six percent reported that their arts<br />
curricula have been aligned with the standards for five years or<br />
more.<br />
Not<br />
Adopted<br />
10%<br />
Key F<strong>in</strong>d<strong>in</strong>g: Most arts <strong>in</strong>struction <strong>in</strong> <strong>Ohio</strong> is standards-based.<br />
Figure 10: Adoption and Use <strong>of</strong><br />
Content Standards as <strong>of</strong> 2009<br />
Aligned<br />
But Not<br />
Adopted<br />
19%<br />
Adopted<br />
71%<br />
<strong>Status</strong> <strong>of</strong> <strong>Arts</strong> <strong>Education</strong> <strong>in</strong> <strong>Ohio</strong>’s <strong>Public</strong> Schools 31
ASSESSING STUDENT LEARNING IN THE ARTS<br />
Effective formative and summative assessment <strong>of</strong> student learn<strong>in</strong>g drives<br />
improvement <strong>in</strong> arts education. Teacher-developed assessments that align with<br />
standards-based <strong>in</strong>struction facilitate student learn<strong>in</strong>g. Locally developed districtwide<br />
assessments and national assessments help teachers and adm<strong>in</strong>istrators<br />
measure and improve the quality <strong>of</strong> their programs.<br />
<strong>The</strong> <strong>Status</strong> Survey showed that 94 percent <strong>of</strong> schools reported us<strong>in</strong>g some type <strong>of</strong> assessment <strong>in</strong><br />
the arts. Eighty-eight percent <strong>of</strong> schools reported us<strong>in</strong>g teacher-developed assessments to track<br />
student progress while results showed 8 percent us<strong>in</strong>g district-level assessments that were<br />
required, 6 percent us<strong>in</strong>g assessments that were developed at the district level but not required<br />
and 4 percent us<strong>in</strong>g assessments developed outside the district.<br />
PROVIDING INSTRUCTION BY LICENSED ARTS SPECIALISTS<br />
Provid<strong>in</strong>g high-quality <strong>in</strong>struction <strong>in</strong> the arts <strong>in</strong>cludes ensur<strong>in</strong>g that those who<br />
teach the arts have licenses that reflect competence <strong>in</strong> the practice and pedagogy<br />
<strong>of</strong> their arts discipl<strong>in</strong>es.<br />
Accord<strong>in</strong>g to ODE data, 83 percent <strong>of</strong> schools reported that all teachers who taught arts courses <strong>in</strong> the<br />
2009-2010 school year were licensed <strong>in</strong> one or more <strong>of</strong> the arts discipl<strong>in</strong>es they taught. (See Figure 11.)<br />
N<strong>in</strong>ety-four percent <strong>of</strong> the teachers <strong>in</strong> those schools were licensed for every course they taught. Between<br />
94 and 97 percent <strong>of</strong> the most commonly <strong>of</strong>fered courses <strong>in</strong> music and visual arts were taught by teachers<br />
licensed <strong>in</strong> those discipl<strong>in</strong>es. (Page 8 details appropriate licensure <strong>in</strong> the arts.)<br />
Table 7 (next page) shows all the arts courses<br />
<strong>of</strong>fered, each with the total number <strong>of</strong> courses<br />
taught and the percentage <strong>of</strong> those courses taught<br />
by teachers licensed <strong>in</strong> the discipl<strong>in</strong>es taught. <strong>The</strong><br />
table <strong>in</strong>dicates that over 90 percent <strong>of</strong> most music<br />
and visual arts courses were taught by arts<br />
specialists. Less than 85 percent <strong>of</strong> drama/theatre<br />
courses and less than 65 percent <strong>of</strong> dance courses<br />
were taught by teachers with licenses <strong>in</strong> those areas.<br />
Visit<strong>in</strong>g artists taught drama/theatre <strong>in</strong> at least one<br />
grade <strong>in</strong> 29 percent <strong>of</strong> schools that <strong>of</strong>fered<br />
drama/theatre and 33 percent <strong>of</strong> schools that <strong>of</strong>fered<br />
dance.<br />
Key F<strong>in</strong>d<strong>in</strong>g: Most <strong>Ohio</strong> teachers provid<strong>in</strong>g<br />
arts <strong>in</strong>struction are appropriately licensed.<br />
Figure 11: Percentages <strong>of</strong> Schools<br />
by Teacher Licensure <strong>in</strong> the <strong>Arts</strong><br />
No Teachers<br />
Are Licensed;<br />
3%<br />
All Teachers<br />
Are Licensed;<br />
83%<br />
Some<br />
Teachers Are<br />
Licensed;<br />
14%<br />
<strong>Status</strong> <strong>of</strong> <strong>Arts</strong> <strong>Education</strong> <strong>in</strong> <strong>Ohio</strong>’s <strong>Public</strong> Schools 32
Table 7: Number <strong>of</strong> Courses Taught for Each Unique <strong>Arts</strong> Course and<br />
Percentage <strong>of</strong> Each Course Taught by a Teacher with a License <strong>in</strong> the Discipl<strong>in</strong>e<br />
Course<br />
# <strong>of</strong> Courses<br />
Taught<br />
% Taught by<br />
Teacher with<br />
License <strong>in</strong><br />
Discipl<strong>in</strong>e<br />
Course<br />
# <strong>of</strong> Courses<br />
Taught<br />
% Taught by<br />
Teacher with<br />
License <strong>in</strong><br />
Discipl<strong>in</strong>e<br />
Visual <strong>Arts</strong> – 99.8% <strong>of</strong> districts <strong>of</strong>fer at least one<br />
course<br />
Visual <strong>Arts</strong> (K-12) 6116 96%<br />
Art Appreciation 397 79%<br />
Art History 215 65%<br />
Drama/<strong>The</strong>atre – 34% <strong>of</strong> districts <strong>of</strong>fer at least<br />
one course<br />
Drama/<strong>The</strong>atre<br />
<strong>Arts</strong> 362 70%<br />
Drama/<strong>The</strong>atre (k-<br />
8) 51 84%<br />
Total<br />
Drama/<strong>The</strong>atre<br />
413<br />
Design 343 88%<br />
Crafts 189 94%<br />
Ceramics 355 93%<br />
Dance – 4% <strong>of</strong> districts <strong>of</strong>fer at least one course<br />
Introduction to<br />
Dance 57 63%<br />
Comprehensive<br />
Dance 29 59%<br />
Draw<strong>in</strong>g and Pa<strong>in</strong>t<strong>in</strong>g 951 90% Total Dance 86<br />
Photography/Filmmak<strong>in</strong>g 367 84%<br />
Music – 99.8% <strong>of</strong> districts <strong>of</strong>fer at least one<br />
course<br />
Pr<strong>in</strong>tmak<strong>in</strong>g 44 93% General Music 1600 94%<br />
Sculpture 179 94% Music <strong>The</strong>ory 317 89%<br />
Graphic <strong>Arts</strong>/Unified <strong>Arts</strong> 213 85% Vocal/Choral Music 1578 96%<br />
AP Studio Art - Draw<strong>in</strong>g 70 91% Instrumental Music 2871 96%<br />
AP Studio Art - 2D<br />
Design 38 89% Music Appreciation 390 82%<br />
AP Studio Art - 3D<br />
Design 19 89% Music (K-8) 2595 97%<br />
AP Art History 25 84% AP Music <strong>The</strong>ory 55 84%<br />
Advanced Visual <strong>Arts</strong> 243 94%<br />
Other Music<br />
courses 276 80%<br />
Other Visual <strong>Arts</strong><br />
courses 304 74% Total Music 9,682<br />
Total Visual <strong>Arts</strong> 10,068<br />
Courses are def<strong>in</strong>ed by the <strong>Ohio</strong> Department <strong>of</strong> <strong>Education</strong>. Total number <strong>of</strong> school districts = 612.<br />
<strong>Status</strong> <strong>of</strong> <strong>Arts</strong> <strong>Education</strong> <strong>in</strong> <strong>Ohio</strong>’s <strong>Public</strong> Schools 33
SUPPORTING HIGH-QUALITY PROFESSIONAL DEVELOPMENT<br />
Support<strong>in</strong>g ongo<strong>in</strong>g learn<strong>in</strong>g and pr<strong>of</strong>essional development <strong>in</strong> the arts ensures<br />
that arts <strong>in</strong>struction improves cont<strong>in</strong>ually.<br />
Accord<strong>in</strong>g to the <strong>Status</strong> Survey, 64 percent <strong>of</strong> schools reported that they provided at least one type<br />
<strong>of</strong> pr<strong>of</strong>essional development <strong>in</strong> the arts to all teachers who taught the arts, <strong>in</strong>clud<strong>in</strong>g general<br />
classroom teachers, general classroom teachers with responsibility for one or more arts areas,<br />
and/or arts specialists (def<strong>in</strong>ed as a teacher with a K-12 multi-age license <strong>in</strong> an arts discipl<strong>in</strong>e or<br />
an Adolescent to Adult license <strong>in</strong> an arts discipl<strong>in</strong>e). This was true for 61 percent <strong>of</strong> elementary,<br />
66 percent <strong>of</strong> middle and 69 percent <strong>of</strong> high schools. Fifty-six percent <strong>of</strong> schools reported that<br />
they provided pr<strong>of</strong>essional development activities <strong>in</strong> the arts specifically for arts specialists.<br />
Forty-seven percent <strong>of</strong> schools reported <strong>of</strong>f-site sem<strong>in</strong>ars or conferences as a pr<strong>of</strong>essional<br />
development strategy for teachers who provide arts <strong>in</strong>struction. Other strategies schools reported<br />
<strong>in</strong>cluded:<br />
• Workshops with pr<strong>of</strong>essional artists (30 percent)<br />
• In-school sem<strong>in</strong>ars or conferences (28 percent)<br />
• Partnerships with colleges or universities (17 percent)<br />
• Workshops by the <strong>Ohio</strong> Department <strong>of</strong> <strong>Education</strong> staff (13 percent)<br />
• Other (3 percent)<br />
Most schools <strong>of</strong>fer at least one <strong>in</strong>centive for engag<strong>in</strong>g <strong>in</strong> pr<strong>of</strong>essional development. As Figure 12<br />
shows, credits and release time were the most common <strong>in</strong>centives.<br />
Figure 12: Percentage <strong>of</strong> Schools Offer<strong>in</strong>g Each Type <strong>of</strong> Incentive<br />
90%<br />
80%<br />
70%<br />
60%<br />
50%<br />
40%<br />
81%<br />
66%<br />
30%<br />
20%<br />
10%<br />
24%<br />
17%<br />
9%<br />
0%<br />
Credits for<br />
Pr<strong>of</strong>essional<br />
Development<br />
Release Time Compensation Recognition by<br />
School Board<br />
Credits Toward<br />
Compensation<br />
<strong>Status</strong> <strong>of</strong> <strong>Arts</strong> <strong>Education</strong> <strong>in</strong> <strong>Ohio</strong>’s <strong>Public</strong> Schools 34
SUPPORTING EXCELLENCE IN PRACTICE<br />
Appropriate staff<strong>in</strong>g, leadership and coord<strong>in</strong>ation, collegial relationships, plann<strong>in</strong>g time<br />
and pr<strong>of</strong>essional learn<strong>in</strong>g create the conditions for excellence <strong>in</strong> teacher practice.<br />
Staff<strong>in</strong>g: N<strong>in</strong>ety-three percent <strong>of</strong> traditional public schools that responded to the <strong>Status</strong> Survey reported<br />
employ<strong>in</strong>g at least one full-time equivalent (FTE) teacher <strong>of</strong> the arts <strong>in</strong> 2009-2010. As shown <strong>in</strong> Figure<br />
13, most <strong>of</strong> those teachers were employed <strong>in</strong> the areas <strong>of</strong> music and visual arts, but 29 percent <strong>of</strong> high<br />
schools reported an FTE teacher <strong>in</strong> drama/theatre.<br />
Figure 13: Percentage <strong>of</strong> Build<strong>in</strong>gs with at Least One FTE <strong>Arts</strong> Educator<br />
Dance Music Drama/<strong>The</strong>atre Visual <strong>Arts</strong><br />
Percentage <strong>of</strong> Build<strong>in</strong>gs<br />
100%<br />
90%<br />
80%<br />
70%<br />
60%<br />
50%<br />
40%<br />
30%<br />
20%<br />
10%<br />
0%<br />
88%<br />
78%<br />
93% 92%<br />
88%<br />
3% 2%<br />
5%<br />
1% 2%<br />
Elementary (at least one<br />
grade K-5)<br />
Middle School (at least one<br />
grade 6-8)<br />
29%<br />
95%<br />
High School (at least one<br />
grade 9-12)<br />
Figure 13 also shows that elementary schools were more likely to employ an FTE music teacher<br />
(88 percent) than an FTE visual arts<br />
teacher (78 percent).<br />
Number <strong>of</strong> Schools Served:<br />
Accord<strong>in</strong>g to ODE data, a majority <strong>of</strong><br />
arts educators work <strong>in</strong> only one school.<br />
As Table 8 shows, music and visual arts<br />
teachers more <strong>of</strong>ten teach <strong>in</strong> more than<br />
one school than dance or drama/theatre<br />
teachers. N<strong>in</strong>e percent <strong>of</strong> the 46 dance<br />
teachers (four teachers) taught <strong>in</strong><br />
multiple schools, and four percent <strong>of</strong><br />
drama/theatre teachers (about 13<br />
teachers) taught <strong>in</strong> multiple schools.<br />
Table 8: Percentages <strong>of</strong> Teachers <strong>in</strong> Each Discipl<strong>in</strong>e<br />
Serv<strong>in</strong>g One, Two, Three and Four or More Schools<br />
# Schools<br />
Served<br />
Music<br />
Teachers<br />
Visual <strong>Arts</strong><br />
Teachers<br />
Dance<br />
Teachers<br />
One 59% 84% 91% 96%<br />
Two 31% 13% 3% 3%<br />
Three 7% 2% 3% 1%<br />
Four or<br />
More<br />
3% 1% 3% 0%<br />
ODE data also showed that 37 percent <strong>of</strong> middle school arts educators taught <strong>in</strong> multiple schools,<br />
compared to those who work <strong>in</strong> elementary schools (31 percent) and high schools (32 percent).<br />
Drama/<strong>The</strong>atre<br />
Teachers<br />
<strong>Status</strong> <strong>of</strong> <strong>Arts</strong> <strong>Education</strong> <strong>in</strong> <strong>Ohio</strong>’s <strong>Public</strong> Schools 35
Average Number <strong>of</strong> Students Per Course: Accord<strong>in</strong>g to ODE data, a total <strong>of</strong> 10,673<br />
teachers <strong>in</strong> traditional public and community schools provided <strong>in</strong>struction <strong>in</strong> one or more arts<br />
discipl<strong>in</strong>es <strong>in</strong> the 2009-2010 school year. Of those teachers, 452 (4 percent) provided <strong>in</strong>struction<br />
<strong>in</strong> more than one arts discipl<strong>in</strong>e.<br />
To present a general idea <strong>of</strong> the number <strong>of</strong> students the average arts educator teaches for each<br />
unique course, Table 9 provides the mean (average) number <strong>of</strong> students per arts teacher <strong>in</strong> each<br />
arts course, based on ODE data. It also provides the maximum number <strong>of</strong> students taught by any<br />
teacher for each arts course.<br />
For example, Visual <strong>Arts</strong> (K-12) has, on average, 108 students enrolled for a s<strong>in</strong>gle teacher across<br />
all schools. <strong>The</strong> maximum number <strong>of</strong> students taught by a s<strong>in</strong>gle teacher <strong>in</strong> a s<strong>in</strong>gle school was<br />
724. One student was the m<strong>in</strong>imum number.<br />
<strong>The</strong> courses that are taught <strong>in</strong> the greatest numbers—Visual <strong>Arts</strong> (K-12), Music (K-8), General<br />
Music, Vocal/Choral Music and Instrumental Music—also have the highest averages <strong>in</strong> numbers<br />
<strong>of</strong> students for a s<strong>in</strong>gle teacher. <strong>The</strong> average number <strong>of</strong> students for a s<strong>in</strong>gle teacher <strong>in</strong> Music (K-<br />
8) —160.5 students —was significantly higher than the average number <strong>of</strong> students taught <strong>in</strong><br />
other arts courses. Two art history courses (AP and regular), music theory (AP and regular) and<br />
three other AP visual arts courses had the lowest average numbers <strong>of</strong> students for a s<strong>in</strong>gle teacher.<br />
Table 9: Mean and Maximum Number <strong>of</strong> Students Taught by a S<strong>in</strong>gle Teacher <strong>in</strong> Each Course<br />
Course<br />
Mean # <strong>of</strong><br />
Students<br />
Max. # <strong>of</strong><br />
Students<br />
Visual <strong>Arts</strong> (K-12) 108.1 724<br />
Course<br />
AP Studio Art - 3D<br />
Design<br />
Mean # <strong>of</strong><br />
Students<br />
Max. # <strong>of</strong><br />
Students<br />
14.5 90<br />
Draw<strong>in</strong>g and Pa<strong>in</strong>t<strong>in</strong>g 67.4 531 AP Studio Art - Draw<strong>in</strong>g 12.8 63<br />
Ceramics 56.6 284 Art History 12.6 222<br />
Design 55.6 274 Music (K-8) 160.5 724<br />
Photography/Filmmak<strong>in</strong>g 51.0 262 General Music 118.9 632<br />
Graphic <strong>Arts</strong>/Unified <strong>Arts</strong> 45.2 244 Vocal/Choral Music 96.5 530<br />
Art Appreciation 43.1 454 Instrumental Music 68.6 432<br />
Crafts 38.8 262 Music Appreciation 23.7 200<br />
Sculpture 30.5 227 Other Music courses 21.2 150<br />
Pr<strong>in</strong>tmak<strong>in</strong>g 23.5 148 Music <strong>The</strong>ory 15.0 350<br />
Advanced Visual arts 20.4 182 AP Music <strong>The</strong>ory 11.7 51<br />
Other Visual <strong>Arts</strong> courses 19.7 156 Introduction to Dance 65.6 405<br />
AP Art History 16.9 100 Comprehensive Dance 33.4 154<br />
AP Studio Art - 2D Design 14.7 96 Drama/<strong>The</strong>atre (K-8) 84.0 480<br />
<strong>The</strong>atre <strong>Arts</strong> 49.2 281<br />
Courses are def<strong>in</strong>ed by the <strong>Ohio</strong> Department <strong>of</strong> <strong>Education</strong>. Total number <strong>of</strong> schools districts = 612.<br />
<strong>Status</strong> <strong>of</strong> <strong>Arts</strong> <strong>Education</strong> <strong>in</strong> <strong>Ohio</strong>’s <strong>Public</strong> Schools 36
Differences <strong>in</strong> Numbers <strong>of</strong> <strong>Arts</strong> Educators Across District Types: Based on ODE data<br />
show<strong>in</strong>g student enrollment <strong>in</strong> the arts for each district type, major urban districts (Type 5) have the<br />
highest number <strong>of</strong> students enrolled <strong>in</strong> music and visual arts, yet they employ fewer arts educators than do<br />
high-<strong>in</strong>come urban/suburban districts (Types 6 and 7) and smaller urban districts (Type 4). Music and<br />
visual arts enrollment <strong>in</strong> Type 7 districts is around half that <strong>of</strong> urban districts, yet music educators <strong>in</strong> Type<br />
7 districts outnumber their counterparts <strong>in</strong> Type 5 (major urban, very high poverty) districts. Similarly,<br />
about 11,000 fewer students are enrolled <strong>in</strong> visual arts <strong>in</strong> Type 6 districts, yet the number <strong>of</strong> visual arts<br />
educators employed <strong>in</strong> Type 5 urban districts is 57 percent <strong>of</strong> the number employed <strong>in</strong> Type 6 districts.<br />
See Tables 10 and 11 for a comparison.<br />
Table 10: Number <strong>of</strong> Music Teachers <strong>in</strong> Each District Type Compared to<br />
Number and Percentage <strong>of</strong> Students Enrolled <strong>in</strong> Music<br />
District Type, Income and Total Students<br />
Number <strong>of</strong> Music<br />
Educators<br />
# Students<br />
Enrolled <strong>in</strong> Music<br />
% Students<br />
Enrolled <strong>in</strong> Music<br />
Type 1 Rural/Agricultural – high poverty –<br />
160,000 students<br />
Type 2 Rural/Agricultural – low poverty –<br />
220,000 students<br />
Type 3 Rural/Small Town – moderate<br />
<strong>in</strong>come – 130,000 students<br />
Type 4 – Urban – high poverty – 290,000<br />
students<br />
Type 5 Major Urban – very high poverty –<br />
360,000 students<br />
Type 6 Urban/Suburban – high <strong>in</strong>come –<br />
420,000 students<br />
Type 7 Urban/Suburban – very high <strong>in</strong>come<br />
– 240,000 students<br />
397 99,200 62%<br />
597 143,000 65%<br />
354 74,100 57%<br />
713 168,200 58%<br />
660 234,000 65%<br />
1,021 222,600 53%<br />
690 115,200 48%<br />
<strong>Status</strong> <strong>of</strong> <strong>Arts</strong> <strong>Education</strong> <strong>in</strong> <strong>Ohio</strong>’s <strong>Public</strong> Schools 37
Table 11: Number <strong>of</strong> Visual <strong>Arts</strong> Teachers <strong>in</strong> Each District Type Compared to<br />
Number and Percentage <strong>of</strong> Students Enrolled <strong>in</strong> Visual <strong>Arts</strong><br />
District Type, Income and Total Students<br />
Number <strong>of</strong> Visual<br />
<strong>Arts</strong> Educators<br />
# Students<br />
Enrolled <strong>in</strong> Visual<br />
<strong>Arts</strong><br />
% Students<br />
Enrolled <strong>in</strong> Visual<br />
<strong>Arts</strong><br />
Type 1 Rural/Agricultural – high poverty –<br />
160,000 students<br />
Type 2 Rural/Agricultural – low poverty –<br />
220,000 students<br />
Type 3 Rural/Small Town – moderate <strong>in</strong>come<br />
– 130,000 students<br />
Type 4 – Urban – high poverty – 290,000<br />
students<br />
Type 5 Major Urban – very high poverty –<br />
360,000 students<br />
Type 6 Urban Suburban – high <strong>in</strong>come –<br />
420,000 students<br />
Type 7 Urban/Suburban – very high <strong>in</strong>come –<br />
240,000 students<br />
585 78,400 49%<br />
905 114,400 52%<br />
470 61,100 47%<br />
989 139,200 48%<br />
646 226,800 63%<br />
1,134 184,800 44%<br />
609 96,000 40%<br />
Number <strong>of</strong> Unique Courses Taught: Accord<strong>in</strong>g to ODE data, most elementary school arts<br />
educators (78 percent) and middle school arts educators (59 percent) provided <strong>in</strong>struction <strong>in</strong> only<br />
one unique arts course. <strong>The</strong> percentage <strong>of</strong> arts educators who taught more than one course was<br />
higher <strong>in</strong> high schools. Thirty-n<strong>in</strong>e percent <strong>of</strong> high school arts educators taught one course; 31<br />
percent taught two courses; 17 percent taught three courses; and 13 percent taught four or more<br />
courses.<br />
Leadership and Coord<strong>in</strong>ation: Accord<strong>in</strong>g to the <strong>Status</strong> Survey, 78 percent <strong>of</strong> schools<br />
reported that their districts had no coord<strong>in</strong>ator for the arts education programs <strong>in</strong> their schools. Ten<br />
percent <strong>of</strong> schools reported hav<strong>in</strong>g a full-time district arts coord<strong>in</strong>ator. N<strong>in</strong>ety-eight percent <strong>of</strong><br />
those arts coord<strong>in</strong>ators were licensed to teach an arts discipl<strong>in</strong>e.<br />
Supplemental Support: Accord<strong>in</strong>g to the <strong>Status</strong> Survey, teachers provid<strong>in</strong>g arts <strong>in</strong>struction <strong>in</strong><br />
<strong>Ohio</strong>’s schools seldom receive curricular, co-curricular or extracurricular <strong>in</strong>structional support<br />
from tra<strong>in</strong>ed <strong>in</strong>dividuals. Curricular support from certified and tra<strong>in</strong>ed teachers, reported by 20<br />
percent <strong>of</strong> survey respondents, was the most common form <strong>of</strong> supplemental support. Volunteers<br />
with tra<strong>in</strong><strong>in</strong>g or experience provided extracurricular support <strong>in</strong> 16 percent <strong>of</strong> schools. Artists <strong>in</strong><br />
residence provided both curricular and extracurricular support <strong>in</strong> 7 percent <strong>of</strong> schools.<br />
<strong>Status</strong> <strong>of</strong> <strong>Arts</strong> <strong>Education</strong> <strong>in</strong> <strong>Ohio</strong>’s <strong>Public</strong> Schools 38
PROVIDING ADEQUATE INSTRUCTIONAL TIME IN THE ARTS<br />
Provid<strong>in</strong>g high-quality arts education <strong>in</strong>cludes ensur<strong>in</strong>g that students have<br />
adequate time to meet local course objectives.<br />
Accord<strong>in</strong>g to the <strong>Status</strong> Survey, more than half <strong>of</strong> schools with grades K-8 reported provid<strong>in</strong>g all<br />
students with arts <strong>in</strong>struction for one hour per week for 36 weeks. Not all schools reported<br />
provid<strong>in</strong>g both music and visual arts, however.<br />
As Figure 14 shows, 55 percent <strong>of</strong> schools reported provid<strong>in</strong>g one hour <strong>of</strong> weekly visual arts<br />
<strong>in</strong>struction <strong>in</strong> grades K-5. That percentage rose after grade 5, reach<strong>in</strong>g 79 percent by grade 8. <strong>The</strong><br />
percentage <strong>of</strong> schools provid<strong>in</strong>g one hour <strong>of</strong> music <strong>in</strong>struction per week was slightly lower (50-52<br />
percent) <strong>in</strong> grades K-4, but it reached 81 percent by grade 8. <strong>The</strong> percentage <strong>of</strong> schools report<strong>in</strong>g<br />
one hour per week <strong>of</strong> dance peaked at 3 percent <strong>in</strong> grade 4 and then decl<strong>in</strong>ed. Percentages<br />
for drama/theatre <strong>in</strong>struction were too low to report.<br />
Figure 14: Percentage <strong>of</strong> Schools Provid<strong>in</strong>g<br />
One Hour or More <strong>of</strong> <strong>Arts</strong> Instruction a Week<br />
100%<br />
90%<br />
80%<br />
70%<br />
60%<br />
58%<br />
55% 55% 55%<br />
51% 55%<br />
50% 50%<br />
59%<br />
55% 55%<br />
52%<br />
64%<br />
58%<br />
79%<br />
72%<br />
81%<br />
79%<br />
50%<br />
40%<br />
30%<br />
20%<br />
10%<br />
1% 1% 1% 1%<br />
3% 2%<br />
0%<br />
Dance Music Visual <strong>Arts</strong><br />
Note: <strong>The</strong> number <strong>of</strong> K-8 schools report<strong>in</strong>g one hour per week <strong>of</strong> drama/theatre was too low to report.<br />
<strong>Status</strong> <strong>of</strong> <strong>Arts</strong> <strong>Education</strong> <strong>in</strong> <strong>Ohio</strong>’s <strong>Public</strong> Schools 39
PROVIDING DEDICATED CLASSROOMS AND ADEQUATE EQUIPMENT<br />
Support<strong>in</strong>g high-quality education <strong>in</strong> the arts <strong>in</strong>cludes creat<strong>in</strong>g physical<br />
environments that support learn<strong>in</strong>g. Classrooms with layout, furniture, equipment,<br />
supplies, technology and texts that are specifically for the arts discipl<strong>in</strong>es taught<br />
allow teachers and students to work most productively.<br />
High schools participat<strong>in</strong>g <strong>in</strong> the <strong>Status</strong> Survey reported the highest usage <strong>of</strong> dedicated<br />
classrooms for music, visual arts and drama/theatre. <strong>The</strong> lowest overall usage <strong>of</strong> dedicated<br />
classrooms for music and visual arts was among middle schools.<br />
Among the few schools <strong>of</strong>fer<strong>in</strong>g dance courses, nearly all elementary and middle schools <strong>of</strong>fer<strong>in</strong>g<br />
dance reported us<strong>in</strong>g dedicated classrooms for dance <strong>in</strong>struction, while 46 percent <strong>of</strong> high schools<br />
<strong>of</strong>fer<strong>in</strong>g dance reported us<strong>in</strong>g dedicated classrooms. Figure 15 shows the percentages by<br />
discipl<strong>in</strong>e and school level.<br />
Twenty-six percent <strong>of</strong> schools reported that they have dedicated spaces for <strong>in</strong>struction <strong>in</strong> media<br />
arts, such as video/film production, TV production, digital art, computer graphics, computer<br />
animation, virtual art, <strong>in</strong>teractive art, etc. Usage <strong>of</strong> dedicated spaces for <strong>in</strong>struction <strong>in</strong> media arts<br />
was highest <strong>in</strong> schools with grades 9-12 (62 percent). Twenty-one percent <strong>of</strong> middle schools and<br />
13 percent <strong>of</strong> elementary schools reported us<strong>in</strong>g dedicated classrooms for media arts <strong>in</strong>struction.<br />
Figure 15: Percentages <strong>of</strong> <strong>Arts</strong> Courses Taught <strong>in</strong><br />
Dedicated Classrooms by <strong>Arts</strong> Discipl<strong>in</strong>e and School Level<br />
100%<br />
96%<br />
94%<br />
90%<br />
85% 84%<br />
80%<br />
70%<br />
60%<br />
62%<br />
67% 67%<br />
56%<br />
69%<br />
Dance<br />
50%<br />
40%<br />
30%<br />
41% 41%<br />
46%<br />
Drama/<strong>The</strong>atre<br />
Music<br />
Visual <strong>Arts</strong><br />
20%<br />
10%<br />
0%<br />
Elementary Middle High<br />
<strong>Status</strong> <strong>of</strong> <strong>Arts</strong> <strong>Education</strong> <strong>in</strong> <strong>Ohio</strong>’s <strong>Public</strong> Schools 40
USING TECHNOLOGY IN ARTS INSTRUCTION<br />
Support<strong>in</strong>g high-quality education <strong>in</strong> the arts <strong>in</strong>cludes us<strong>in</strong>g technologies that<br />
assist teach<strong>in</strong>g and learn<strong>in</strong>g and <strong>in</strong>troduce students to art forms that depend on<br />
technology, such as filmmak<strong>in</strong>g and computer graphics.<br />
Accord<strong>in</strong>g to the <strong>Status</strong> Survey, use <strong>of</strong> technology to assist students <strong>in</strong> the study and creation <strong>of</strong><br />
works <strong>of</strong> art ranged from 13 percent <strong>of</strong> schools for dance and 18 percent for drama/theatre to 36<br />
percent for music and 45 percent for visual arts.<br />
High schools reported the heaviest use <strong>of</strong> technology <strong>in</strong> music, drama/theatre and visual arts<br />
<strong>in</strong>struction. Middle schools led <strong>in</strong> us<strong>in</strong>g technology for dance <strong>in</strong>struction.<br />
Technologies listed by survey participants <strong>in</strong>cluded equipment used primarily <strong>in</strong> produc<strong>in</strong>g<br />
and perform<strong>in</strong>g works <strong>of</strong> art, such as <strong>in</strong>teractive music s<strong>of</strong>tware; equipment that teachers<br />
and students would use primarily to present <strong>in</strong>formation, such as <strong>in</strong>teractive whiteboards;<br />
and equipment that is used for both purposes, such as cameras and digital recorders. Table 12<br />
lists the types <strong>of</strong> technologies that schools specified on the survey.<br />
Table 12: Examples <strong>of</strong> Technologies Schools Reported Us<strong>in</strong>g<br />
Computers<br />
Cameras<br />
Interactive media shows<br />
Digital draw<strong>in</strong>g tables<br />
Pr<strong>in</strong>ters and scanners<br />
Interactive whiteboards<br />
Projector systems, ELMO (mobile<br />
classroom display system that uses a<br />
document camera and wireless tablet)<br />
Keyboards, electronic <strong>in</strong>struments<br />
Smart Music, Sibelius (<strong>in</strong>teractive music<br />
s<strong>of</strong>tware)<br />
Record<strong>in</strong>g and mix<strong>in</strong>g studio<br />
iPods, mp3s<br />
Digital recorders<br />
Light/sound consoles<br />
Video equipment, filmmak<strong>in</strong>g stations<br />
iMovie s<strong>of</strong>tware<br />
<strong>Status</strong> <strong>of</strong> <strong>Arts</strong> <strong>Education</strong> <strong>in</strong> <strong>Ohio</strong>’s <strong>Public</strong> Schools 41
ENRICHING ARTS LEARNING THROUGH COMMUNITY ASSETS<br />
Support<strong>in</strong>g high-quality education <strong>in</strong> the arts <strong>in</strong>cludes enrich<strong>in</strong>g classroom<br />
<strong>in</strong>struction by tak<strong>in</strong>g advantage <strong>of</strong> community-based arts learn<strong>in</strong>g opportunities and<br />
collaborat<strong>in</strong>g with the arts community.<br />
Field trips and <strong>in</strong>vited performances or exhibitions were the most frequently reported types <strong>of</strong><br />
arts experiences made available to students outside the classroom. More susta<strong>in</strong>ed collaboration,<br />
such as an artist-<strong>in</strong>-residence program, was less commonly reported.<br />
• Seventy-two percent <strong>of</strong> schools reported that students took at least one arts-related field trip<br />
<strong>in</strong> the past three years. <strong>The</strong> median number <strong>of</strong> arts-related field trips reported for the previous<br />
three years was four. Field trips with a music focus were most <strong>of</strong>ten the type reported.<br />
• Sixty-four percent <strong>of</strong> schools reported at least one <strong>in</strong>vited performance/exhibition <strong>in</strong> an arts<br />
discipl<strong>in</strong>e <strong>in</strong> the past three years, <strong>in</strong>clud<strong>in</strong>g 70 percent <strong>of</strong> elementary schools, 55 percent <strong>of</strong><br />
middle schools and 61 percent <strong>of</strong> high schools.<br />
• Twenty-one percent <strong>of</strong> schools reported that they had an artist-<strong>in</strong>-residence program <strong>in</strong> the<br />
past three years. Of the artist-<strong>in</strong>-residence programs reported, half were <strong>in</strong> visual arts and half<br />
<strong>in</strong> music.<br />
• Twenty-six percent <strong>of</strong> all schools reported hav<strong>in</strong>g a partnership or collaboration with an<br />
artist, art company or cultural organization. Equal percentages <strong>of</strong> elementary, middle and<br />
high schools reported such partnerships or collaborations.<br />
Schools most <strong>of</strong>ten reported transportation costs and time out <strong>of</strong> the school day as barriers that<br />
prevented students from tak<strong>in</strong>g field trips for the arts. Forty-five percent also reported<br />
event/admission costs. More than half <strong>of</strong> schools without an artist-<strong>in</strong>-residence program reported that<br />
budget constra<strong>in</strong>ts were the greatest obstacle prevent<strong>in</strong>g implementation <strong>of</strong> such a program. Other<br />
obstacles reported were compet<strong>in</strong>g priorities, such as test<strong>in</strong>g (17 percent); lack <strong>of</strong> <strong>in</strong>formation about<br />
the program (12 percent); time <strong>in</strong> the day (6 percent); and <strong>in</strong>sufficient space/facilities (5 percent).<br />
Seven percent reported no obstacles.<br />
Table 13: Benefits <strong>of</strong> Artists <strong>in</strong> Residence Reported by<br />
<strong>Status</strong> Survey Participants<br />
Engaged students and generated new enthusiasm<br />
for teach<strong>in</strong>g and learn<strong>in</strong>g<br />
Provided knowledge about art forms to students<br />
through exhibition or <strong>in</strong>struction<br />
83%<br />
76%<br />
Revealed new skills/abilities <strong>in</strong> students and teachers 75%<br />
Built school pride and stronger sense <strong>of</strong> identity among<br />
students/teachers/staff<br />
Provided knowledge about art forms or arts education<br />
through teacher <strong>in</strong>-service tra<strong>in</strong><strong>in</strong>g<br />
46%<br />
30%<br />
<strong>Status</strong> <strong>of</strong> <strong>Arts</strong> <strong>Education</strong> <strong>in</strong> <strong>Ohio</strong>’s <strong>Public</strong> Schools 42
ANALYSIS: HOW DOES OHIO COMPARE TO A NATIONAL SAMPLE?<br />
<strong>Ohio</strong>’s public schools are lead<strong>in</strong>g or keep<strong>in</strong>g pace with the nation <strong>in</strong> foster<strong>in</strong>g<br />
most <strong>of</strong> the important conditions l<strong>in</strong>ked to high-quality arts <strong>in</strong>struction.<br />
A comparison <strong>of</strong> <strong>Ohio</strong>’s <strong>Status</strong> Survey results and the results <strong>of</strong> a survey by the National Center<br />
for <strong>Education</strong> Statistics (NCES, 2012) <strong>in</strong>dicates that <strong>Ohio</strong> is keep<strong>in</strong>g pace or exceed<strong>in</strong>g progress<br />
<strong>in</strong> align<strong>in</strong>g arts curricula with standards, hir<strong>in</strong>g certified arts specialists, provid<strong>in</strong>g pr<strong>of</strong>essional<br />
development <strong>in</strong> the arts, provid<strong>in</strong>g dedicated spaces for arts <strong>in</strong>struction and implement<strong>in</strong>g arts<br />
assessments.<br />
Implement<strong>in</strong>g <strong>Arts</strong> Learn<strong>in</strong>g Standards: N<strong>in</strong>ety percent <strong>of</strong> <strong>Ohio</strong>’s <strong>Status</strong> Survey<br />
respondents reported that they aligned their courses <strong>of</strong> study <strong>in</strong> the arts with <strong>Ohio</strong>’s arts learn<strong>in</strong>g<br />
standards.<br />
Less than 50 percent <strong>of</strong> the schools that responded to the NCES survey reported that their music<br />
and visual arts curricula were aligned with state or national arts standards. Less than 30 percent <strong>of</strong><br />
respondents said their dance and drama/theatre curricula were standards-based.<br />
Figure 16: Compar<strong>in</strong>g Percentages <strong>of</strong> Schools Aligned with Standards<br />
100%<br />
90%<br />
<strong>Ohio</strong><br />
80%<br />
70%<br />
60%<br />
National<br />
50%<br />
40%<br />
30%<br />
20%<br />
10%<br />
0%<br />
Dance Music Drama/<strong>The</strong>atre Visual <strong>Arts</strong> All <strong>Arts</strong><br />
<strong>Status</strong> <strong>of</strong> <strong>Arts</strong> <strong>Education</strong> <strong>in</strong> <strong>Ohio</strong>’s <strong>Public</strong> Schools 43
Full-Time <strong>Arts</strong> Specialists on Staff: N<strong>in</strong>ety-seven percent <strong>of</strong> <strong>Ohio</strong>’s public schools<br />
respond<strong>in</strong>g to the <strong>Status</strong> Survey reported that they had at least one full-time arts specialist on<br />
staff, and 83 percent reported that arts specialists had appropriate licensure for all arts courses<br />
taught. As Figure 17 <strong>in</strong>dicates, the percentage <strong>of</strong> schools where licensed music and visual arts<br />
specialists teach those two discipl<strong>in</strong>es was slightly higher than the percentage reported by NCES.<br />
While results from both <strong>Ohio</strong> and NCES showed less reliance on certified arts specialists for<br />
dance and drama/theatre, the <strong>Ohio</strong> public schools surveyed reported lower percentages <strong>of</strong> dance<br />
and drama/theatre specialists on staff than did NCES respondents.<br />
Figure 17: Percentage <strong>of</strong> Schools with <strong>Arts</strong> Specialist on Staff<br />
– National Sample Compared to <strong>Ohio</strong> Survey<br />
K-8<br />
Secondary<br />
100%<br />
90%<br />
80%<br />
70%<br />
60%<br />
50%<br />
40%<br />
30%<br />
20%<br />
10%<br />
0%<br />
100%<br />
90%<br />
80%<br />
70%<br />
60%<br />
50%<br />
40%<br />
30%<br />
20%<br />
10%<br />
0%<br />
91%<br />
93%<br />
93%<br />
84%<br />
57%<br />
42%<br />
32%<br />
21%<br />
Dance Music Drama/<strong>The</strong>atre Visual <strong>Arts</strong><br />
National Data <strong>Ohio</strong> Data<br />
97% 96%<br />
94% 93%<br />
69%<br />
73%<br />
54%<br />
37%<br />
Dance* Music Drama/<strong>The</strong>atre* Visual <strong>Arts</strong><br />
National Data<br />
<strong>Ohio</strong> Data<br />
* <strong>The</strong> national data for secondary dance and drama/theatre were from 2008-2009.<br />
<strong>Status</strong> <strong>of</strong> <strong>Arts</strong> <strong>Education</strong> <strong>in</strong> <strong>Ohio</strong>’s <strong>Public</strong> Schools 44
Use <strong>of</strong> Dedicated Classrooms and Technology: As Figure 18 <strong>in</strong>dicates, <strong>Ohio</strong> results were<br />
similar to the national results <strong>in</strong> the percentages <strong>of</strong> schools that used dedicated classrooms for<br />
their music and visual arts courses. While the NCES data showed a lower percentage <strong>of</strong> dedicated<br />
classrooms among schools that <strong>of</strong>fer dance and drama/theatre, <strong>Ohio</strong>’s percentages are even lower.<br />
Except for high school music, technology usage <strong>in</strong> the arts was less prevalent <strong>in</strong> <strong>Ohio</strong> than it is<br />
nationally.<br />
100%<br />
90%<br />
80%<br />
70%<br />
60%<br />
50%<br />
40%<br />
30%<br />
20%<br />
10%<br />
0%<br />
Figure 19: Percentage <strong>of</strong> Schools With Dedicated Classrooms –<br />
National Sample Compared to <strong>Ohio</strong> Survey<br />
35%<br />
22%<br />
84%<br />
84%<br />
43%<br />
33%<br />
80%<br />
84%<br />
Dance Music Drama/<strong>The</strong>atre Visual <strong>Arts</strong><br />
National<br />
<strong>Ohio</strong><br />
Figure 18: Percentage <strong>of</strong> Schools Us<strong>in</strong>g Technology <strong>in</strong> <strong>Arts</strong> Instruction —<br />
National Sample Compared to <strong>Ohio</strong> Survey<br />
100%<br />
90%<br />
80%<br />
70%<br />
60%<br />
50%<br />
40%<br />
30%<br />
20%<br />
10%<br />
0%<br />
43%<br />
33%<br />
68%<br />
40%<br />
64%<br />
72%<br />
48%<br />
43%<br />
Music (K-8) Visual <strong>Arts</strong> (K-8) Music (Secondary) Visual <strong>Arts</strong><br />
(Secondary)<br />
National<br />
<strong>Ohio</strong><br />
<strong>Status</strong> <strong>of</strong> <strong>Arts</strong> <strong>Education</strong> <strong>in</strong> <strong>Ohio</strong>’s <strong>Public</strong> Schools 45
Pr<strong>of</strong>essional Development: Accord<strong>in</strong>g to the <strong>Status</strong> Survey results, 64 percent <strong>of</strong> schools reported<br />
provid<strong>in</strong>g at least one type <strong>of</strong> pr<strong>of</strong>essional development <strong>in</strong> the arts. <strong>The</strong> NCES study, which presented<br />
the same data broken down by arts discipl<strong>in</strong>e, showed a similar picture. <strong>The</strong> percentage <strong>of</strong> districts<br />
nationally <strong>of</strong>fered pr<strong>of</strong>essional development <strong>in</strong> music—the highest percentages <strong>of</strong> the four discipl<strong>in</strong>es—<br />
averaged 65 percent (61 percent <strong>of</strong> elementary schools and 69 percent <strong>of</strong> high schools). Although <strong>Ohio</strong><br />
was typical <strong>of</strong> the nation, the fact rema<strong>in</strong>s that pr<strong>of</strong>essional development opportunities <strong>in</strong> the arts were<br />
not available <strong>in</strong> 36 percent <strong>of</strong> the schools respond<strong>in</strong>g to the <strong>Status</strong> Survey.<br />
Use <strong>of</strong> community resources, assessment and coord<strong>in</strong>ation <strong>of</strong> arts education<br />
are areas where <strong>Ohio</strong> could fall beh<strong>in</strong>d other states.<br />
Use <strong>of</strong> Community Resources: Overall, <strong>Ohio</strong>’s public schools are slightly less active <strong>in</strong> promot<strong>in</strong>g<br />
high quality through the use <strong>of</strong> community resources.<br />
• Twenty-six percent <strong>of</strong> <strong>Ohio</strong>’s public schools reported a partnership or collaboration with an outside<br />
organization <strong>in</strong> the previous three years, while 35 percent <strong>of</strong> the national sample (32 percent <strong>of</strong> K-8<br />
and 38 percent <strong>of</strong> high schools) reported a new or exist<strong>in</strong>g arts partnership <strong>in</strong> the past year.<br />
• <strong>The</strong> percentage <strong>of</strong> <strong>Ohio</strong> public schools that reported conduct<strong>in</strong>g an artist residency dur<strong>in</strong>g the<br />
previous three years was slightly higher than the percentage reported by the national sample for the<br />
year prior to the survey.<br />
• Field trips <strong>in</strong> the arts were less prevalent <strong>in</strong> <strong>Ohio</strong> than nationally. Sixty percent <strong>of</strong> <strong>Ohio</strong>’s public<br />
schools reported sponsor<strong>in</strong>g at least one field trip <strong>in</strong> music <strong>in</strong> the three years prior to the survey.<br />
Sixty-n<strong>in</strong>e percent <strong>of</strong> the national sample reported sponsor<strong>in</strong>g at least one field trip to an arts<br />
performance <strong>in</strong> the previous year. Thirty-five percent <strong>of</strong> <strong>Ohio</strong>’s public schools reported sponsor<strong>in</strong>g<br />
at least one field trip <strong>in</strong> the visual arts <strong>in</strong> the three years prior to the survey. Fifty-eight percent <strong>of</strong><br />
the national sample reported sponsor<strong>in</strong>g at least one field trip to a museum or art gallery <strong>in</strong> the<br />
previous year.<br />
National<br />
<strong>Ohio</strong><br />
Figure 20: Use <strong>of</strong> <strong>Arts</strong> Partnerships and Artist Residencies—<br />
National Sample Compared to <strong>Ohio</strong> Survey<br />
100%<br />
90%<br />
80%<br />
70%<br />
60%<br />
50%<br />
40%<br />
30%<br />
20%<br />
10%<br />
0%<br />
35%<br />
26%<br />
Percentage Report<strong>in</strong>g <strong>Arts</strong><br />
Partnerships<br />
17%<br />
21%<br />
Percentage Report<strong>in</strong>g Artist<br />
Residencies*<br />
<strong>Ohio</strong>’s sample reported on use <strong>of</strong> community resources over the three years prior to the survey.<br />
<strong>The</strong> national sample reported on only one year prior to the survey.<br />
<strong>Status</strong> <strong>of</strong> <strong>Arts</strong> <strong>Education</strong> <strong>in</strong> <strong>Ohio</strong>’s <strong>Public</strong> Schools 46
Assessment: About 12 percent <strong>of</strong> <strong>Ohio</strong>’s <strong>Status</strong> Survey respondents reported us<strong>in</strong>g required<br />
arts assessments—developed either with<strong>in</strong> their districts (8 percent) or externally (4 percent).<br />
Eighteen percent <strong>of</strong> schools <strong>in</strong> the national sample with district arts coord<strong>in</strong>ators reported us<strong>in</strong>g<br />
standardized arts assessments. For both samples, teacher-developed assessments were the norm.<br />
District-Level <strong>Arts</strong> Coord<strong>in</strong>ators: Twenty-two percent <strong>of</strong> <strong>Ohio</strong>’s public schools that<br />
responded to the <strong>Status</strong> Survey reported that a district-level coord<strong>in</strong>ator is responsible for<br />
implementation and evaluation <strong>of</strong> programs <strong>of</strong>fered <strong>in</strong> the arts. In contrast, 66 percent <strong>of</strong><br />
elementary schools and 56 percent <strong>of</strong> high schools <strong>in</strong> the national sample reported that a district<br />
arts coord<strong>in</strong>ator is responsible for arts programs.<br />
Figure 21: Availability <strong>of</strong> <strong>Arts</strong> Coord<strong>in</strong>ators—<br />
National Sample Compared to <strong>Ohio</strong> Sample<br />
National Sample<br />
<strong>Ohio</strong> Sample<br />
22%<br />
39%<br />
61%<br />
78%<br />
No Coord<strong>in</strong>ator<br />
Coord<strong>in</strong>ator Available<br />
No Coord<strong>in</strong>ator<br />
Coord<strong>in</strong>ator Available<br />
NCES data <strong>in</strong>dicate that 66% <strong>of</strong> elementary (K-8) schools and 56% <strong>of</strong> high schools reported that<br />
an arts coord<strong>in</strong>ator was available. <strong>The</strong> chart above shows the average <strong>of</strong> those percentages.<br />
<strong>Status</strong> <strong>of</strong> <strong>Arts</strong> <strong>Education</strong> <strong>in</strong> <strong>Ohio</strong>’s <strong>Public</strong> Schools 47
PRIORITIES: WHERE SHOULD WE FOCUS OUR EFFORTS?<br />
Based on the report f<strong>in</strong>d<strong>in</strong>gs related to conditions <strong>of</strong> high quality, the <strong>Ohio</strong> Alliance<br />
for <strong>Arts</strong> <strong>Education</strong>, the <strong>Ohio</strong> <strong>Arts</strong> <strong>Council</strong> and the <strong>Ohio</strong> Department <strong>of</strong> <strong>Education</strong> will<br />
emphasize the follow<strong>in</strong>g priorities <strong>in</strong> their efforts to help susta<strong>in</strong> and strengthen<br />
<strong>Ohio</strong>’s arts education <strong>in</strong>frastructure:<br />
• Determ<strong>in</strong><strong>in</strong>g where the most significant gaps <strong>in</strong> quality conditions exist and<br />
what can be done to help address those gaps.<br />
• Deepen<strong>in</strong>g educators’ understand<strong>in</strong>g <strong>of</strong> <strong>Ohio</strong>’s newly adopted arts learn<strong>in</strong>g<br />
standards and assist<strong>in</strong>g schools and districts <strong>in</strong> develop<strong>in</strong>g approaches for<br />
implementation.<br />
• Conduct<strong>in</strong>g research about how teachers are assess<strong>in</strong>g their students <strong>in</strong> the<br />
arts and what is be<strong>in</strong>g done to encourage the use <strong>of</strong> district-wide arts<br />
assessments.<br />
• Investigat<strong>in</strong>g further the f<strong>in</strong>d<strong>in</strong>g that district arts coord<strong>in</strong>ators are more<br />
prevalent nationally than they are <strong>in</strong> <strong>Ohio</strong> and devis<strong>in</strong>g strategies to improve<br />
arts supervision across the state.<br />
• Promot<strong>in</strong>g the use <strong>of</strong> community resources to enrich curriculum and<br />
<strong>in</strong>struction, as well as close some <strong>of</strong> the gaps <strong>in</strong> access to dance and<br />
drama/theatre.<br />
<strong>Status</strong> <strong>of</strong> <strong>Arts</strong> <strong>Education</strong> <strong>in</strong> <strong>Ohio</strong>’s <strong>Public</strong> Schools 48
SUSTAINING ARTS EDUCATION<br />
Build<strong>in</strong>g and ma<strong>in</strong>ta<strong>in</strong><strong>in</strong>g a strong, stable arts education<br />
program that adapts to new challenges requires:<br />
• <strong>The</strong> commitment <strong>of</strong> students to arts learn<strong>in</strong>g.<br />
• Allocation <strong>of</strong> the resources needed to ensure<br />
improved access and quality <strong>in</strong> arts education.<br />
• Policies that affirm the value <strong>of</strong> arts education.<br />
• Inclusion <strong>of</strong> arts education programs and arts<br />
educators <strong>in</strong> ongo<strong>in</strong>g school improvement efforts.<br />
F<strong>in</strong>d<strong>in</strong>gs from the <strong>Status</strong> Survey, considered alongside<br />
ODE data from 2009-2010, provide <strong>in</strong>formation about<br />
<strong>Ohio</strong>’s status <strong>in</strong> each <strong>of</strong> those areas.<br />
Courtesy: Steven Bognar, <strong>Arts</strong> Learn<strong>in</strong>g Residency<br />
FINDINGS: WHAT DO THE DATA SAY?<br />
Summary: Nearly all <strong>of</strong> <strong>Ohio</strong>’s students <strong>in</strong> grades K-8 are enrolled <strong>in</strong> visual arts and music<br />
education, but enrollment <strong>in</strong> the arts drops significantly when students reach high school. Most<br />
high schools require arts courses for graduation and assign those courses the same weight as other<br />
courses. <strong>Arts</strong> educators play a role <strong>in</strong> school improvement plann<strong>in</strong>g <strong>in</strong> most schools. Community<br />
fundrais<strong>in</strong>g and support for the arts show that many parents and community groups support arts<br />
education. However, school arts education budgets vary widely and typically do not always<br />
enable the k<strong>in</strong>ds <strong>of</strong> contributions the arts are capable <strong>of</strong> mak<strong>in</strong>g <strong>in</strong> this time <strong>of</strong> educational<br />
transformation.<br />
INCREASING STUDENT ENROLLMENT IN THE ARTS<br />
All students can benefit from enroll<strong>in</strong>g <strong>in</strong> arts courses.<br />
Nearly every school <strong>in</strong> <strong>Ohio</strong> provides opportunities to learn <strong>in</strong> the arts, but not all students enroll.<br />
<strong>Ohio</strong>’s median 2009-2010 enrollment <strong>in</strong> arts courses for students <strong>in</strong> grades K-12 was 61 percent<br />
for music and 46 percent for visual arts. (Enrollment <strong>in</strong> drama/theatre and dance, due to their<br />
limited availability, is too low to allow def<strong>in</strong>ition <strong>of</strong> a median participation rate.) Figure 22 (next<br />
page) shows enrollment by percentiles.<br />
<strong>Status</strong> <strong>of</strong> <strong>Arts</strong> <strong>Education</strong> <strong>in</strong> <strong>Ohio</strong>’s <strong>Public</strong> Schools 49
Figure 22: Median K-12 Enrollment for Music and Visual <strong>Arts</strong><br />
75 th Percentile: 100%<br />
75 th Percentile: 99%<br />
Median: 61%<br />
Median: 61%<br />
Key F<strong>in</strong>d<strong>in</strong>g: Student enrollment levels differ across district types.<br />
Although more <strong>Ohio</strong> students lack<strong>in</strong>g access to the arts are <strong>in</strong> high-poverty districts (Types 1, 4 and 5),<br />
ODE data shown <strong>in</strong> Figure 23 <strong>in</strong>dicate that those districts have the highest enrollment <strong>in</strong> arts courses.<br />
Conversely, urban/suburban school districts that serve students from families with the highest <strong>in</strong>come<br />
levels (Types 6 and 7) have the lowest percentages <strong>of</strong> students enrolled <strong>in</strong> music and visual arts.<br />
Figure 23: Enrollment <strong>in</strong> <strong>Arts</strong> Courses by Discipl<strong>in</strong>e and District Type<br />
Dance Music Drama/<strong>The</strong>atre Visual <strong>Arts</strong><br />
62%<br />
49%<br />
65%<br />
52%<br />
57% 58%<br />
47% 48%<br />
65%<br />
63%<br />
53%<br />
44%<br />
48%<br />
40%<br />
3%<br />
0% 1% 0% 1% 1% 1% 0% 1% 1% 0% 1% 2%<br />
0%<br />
1. Rural/<br />
Agricultura<br />
l - high<br />
poverty<br />
2. Rural/<br />
Agricultura<br />
l - low-tomoderate<br />
median<br />
<strong>in</strong>come<br />
3. Rural/<br />
Small<br />
Town -<br />
moderateto-high<br />
median<br />
<strong>in</strong>come<br />
4. Urban -<br />
high<br />
poverty<br />
5. Major<br />
Urban -<br />
very high<br />
poverty<br />
6. Urban/<br />
Suburban -<br />
very high<br />
median<br />
<strong>in</strong>come<br />
7. Urban/<br />
Suburban -<br />
high<br />
median<br />
<strong>in</strong>come<br />
<strong>Status</strong> <strong>of</strong> <strong>Arts</strong> <strong>Education</strong> <strong>in</strong> <strong>Ohio</strong>’s <strong>Public</strong> Schools 50
Key F<strong>in</strong>d<strong>in</strong>g: High school students show the lowest arts enrollment.<br />
<strong>The</strong> <strong>Status</strong> Survey data <strong>in</strong>dicate that 53 percent <strong>of</strong> high school seniors were set to graduate with more than<br />
one credit <strong>in</strong> the arts <strong>in</strong> 2009-2010. However, the lowest enrollment <strong>in</strong> arts education occurs at the high<br />
school level.<br />
Median enrollment <strong>in</strong> high school music and visual arts courses was lower than 30 percent <strong>in</strong> 2009-2010,<br />
compared to a median enrollment <strong>of</strong> more than 95 percent <strong>in</strong> music and more than 85 percent <strong>in</strong> visual<br />
arts for students at the elementary and middle school level.<br />
Figure 24 illustrates the drops <strong>in</strong> enrollment for music and visual arts that occur after students<br />
complete grades K-8.<br />
Figure 24: Music and Visual <strong>Arts</strong> Median Enrollment by School Level<br />
100%<br />
90%<br />
80%<br />
70%<br />
60%<br />
50%<br />
40%<br />
30%<br />
20%<br />
10%<br />
0%<br />
96%<br />
96%<br />
Music Course(s)<br />
21%<br />
90% 88%<br />
28%<br />
Visual <strong>Arts</strong> Course(s)<br />
Elementary Middle High<br />
MAKING POLICY DECISIONS THAT SUPPORT THE ARTS<br />
District policies that susta<strong>in</strong> arts education reflect the view that the arts are part <strong>of</strong><br />
a complete education and that arts courses can match other subjects <strong>in</strong> academic<br />
rigor and use <strong>of</strong> higher order th<strong>in</strong>k<strong>in</strong>g.<br />
Data from the high schools that participated <strong>in</strong> the <strong>Status</strong> Survey show the follow<strong>in</strong>g:<br />
• Seventy-n<strong>in</strong>e percent <strong>of</strong> participat<strong>in</strong>g high schools reported that students are required to<br />
earn one or more credits <strong>in</strong> the arts for graduation.<br />
• Eighty-four percent weigh arts courses equally with other courses when calculat<strong>in</strong>g<br />
student grade po<strong>in</strong>t averages. Sixteen percent <strong>of</strong> high schools, serv<strong>in</strong>g about 14,000<br />
students, reported lower weight<strong>in</strong>g applied to grades <strong>in</strong> arts courses.<br />
<strong>Status</strong> <strong>of</strong> <strong>Arts</strong> <strong>Education</strong> <strong>in</strong> <strong>Ohio</strong>’s <strong>Public</strong> Schools 51
ROLE OF ARTS EDUCATION IN SCHOOL IMPROVEMENT<br />
Strengthen<strong>in</strong>g arts education is part <strong>of</strong> school improvement, and arts educators<br />
can make a valuable contribution to school improvement plans.<br />
<strong>The</strong> <strong>Status</strong> Survey data show that 74 percent <strong>of</strong> schools reported <strong>in</strong>clud<strong>in</strong>g arts educators on<br />
school improvement teams. Among the schools surveyed, arts educators participated <strong>in</strong><br />
improvement teams at 76 percent <strong>of</strong> elementary schools, 76 percent <strong>of</strong> middle schools and 73<br />
percent <strong>of</strong> high schools.<br />
ALLOCATING ADEQUATE RESOURCES FOR ACCESS AND HIGH QUALITY<br />
High-quality arts <strong>in</strong>struction for all students requires adequate budgets for<br />
equipment, supplies, field trips and other needs.<br />
Accord<strong>in</strong>g to the <strong>Status</strong> Survey, budget<strong>in</strong>g for arts education varied widely.<br />
Total Amounts Budgeted: More than 60 percent <strong>of</strong> schools reported budgets <strong>of</strong> over $1,000 per year<br />
for arts education, while 36 percent reported budgets <strong>of</strong> $1,000 or less. Those <strong>in</strong>cluded 12 percent report<strong>in</strong>g<br />
no budgets for arts education.<br />
Ten percent <strong>of</strong> schools reported budgets <strong>of</strong><br />
more than $10,000 for arts education, as<br />
shown <strong>in</strong> Figure 25. (<strong>The</strong> survey def<strong>in</strong>ed<br />
arts education budgets as dedicated<br />
amounts <strong>of</strong> funds schools received to<br />
support arts education for the current<br />
school year, exclud<strong>in</strong>g teacher salaries,<br />
non-district funds or one-time allocations.<br />
<strong>The</strong> study did not compare arts education<br />
budgets to budgets for other subject areas<br />
and activities.)<br />
Figure 25: Range <strong>of</strong> <strong>Arts</strong> <strong>Education</strong> Budgets<br />
More than<br />
$10,000<br />
10%<br />
$5,000-<br />
10,000 14%<br />
$2,001-<br />
5,000<br />
23%<br />
Per-Student Budgets: N<strong>in</strong>eteen percent<br />
<strong>of</strong> schools reported a budget <strong>of</strong> $1 or less per<br />
student for arts education. Five percent<br />
reported hav<strong>in</strong>g a budget <strong>of</strong> more than $30 per student. (See Figure 26, next page.) <strong>The</strong> maximum per<br />
student budget for arts education reported was $135.<br />
Overall, the median amount <strong>of</strong> per-student fund<strong>in</strong>g was highest for visual arts and music ($3.97 and<br />
$1.52 respectively).<br />
<strong>The</strong> median per-student budget by school type was $3.00 for elementary schools; $4.67 for middle<br />
schools; and $9.16 for high schools. <strong>The</strong> gaps <strong>in</strong> per-student fund<strong>in</strong>g for different school levels tended to<br />
be wider for music. <strong>The</strong> median per student spend<strong>in</strong>g for high school music was $15.50, compared to<br />
$1.01 for elementary schools and $1.61 for middle schools. For visual arts, median per-pupil spend<strong>in</strong>g<br />
was $2.50 for elementary schools, $3.92 for middle schools and $8.89 for high schools.<br />
$0<br />
12%<br />
Less than<br />
$1,000<br />
24%<br />
$1,000-<br />
2,000<br />
17%<br />
<strong>Status</strong> <strong>of</strong> <strong>Arts</strong> <strong>Education</strong> <strong>in</strong> <strong>Ohio</strong>’s <strong>Public</strong> Schools 52
For both visual arts and drama/theatre, 34 percent<br />
<strong>of</strong> schools budgeted more than $5 per<br />
student while 19 percent <strong>of</strong> schools were at<br />
that level for music and 7 percent for dance.<br />
Table 14 shows that high school budgets for<br />
arts education tend to be larger than those<br />
<strong>of</strong> elementary and middle schools. Fiftyseven<br />
percent <strong>of</strong> high schools reported<br />
budgets <strong>of</strong> over $5,000, while 11 percent <strong>of</strong><br />
elementary schools and 22 percent <strong>of</strong><br />
middle schools reported budgets <strong>of</strong> over<br />
$5,000. Moreover, 46 percent <strong>of</strong> elementary<br />
schools and 34 percent <strong>of</strong> middle schools<br />
reported arts education budgets <strong>of</strong> $1,000 or<br />
less, compared to 18 percent <strong>of</strong> high<br />
schools.<br />
Figure 26: <strong>Arts</strong> <strong>Education</strong> Budgets Per Student<br />
$1.01 -$10<br />
58%<br />
$10.01-<br />
$25<br />
18%<br />
$1 or less<br />
19%<br />
More than<br />
$25<br />
5%<br />
Outside Fund<strong>in</strong>g: Accord<strong>in</strong>g to the<br />
<strong>Status</strong> Survey, schools reported<br />
receiv<strong>in</strong>g fund<strong>in</strong>g for arts education<br />
from a variety <strong>of</strong> sources other than the<br />
school district or central <strong>of</strong>fice. Sixtyeight<br />
percent <strong>of</strong> outside fund<strong>in</strong>g to<br />
support arts education came from<br />
booster clubs with a median amount <strong>of</strong><br />
$8,000. Table 15 shows each fund<strong>in</strong>g<br />
source and the percentage <strong>of</strong> total<br />
outside funds provided to schools for<br />
arts education.<br />
Table 14: Budget Range by School Type<br />
Total Annual Budget<br />
for <strong>Arts</strong> <strong>Education</strong><br />
Elementary Middle High<br />
$0 13% 12% 8%<br />
$1-1,000 33% 22% 10%<br />
$1,001-2000 21% 16% 6%<br />
$2,001-5000 22% 28% 19%<br />
$5,001-$10,000 7% 15% 28%<br />
More than $10,000 4% 7% 29%<br />
Table 15: Fund<strong>in</strong>g from Outside Sources—Percentage <strong>of</strong> Schools and Median Amounts<br />
Fund<strong>in</strong>g Source<br />
% <strong>of</strong><br />
Schools<br />
Median<br />
Received<br />
Fund<strong>in</strong>g Source<br />
% <strong>of</strong><br />
Schools<br />
Median<br />
Received<br />
Booster Club 68% $8,000 Local District Foundation 3% $2,000<br />
Other (e.g., parents,<br />
grants, school fundraisers)<br />
10% $2,000 State/County/Local <strong>Arts</strong><br />
<strong>Council</strong>s or Agencies<br />
3% $1,500<br />
Earned Income 6% $2,500 Federal Grants .5% $1,000<br />
PTA/PTO 5% $ 500 <strong>Education</strong> Associations .4% $1,500<br />
Local Bus<strong>in</strong>ess or<br />
Corporation<br />
4% $1,000 State or National<br />
Foundations<br />
.2% $5,000<br />
<strong>Status</strong> <strong>of</strong> <strong>Arts</strong> <strong>Education</strong> <strong>in</strong> <strong>Ohio</strong>’s <strong>Public</strong> Schools 53
ANALYSIS: HOW DOES OHIO COMPARE TO A NATIONAL SAMPLE?<br />
<strong>Ohio</strong> differs slightly from the nation <strong>in</strong> systemic support for arts education.<br />
A comparison <strong>of</strong> <strong>Ohio</strong>’s <strong>Status</strong> Survey results and the results <strong>of</strong> a survey by the National Center for<br />
<strong>Education</strong> Statistics (NCES, 2012) showed slight differences between <strong>Ohio</strong>’s survey responses and those<br />
<strong>of</strong> the national sample regard<strong>in</strong>g the factors that help susta<strong>in</strong> and strengthen arts education.<br />
Includ<strong>in</strong>g the <strong>Arts</strong> <strong>in</strong> Plann<strong>in</strong>g: As shown<br />
<strong>in</strong> Figure 27, <strong>in</strong>clud<strong>in</strong>g arts educators <strong>in</strong> school<br />
improvement teams is less prevalent among<br />
<strong>Ohio</strong> high schools (73 percent) than among high<br />
schools nationally (88 percent).<br />
Requir<strong>in</strong>g <strong>Arts</strong> Courses: Seventy-n<strong>in</strong>e<br />
percent <strong>of</strong> the <strong>Ohio</strong> high schools respond<strong>in</strong>g to<br />
the <strong>Status</strong> Survey <strong>in</strong>cluded at least one credit <strong>in</strong><br />
the arts as part <strong>of</strong> their graduation requirements.<br />
High schools <strong>in</strong> the national sample required<br />
arts courses at a rate <strong>of</strong> 59 percent. <strong>The</strong> national<br />
data did not <strong>in</strong>dicate whether count<strong>in</strong>g high<br />
school-level courses taken <strong>in</strong> grades 7 and 8<br />
toward graduation is widely permitted <strong>in</strong> other<br />
states.<br />
Weight<strong>in</strong>g <strong>Arts</strong> Courses Equally:<br />
Assign<strong>in</strong>g equal weight<strong>in</strong>g to arts courses is<br />
more common nationally (96 percent) than it<br />
is <strong>in</strong> <strong>Ohio</strong> (84 percent).<br />
Figure 27: Percentage <strong>of</strong> Schools That Included <strong>Arts</strong><br />
Specialists <strong>in</strong> Improvement Plann<strong>in</strong>g—National<br />
Sample Compared to <strong>Ohio</strong> Survey<br />
100%<br />
90%<br />
80%<br />
70%<br />
60%<br />
50%<br />
40%<br />
30%<br />
20%<br />
10%<br />
0%<br />
73%<br />
National<br />
76%<br />
<strong>Ohio</strong><br />
88%<br />
73%<br />
K-8 High School<br />
<strong>The</strong> national survey asked about not only school improvement<br />
teams but also site-based management and leadership councils.<br />
<strong>Ohio</strong>’s survey referred only to “school improvement teams.”<br />
Figure 28: <strong>Arts</strong> Course Requirements and Course Weight<strong>in</strong>g<br />
— National Sample Compared to <strong>Ohio</strong> Survey<br />
100%<br />
90%<br />
80%<br />
70%<br />
60%<br />
50%<br />
40%<br />
30%<br />
20%<br />
10%<br />
0%<br />
59%<br />
79%<br />
Percentage <strong>of</strong> High Schools Requir<strong>in</strong>g<br />
at Least One <strong>Arts</strong> Course to Graduate<br />
96%<br />
84%<br />
National<br />
<strong>Ohio</strong><br />
Percentage <strong>of</strong> High Schools Assign<strong>in</strong>g<br />
Equal Weight to <strong>Arts</strong> Courses<br />
<strong>Status</strong> <strong>of</strong> <strong>Arts</strong> <strong>Education</strong> <strong>in</strong> <strong>Ohio</strong>’s <strong>Public</strong> Schools 54
Budget<strong>in</strong>g for the <strong>Arts</strong>: Questions about amounts budgeted for the arts were not part <strong>of</strong> the<br />
national survey, but 68 percent <strong>of</strong> respondents nationally described fund<strong>in</strong>g levels as somewhat or<br />
very adequate. <strong>The</strong> national study presented fund<strong>in</strong>g from all sources, <strong>in</strong>clud<strong>in</strong>g funds provided<br />
by districts, and it <strong>in</strong>cluded all expenditures. <strong>Ohio</strong>’s survey separated district and external fund<strong>in</strong>g<br />
sources and excluded teacher salaries. Although that difference precluded precise comparisons,<br />
both sets <strong>of</strong> data show that parent groups (e.g., booster clubs) carry more responsibility for<br />
fund<strong>in</strong>g than any other outside group. In <strong>Ohio</strong> 73 percent <strong>of</strong> outside fund<strong>in</strong>g comes from booster<br />
clubs and PTA/PTO groups.<br />
PRIORITIES: WHERE SHOULD WE FOCUS OUR EFFORTS?<br />
Based on the report f<strong>in</strong>d<strong>in</strong>gs related to educator, district, parent and community<br />
support, the <strong>Ohio</strong> Alliance for <strong>Arts</strong> <strong>Education</strong>, the <strong>Ohio</strong> <strong>Arts</strong> <strong>Council</strong> and the <strong>Ohio</strong><br />
Department <strong>of</strong> <strong>Education</strong> will emphasize the follow<strong>in</strong>g priorities <strong>in</strong> their efforts to<br />
susta<strong>in</strong> and strengthen <strong>Ohio</strong>’s arts education <strong>in</strong>frastructure:<br />
• Engag<strong>in</strong>g with the research community to <strong>in</strong>vestigate why arts<br />
participation drops <strong>in</strong> high school and why arts enrollment differs along<br />
socioeconomic l<strong>in</strong>es.<br />
• Improv<strong>in</strong>g understand<strong>in</strong>g <strong>of</strong> what constitutes a sufficient per pupil fund<strong>in</strong>g<br />
level <strong>in</strong> the arts.<br />
• Encourag<strong>in</strong>g all school districts to assign the same weight to grades<br />
earned <strong>in</strong> visual and perform<strong>in</strong>g arts courses, <strong>in</strong>clud<strong>in</strong>g advanced<br />
placement arts courses, as they assign to all other courses <strong>of</strong> the same<br />
duration when calculat<strong>in</strong>g students’ grade po<strong>in</strong>t averages.<br />
• Encourag<strong>in</strong>g foundations and other grant-mak<strong>in</strong>g agencies to use <strong>Status</strong><br />
Survey f<strong>in</strong>d<strong>in</strong>gs and data <strong>in</strong> direct<strong>in</strong>g resources to areas <strong>of</strong> greatest need <strong>in</strong><br />
arts education.<br />
<strong>Status</strong> <strong>of</strong> <strong>Arts</strong> <strong>Education</strong> <strong>in</strong> <strong>Ohio</strong>’s <strong>Public</strong> Schools 55
GOALS<br />
WHAT ARE THE MAJOR CHALLENGES AHEAD?<br />
<strong>The</strong> key f<strong>in</strong>d<strong>in</strong>gs presented <strong>in</strong> this report are as follows:<br />
1. N<strong>in</strong>ety-three percent <strong>of</strong> all <strong>Ohio</strong>’s public schools provided access to arts <strong>in</strong>struction <strong>in</strong><br />
2009-2010.<br />
• Of that 93 percent, students <strong>in</strong> 97 percent <strong>of</strong> traditional public schools and 61<br />
percent <strong>of</strong> the 246 community schools had arts <strong>in</strong>struction.<br />
• Ten percent <strong>of</strong> major urban public schools provided no access to the arts.<br />
• Approximately 54,700 students <strong>in</strong> <strong>Ohio</strong>’s public schools did not have access to arts<br />
<strong>in</strong>struction <strong>in</strong> school dur<strong>in</strong>g 2009-2010.<br />
2. Access to dance and drama/theatre was limited <strong>in</strong> K-12 schools:<br />
• Four percent <strong>of</strong> elementary, 1 percent <strong>of</strong> middle and 7 percent <strong>of</strong> high schools <strong>of</strong>fered<br />
<strong>in</strong>struction <strong>in</strong> dance.<br />
• Two percent <strong>of</strong> elementary, 6 percent <strong>of</strong> middle and 39 percent <strong>of</strong> high schools<br />
<strong>of</strong>fered <strong>in</strong>struction <strong>in</strong> drama/theatre.<br />
3. Access to gifted education services <strong>in</strong> the arts also was limited:<br />
• Forty-two percent <strong>of</strong> schools reported that they identified students gifted <strong>in</strong> the visual<br />
and perform<strong>in</strong>g arts.<br />
• Of the 19,771 students identified as gifted, 1,048 received gifted education services.<br />
4. Many <strong>of</strong> the conditions that facilitate high-quality arts <strong>in</strong>struction were widely present <strong>in</strong><br />
<strong>Ohio</strong>’s schools <strong>in</strong> 2009-2010:<br />
• Eighty-three percent <strong>of</strong> <strong>Ohio</strong> arts educators were licensed <strong>in</strong> the discipl<strong>in</strong>es they taught.<br />
• N<strong>in</strong>ety percent <strong>of</strong> public schools reported implement<strong>in</strong>g <strong>Ohio</strong>’s arts learn<strong>in</strong>g standards<br />
and 94 percent reported assess<strong>in</strong>g their students <strong>in</strong> the arts.<br />
• Sixty-four percent <strong>of</strong> schools provided teacher pr<strong>of</strong>essional development <strong>in</strong> the arts.<br />
5. Use <strong>of</strong> dedicated facilities and equipment for arts <strong>in</strong>struction varied by arts discipl<strong>in</strong>e and<br />
<strong>in</strong>creased <strong>in</strong> both the middle school and high school levels.<br />
6. Seventy-eight percent <strong>of</strong> school arts programs do not receive district-level coord<strong>in</strong>ation.<br />
7. Student enrollment <strong>in</strong> the arts dropped sharply <strong>in</strong> high school. Median high school arts<br />
enrollment was below 30 percent <strong>in</strong> 2009-2010.<br />
8. Student enrollment <strong>in</strong> the arts varied across district types. Students <strong>in</strong> high-<strong>in</strong>come<br />
districts participated at lower rates than those <strong>in</strong> high-poverty districts.<br />
<strong>Status</strong> <strong>of</strong> <strong>Arts</strong> <strong>Education</strong> <strong>in</strong> <strong>Ohio</strong>’s <strong>Public</strong> Schools 56
To address the opportunities and<br />
challenges aris<strong>in</strong>g from these f<strong>in</strong>d<strong>in</strong>gs,<br />
the <strong>Ohio</strong> Alliance for <strong>Arts</strong> <strong>Education</strong>,<br />
the <strong>Ohio</strong> <strong>Arts</strong> <strong>Council</strong> and the <strong>Ohio</strong><br />
Department <strong>of</strong> <strong>Education</strong> are work<strong>in</strong>g to<br />
create a statewide environment that<br />
ensures access to arts learn<strong>in</strong>g and equity<br />
<strong>in</strong> how opportunities and resources are<br />
distributed, supports high-quality arts<br />
<strong>in</strong>struction, and susta<strong>in</strong>s strong arts<br />
education programs <strong>in</strong> <strong><strong>Ohio</strong>'s</strong> public<br />
schools.<br />
We present this report to our<br />
stakeholders with three broad goals<br />
for the arts education community—<br />
goals that are based on what we have<br />
learned through this study and that<br />
we believe will focus efforts to<br />
improve arts education opportunities<br />
and outcomes for young people <strong>in</strong><br />
<strong>Ohio</strong>:<br />
• Expand our <strong>in</strong>fluence.<br />
• Strengthen our impact.<br />
• Leverage our <strong>in</strong>vestments.<br />
Courtesy: Debbie Brod, <strong>Arts</strong> Learn<strong>in</strong>g Residency<br />
<strong>Status</strong> <strong>of</strong> <strong>Arts</strong> <strong>Education</strong> <strong>in</strong> <strong>Ohio</strong>’s <strong>Public</strong> Schools 57
Influence Goal<br />
<strong>The</strong> survey data and this report will<br />
engage and guide education leaders,<br />
policy-makers, school adm<strong>in</strong>istrators,<br />
families, local school boards,<br />
researchers, funders and other<br />
stakeholders who can improve arts<br />
education outcomes for large numbers<br />
<strong>of</strong> young people.<br />
Influence Opportunities<br />
Courtesy: Lima City Schools<br />
• Deepen all stakeholders’ understand<strong>in</strong>g <strong>of</strong> how high-quality arts learn<strong>in</strong>g experiences<br />
both contribute to students’ cognitive development and provide rich opportunities for<br />
foster<strong>in</strong>g vital 21st century skills, such as creative problem-solv<strong>in</strong>g, critical th<strong>in</strong>k<strong>in</strong>g<br />
and collaboration.<br />
• Provide plann<strong>in</strong>g and implementation assistance to public schools that <strong>of</strong>fer limited or<br />
no access to arts education.<br />
• Strategically use public and private fund<strong>in</strong>g to <strong>in</strong>crease access to all four arts<br />
discipl<strong>in</strong>es, especially dance and drama/theatre.<br />
• Use research to build a strong advocacy case for ensur<strong>in</strong>g that <strong>Ohio</strong>’s new school<br />
fund<strong>in</strong>g system provides for adequate and equitable learn<strong>in</strong>g opportunities <strong>in</strong> the arts.<br />
• Build awareness <strong>of</strong> state law requir<strong>in</strong>g districts to identify students who are gifted <strong>in</strong><br />
the arts.<br />
• Guide districts <strong>in</strong> implement<strong>in</strong>g policy and dialogue about meet<strong>in</strong>g the needs <strong>of</strong><br />
students who are creatively gifted.<br />
• Support <strong>in</strong>novative partnerships among schools, community organizations and artist<strong>in</strong>-residence<br />
programs to broaden access to dance and drama/theatre education.<br />
• Identify and share <strong>in</strong>novative models for <strong>in</strong>tegrat<strong>in</strong>g technology <strong>in</strong>to arts <strong>in</strong>struction,<br />
enrich<strong>in</strong>g arts educators’ pr<strong>of</strong>essional development and address<strong>in</strong>g <strong>Ohio</strong>’s newly<br />
adopted arts learn<strong>in</strong>g standards.<br />
<strong>Status</strong> <strong>of</strong> <strong>Arts</strong> <strong>Education</strong> <strong>in</strong> <strong>Ohio</strong>’s <strong>Public</strong> Schools 58
Impact Goal<br />
<strong>The</strong> education community will use<br />
the survey data and this report to<br />
advance measureable<br />
improvements <strong>in</strong> arts education<br />
outcomes. Those outcomes will<br />
complement and contribute to the<br />
reforms and <strong>in</strong>itiatives currently<br />
transform<strong>in</strong>g <strong>Ohio</strong>’s system <strong>of</strong><br />
public schools.<br />
Impact Opportunities<br />
Courtesy: Kate Gorman and Patty Mitchell, <strong>Arts</strong><br />
Learn<strong>in</strong>g Residency<br />
• Increase the number <strong>of</strong> arts educators that plan curriculum and align their courses <strong>of</strong><br />
study with the newly adopted arts learn<strong>in</strong>g standards.<br />
• Explore how <strong>Ohio</strong>’s No Child Left Beh<strong>in</strong>d waiver, which <strong>in</strong>creases flexibility <strong>in</strong> how<br />
schools close achievement gaps, can help schools counteract any previous narrow<strong>in</strong>g<br />
<strong>of</strong> the curriculum that may have affected arts education.<br />
• Identify concrete strategies schools can use to address <strong>Ohio</strong>’s Race to the Top goals<br />
through a strong position<strong>in</strong>g <strong>of</strong> arts education <strong>in</strong> their academic programs.<br />
• Use the state’s educational data collection system to track and document<br />
longitud<strong>in</strong>al trends <strong>in</strong> arts education and show the relationships between arts<br />
education outcomes and the factors that affect arts education program quality.<br />
• Improve the capacity <strong>of</strong> arts educators <strong>in</strong> successfully complet<strong>in</strong>g the student growth<br />
measures component <strong>of</strong> the <strong>Ohio</strong> teacher evaluation system.<br />
<strong>Status</strong> <strong>of</strong> <strong>Arts</strong> <strong>Education</strong> <strong>in</strong> <strong>Ohio</strong>’s <strong>Public</strong> Schools 59
Leverage Goal<br />
<strong>The</strong> survey data and this report will<br />
<strong>in</strong>form public policy discussions, guide<br />
<strong>in</strong>vestments <strong>in</strong> susta<strong>in</strong><strong>in</strong>g the state’s arts<br />
education <strong>in</strong>frastructure and promote<br />
<strong>in</strong>creased collaboration among all arts<br />
education stakeholders. This leverage<br />
will lead to improved outcomes for<br />
<strong>Ohio</strong>’s young people and greater public<br />
commitment to susta<strong>in</strong><strong>in</strong>g and<br />
strengthen<strong>in</strong>g arts education statewide.<br />
Courtesy: Steven Bognar, <strong>Arts</strong> Learn<strong>in</strong>g Residency<br />
Leverage Opportunities<br />
• Strengthen coord<strong>in</strong>ation <strong>of</strong> arts education at the district level and develop networks to<br />
assist arts educators <strong>in</strong> effective plann<strong>in</strong>g, pr<strong>of</strong>essional development and shar<strong>in</strong>g <strong>of</strong><br />
resources.<br />
• Harness the energy <strong>of</strong> arts educators <strong>in</strong> efforts to meet 21st century teach<strong>in</strong>g and<br />
learn<strong>in</strong>g challenges by encourag<strong>in</strong>g them to participate <strong>in</strong> school improvement teams<br />
and other reform <strong>in</strong>itiatives. For example, arts educators’ experiences <strong>in</strong> formative<br />
and performance-based assessment can enrich local and statewide efforts <strong>in</strong> those<br />
areas.<br />
• Support partnerships among schools, artists, technology pr<strong>of</strong>essionals and bus<strong>in</strong>esses<br />
to broaden how we view the arts <strong>in</strong> schools today and br<strong>in</strong>g the energy and<br />
immediacy <strong>of</strong> 21st century media and technology <strong>in</strong>to teach<strong>in</strong>g and learn<strong>in</strong>g <strong>in</strong> all arts<br />
discipl<strong>in</strong>es.<br />
• Build capacity for direct<strong>in</strong>g <strong><strong>Ohio</strong>'s</strong> rich array <strong>of</strong> arts and cultural resources toward<br />
help<strong>in</strong>g schools improve access to arts <strong>in</strong>struction, expand curriculum options, meet<br />
<strong>Ohio</strong> learn<strong>in</strong>g standards and build 21st century learn<strong>in</strong>g skills.<br />
• Explore how statewide arts education agencies and organizations can use regional and<br />
multidistrict approaches to assist schools <strong>in</strong> improv<strong>in</strong>g arts supervision and arts<br />
education.<br />
<strong>Status</strong> <strong>of</strong> <strong>Arts</strong> <strong>Education</strong> <strong>in</strong> <strong>Ohio</strong>’s <strong>Public</strong> Schools 60
RESOURCES<br />
This section consists <strong>of</strong> a list <strong>of</strong> references cited <strong>in</strong> the report, followed by additional read<strong>in</strong>gs that further<br />
substantiate those references.<br />
REFERENCES<br />
Asbury, C. & Rich, B. (Eds.). (2008). Learn<strong>in</strong>g, arts and the bra<strong>in</strong>: <strong>The</strong> Dana Consortium report on arts<br />
and cognition. New York: Dana Press. http://www.dana.org<br />
Carroll, M.C. (2007). <strong>Arts</strong> and regional prosperity: Economic impact <strong>of</strong> the creative <strong>in</strong>dustries <strong>in</strong><br />
Northwest <strong>Ohio</strong>. Toledo, <strong>Ohio</strong>: <strong>The</strong> Northwest <strong>Ohio</strong> <strong>Arts</strong> Exchange. Summary at:<br />
http://www.bgsu.edu/downloads/cas/file94747.pdf<br />
Catterall, J.S. (2009). Do<strong>in</strong>g well and do<strong>in</strong>g good by do<strong>in</strong>g art: <strong>The</strong> effects <strong>of</strong> education <strong>in</strong> the visual and<br />
perform<strong>in</strong>g arts on the achievements and values <strong>of</strong> young adults. Los Angeles: Imag<strong>in</strong>ation<br />
Group/I-Group Books.<br />
Catterall, J. S., Dumais, S.A., & Hampden-Thompson, G. (2012). <strong>The</strong> arts and achievement <strong>in</strong> at-risk<br />
youth: F<strong>in</strong>d<strong>in</strong>gs from four longitud<strong>in</strong>al studies, Research Report #55. Wash<strong>in</strong>gton, DC: National<br />
Endowment for the <strong>Arts</strong>. http://www.nea.gov/research/arts-at-risk-youth.pdf<br />
Consortium <strong>of</strong> National <strong>Arts</strong> <strong>Education</strong> Associations. (1995). Opportunity-to-Learn Standards for <strong>Arts</strong><br />
<strong>Education</strong>: Dance, Music, Drama/<strong>The</strong>atre, Visual <strong>Arts</strong>.<br />
Eger, J.M. (2011). <strong>Arts</strong> education and the <strong>in</strong>novation economy: Ensur<strong>in</strong>g America's success <strong>in</strong> the 21st<br />
century. San Diego: San Diego University.<br />
Florida, R. (2002). <strong>The</strong> rise <strong>of</strong> the creative class and how it's transform<strong>in</strong>g work, leisure, community and<br />
everyday life. New York: Basic Books.<br />
Greene, M. (1995). Art and imag<strong>in</strong>ation: Reclaim<strong>in</strong>g the sense <strong>of</strong> possibility. Phi Delta Kappan, 76(5)<br />
378-382.<br />
Herp<strong>in</strong>, S., Wash<strong>in</strong>gton, A.Q., & Li, J. (2012). Improv<strong>in</strong>g the assessment <strong>of</strong> student learn<strong>in</strong>g <strong>in</strong> the arts:<br />
State <strong>of</strong> the field and recommendations. Wash<strong>in</strong>gton: National Endowment for the <strong>Arts</strong>.<br />
http://www.wested.org/cs/we/view/rs/1205<br />
Hetland, L. (2000). Learn<strong>in</strong>g to make music enhances spatial reason<strong>in</strong>g. Journal <strong>of</strong> Aesthetic <strong>Education</strong>.<br />
34(3/4), 179–238. Summary at: http://www.artsedsearch.org.<br />
Lichtenberg, J., Woock, C., & Wright, M. (2008). Ready to <strong>in</strong>novate: Are educators and executives<br />
aligned on the creative read<strong>in</strong>ess <strong>of</strong> the U.S. workforce? New York: <strong>The</strong> Conference Board.<br />
<strong>Status</strong> <strong>of</strong> <strong>Arts</strong> <strong>Education</strong> <strong>in</strong> <strong>Ohio</strong>’s <strong>Public</strong> Schools 61
National Center for <strong>Education</strong> Statistics. (2012). Supplemental Tables to <strong>Arts</strong> <strong>Education</strong> <strong>in</strong> <strong>Public</strong><br />
Elementary and Secondary Schools: 1999–2000 and 2009–10 (NCES 2012–014). Wash<strong>in</strong>gton,<br />
DC: (Author). http://nces.ed.gov/pubsearch/pubs<strong>in</strong>fo.asp?pubid=2012014<br />
National Center on <strong>Education</strong> and the Economy. (2007). Tough choices or tough times: <strong>The</strong> report <strong>of</strong> the<br />
new Commission on the Skills <strong>of</strong> the American Workforce. Wash<strong>in</strong>gton, DC: (Author).<br />
http://www.skillscommission.org/<br />
National Governors Association Center for Best Practices. (2012). New Eng<strong>in</strong>es <strong>of</strong> Growth: Five Roles<br />
for <strong>Arts</strong>, Culture, and Design. Wash<strong>in</strong>gton, DC: (Author). http://www.nga.org/cms/home/ngacenter-for-best-practices/center-publications/page-ehsw-publications/col2-content/ma<strong>in</strong>-contentlist/new-eng<strong>in</strong>es-<strong>of</strong>-growth-five-roles.html<br />
National Institute <strong>of</strong> Child Health and Human Development. (2000). Report <strong>of</strong> the National Read<strong>in</strong>g<br />
Panel. Teach<strong>in</strong>g children to read: An evidence-based assessment <strong>of</strong> the scientific research<br />
literature on read<strong>in</strong>g and its implications for read<strong>in</strong>g <strong>in</strong>struction. (NIH <strong>Public</strong>ation No. 00-4769).<br />
Wash<strong>in</strong>gton, DC: (Author). http://www.nichd.nih.gov/publications/nrp/smallbook.cfm<br />
Noppe-Brandon, S., Deasy, R., & Gitter, C. (2011). F<strong>in</strong>d<strong>in</strong>gs <strong>of</strong> the Imag<strong>in</strong>ation Conversations: <strong>The</strong><br />
lessons <strong>of</strong> a two-year national <strong>in</strong>itiative. New York: L<strong>in</strong>coln Center Institute.<br />
http://www.lc<strong>in</strong>stitute.org/lci-publications/white-papers<br />
Parsad, B. & Spiegelman, M. (2012). <strong>Arts</strong> <strong>Education</strong> <strong>in</strong> <strong>Public</strong> Elementary and Secondary<br />
Schools: 1999–2000 and 2009–10 (NCES 2012–014). National Center for <strong>Education</strong><br />
Statistics, Institute <strong>of</strong> <strong>Education</strong> Sciences, U.S. Department <strong>of</strong> <strong>Education</strong>. Wash<strong>in</strong>gton,<br />
DC. http://nces.ed.gov/pubsearch/pubs<strong>in</strong>fo.asp?pubid=2012014<br />
Partnership for 21st Century Skills. (2012). Overview <strong>of</strong> 21st Century Skills Framework.<br />
http://www.21stcenturyskills.org/<br />
President’s Committee on the <strong>Arts</strong> and Humanities. (2011). Re<strong>in</strong>vest<strong>in</strong>g <strong>in</strong> arts education: W<strong>in</strong>n<strong>in</strong>g<br />
America’s future through creative schools. Wash<strong>in</strong>gton, DC: (Author).<br />
http://www.pcah.gov/sites/default/files/PCAH_Re<strong>in</strong>vest<strong>in</strong>g_4web_0.pdf<br />
President’s Committee on the <strong>Arts</strong> and the Humanities. (1999). Ga<strong>in</strong><strong>in</strong>g the arts advantage:<br />
Lessons from school districts that value arts education. Wash<strong>in</strong>gton, DC: President’s<br />
Committee on the <strong>Arts</strong> and the Humanities and the <strong>Arts</strong> <strong>Education</strong> Partnership.<br />
http://www.tcg.org/pdfs/education/GAAReport.pdf<br />
Quadrant <strong>Arts</strong> <strong>Education</strong> Research. (2012). Debrief<strong>in</strong>g phone call conducted <strong>in</strong> March 2012.<br />
<strong>Status</strong> <strong>of</strong> <strong>Arts</strong> <strong>Education</strong> <strong>in</strong> <strong>Ohio</strong>’s <strong>Public</strong> Schools 62
Ruppert, S. (2006). Critical evidence: How the arts benefit student achievement. Wash<strong>in</strong>gton, DC:<br />
National Assembly <strong>of</strong> State <strong>Arts</strong> Agencies and the <strong>Arts</strong> <strong>Education</strong> Partnership.<br />
Seidel, S., Tishman, S., W<strong>in</strong>ner, E., Hetland, L., & Palmer, P. (2009). <strong>The</strong> qualities <strong>of</strong> quality:<br />
Understand<strong>in</strong>g excellence <strong>in</strong> arts education. Cambridge, MA: Harvard Graduate School <strong>of</strong><br />
<strong>Education</strong>. Retrieved from www.arteducators.org/research/Qualities-<strong>of</strong>-Quality-Understand<strong>in</strong>g-<br />
Excellence-<strong>Arts</strong>-<strong>Education</strong>.pdf<br />
Wagner, T. (2012). Creat<strong>in</strong>g <strong>in</strong>novators: <strong>The</strong> mak<strong>in</strong>g <strong>of</strong> young people who will change the world. New<br />
York: Scribner.<br />
Wagner, T. (2008). <strong>The</strong> global achievement gap: Why even our best schools don't teach the new survival<br />
skills our children need—and what we can do about it. New York: Basic Books.<br />
We<strong>in</strong>berger, N.M. (1998). Bra<strong>in</strong>, behavior, biology, and music: Some research f<strong>in</strong>d<strong>in</strong>gs and their<br />
implications for educational policy. <strong>Arts</strong> <strong>Education</strong> Policy Review, 99(3), 28–36.<br />
http://nmw.bio.uci.edu/publications<br />
W<strong>in</strong>ner, E., Hetland, L., Veenema, S., & Sheridan, K. (2007). Studio th<strong>in</strong>k<strong>in</strong>g: <strong>The</strong> real benefits <strong>of</strong> arts<br />
education. New York: Teachers College Press.<br />
<strong>Status</strong> <strong>of</strong> <strong>Arts</strong> <strong>Education</strong> <strong>in</strong> <strong>Ohio</strong>’s <strong>Public</strong> Schools 63
ADDITIONAL READINGS<br />
American Association <strong>of</strong> School Adm<strong>in</strong>istrators. (2008, March). <strong>The</strong> arts at K-12’s center stage,<br />
f<strong>in</strong>d<strong>in</strong>g ways to <strong>in</strong>crease student access to creative learn<strong>in</strong>g. <strong>The</strong> School Adm<strong>in</strong>istrator.<br />
American Association for Curriculum and Development. (2009, September). Several articles<br />
address 21st century skills and how creativity can be taught. <strong>Education</strong>al Leadership<br />
67(1).<br />
Americans for the <strong>Arts</strong>. (2010). <strong>The</strong> Creative Industries Report. http://www.artsusa.org.<br />
Burnaford, G. (with Brown, S., Dougherty, J., & McLaughl<strong>in</strong>, H. J.). (2007). <strong>Arts</strong> <strong>in</strong>tegration frameworks,<br />
research, and practice: A literature review. Wash<strong>in</strong>gton, DC: <strong>Arts</strong> <strong>Education</strong> Partnership.<br />
http://www.aep-arts.org<br />
Casner-Lotto, J., & Benner, M.W. (2006). Are they really ready to work? Employers’ perspectives on the<br />
basic knowledge and applied skills <strong>of</strong> new entrants to the 21st century U.S. workforce. New York,<br />
NY: <strong>The</strong> Conference Board, the Partnership for 21st Century Skills, Corporate Voices for<br />
Work<strong>in</strong>g Families, and the Society for Human Resource Management.<br />
http://www.cvwork<strong>in</strong>gfamilies.org/publication-toolkits/are-they-really-ready-work-employer’sattitudes-toward-entry-level-workers’-ski<br />
Catterall, J.S., Chapleau, R., & Iwanaga, J. (1999). Involvement <strong>in</strong> the arts and success <strong>in</strong> secondary<br />
school. In. Fiske, E. (Ed.). (1999). Champions <strong>of</strong> change: <strong>The</strong> impact <strong>of</strong> the arts on learn<strong>in</strong>g.<br />
Wash<strong>in</strong>gton, DC: <strong>The</strong> <strong>Arts</strong> <strong>Education</strong> Partnership and the President’s Committee on <strong>Arts</strong> and<br />
Humanities. http://www.aep-arts.org<br />
Center for <strong>Arts</strong> <strong>Education</strong>. (2009, October 19). Stay<strong>in</strong>g <strong>in</strong> school: arts education and New York<br />
City high school graduation rates. http://www.cae-nyc.org/.<br />
Center for <strong>Education</strong>al Policy. (2007). Choices, changes, and challenges: Curriculum and<br />
<strong>in</strong>struction <strong>in</strong> the NCLB era. Wash<strong>in</strong>gton, DC: Author. http://www.cepdc.org/displayDocument.cfm?DocumentID=312<br />
<strong>The</strong> Conference Board, Corporate Voices for Work<strong>in</strong>g Families, Partnership for 21st Century<br />
Skills, Society for Human Resource Management. (2006). Are they really ready to work?<br />
employers’ perspectives on the basic knowledge and applied skills <strong>of</strong> new entrants to the<br />
21st century U.S. workforce, Research Report BED-06, 2006. Summary at:<br />
http://www.artsusa.org/pdf/<strong>in</strong>formation_services/research/policy_roundtable/ready_to_<strong>in</strong><br />
novate.pdf<br />
<strong>Status</strong> <strong>of</strong> <strong>Arts</strong> <strong>Education</strong> <strong>in</strong> <strong>Ohio</strong>’s <strong>Public</strong> Schools 64
Darl<strong>in</strong>g-Hammond, L. (2010, May ). Performance counts: Assessment systems that support highquality<br />
learn<strong>in</strong>g, Wash<strong>in</strong>gton, DC: <strong>Council</strong> <strong>of</strong> Chief State School Officers.<br />
http://www.hewlett.org/uploads/documents/Performance_Counts-<br />
Assessment_Systems_that_Support_High-Quality_Learn<strong>in</strong>g.pdf<br />
Deasy, R.J. (Ed.). (2002). Critical l<strong>in</strong>ks: Learn<strong>in</strong>g <strong>in</strong> the arts and student achievement and social<br />
development. Wash<strong>in</strong>gton, DC: <strong>The</strong> <strong>Arts</strong> <strong>Education</strong> Partnership. http://www.aep-arts.org<br />
Fiske, E.B. (Ed.) (1999). Champions <strong>of</strong> change: <strong>The</strong> impact <strong>of</strong> the arts on learn<strong>in</strong>g. Wash<strong>in</strong>gton,<br />
DC: <strong>Arts</strong> <strong>Education</strong> Partnership. http://www.aep-arts.org<br />
Hennessy, J. L. (2006, April 26). <strong>The</strong> role <strong>of</strong> the creativity and the arts <strong>in</strong> a 21st century<br />
education. <strong>The</strong> Stanford Report. http://news.stanford.edu/news/2006/april26/hentext-<br />
042606.html<br />
Kennedy Center Alliance for <strong>Arts</strong> <strong>Education</strong> Network. (2000). <strong>The</strong> arts beyond the school day:<br />
Extend<strong>in</strong>g the power. http://www.kennedycenter.org/education/kcaaen/resources/afterschool.pdf<br />
McMurrer, J. (2008, February 20). Instructional time <strong>in</strong> elementary schools: A closer look at<br />
changes for specific subjects. Center on <strong>Education</strong> Policy. Web site: http://www.cepdc.org/displayDocument.cfm?DocumentID=309<br />
P<strong>in</strong>k, D. (2006). A whole new m<strong>in</strong>d: Why right-bra<strong>in</strong>ers will rule the future. New York: Riverhead Books.<br />
Sabol, F. R. (2010, February). No Child Left Beh<strong>in</strong>d: A Study <strong>of</strong> Its Impact on Art <strong>Education</strong>. Reston,VA:<br />
National Art <strong>Education</strong> Foundation and National Art <strong>Education</strong> Association.<br />
http://www.arteducators.org/research/NCLB_Proj_Report_2-10.pdf<br />
Society for Neuroscience. (2010). Music tra<strong>in</strong><strong>in</strong>g and the bra<strong>in</strong>. Neuroscience Quarterly, Spr<strong>in</strong>g<br />
2010. Wash<strong>in</strong>gton, DC: Author.<br />
http://www.sfn.org/<strong>in</strong>dex.aspx?pagename=nq_10spr<strong>in</strong>g_<strong>in</strong>side_science<br />
<strong>The</strong> William and Flora Hewlett Foundation. (2008, May 7). An unf<strong>in</strong>ished canvas: Allocat<strong>in</strong>g<br />
fund<strong>in</strong>g and <strong>in</strong>structional time for elementary arts education and an unf<strong>in</strong>ished canvas:<br />
teacher preparation, <strong>in</strong>structional delivery, and pr<strong>of</strong>essional development <strong>in</strong> the arts.<br />
Center for <strong>Education</strong> Policy at SRI International.<br />
http://policyweb.sri.com/cep/publications/AnUnf<strong>in</strong>ishedCanvasFullReport.pdf<br />
<strong>Status</strong> <strong>of</strong> <strong>Arts</strong> <strong>Education</strong> <strong>in</strong> <strong>Ohio</strong>’s <strong>Public</strong> Schools 65
METHODOLOGY<br />
HOW WERE DATA OBTAINED?<br />
In April 2010, Quadrant <strong>Arts</strong> <strong>Education</strong> Research, on behalf <strong>of</strong> the <strong>Ohio</strong> Alliance for <strong>Arts</strong><br />
<strong>Education</strong>, the <strong>Ohio</strong> <strong>Arts</strong> <strong>Council</strong> and the <strong>Ohio</strong> Department <strong>of</strong> <strong>Education</strong>, began a study<br />
<strong>of</strong> the status <strong>of</strong> arts education <strong>in</strong> <strong>Ohio</strong>’s public schools. <strong>The</strong> schools studied <strong>in</strong>cluded<br />
traditional public schools and community schools, which are publicly funded and<br />
publicly accountable schools run by nonpr<strong>of</strong>it educational organizations.<br />
Quadrant first analyzed ODE data on 3,327 schools and 612<br />
school districts. Among the schools that submitted data were<br />
246 community schools. Quadrant then conducted an onl<strong>in</strong>e<br />
survey that was open to all <strong>of</strong> <strong>Ohio</strong>’s public schools from<br />
April through August 2010. Sixteen percent <strong>of</strong> all schools<br />
completed the <strong>Status</strong> Survey (542 schools), represent<strong>in</strong>g<br />
approximately 295,000 <strong>Ohio</strong> students. Among the<br />
respondents were 13 community schools.<br />
F<strong>in</strong>d<strong>in</strong>gs <strong>in</strong> this report are<br />
based on an analysis <strong>of</strong> data<br />
that schools and districts<br />
report to the <strong>Ohio</strong><br />
Department <strong>of</strong> <strong>Education</strong><br />
and the results <strong>of</strong> a<br />
statewide survey <strong>of</strong> public<br />
schools.<br />
<strong>The</strong> study provided <strong>in</strong>formation about access to<br />
courses <strong>in</strong> the arts, patterns <strong>of</strong> student enrollment <strong>in</strong> arts courses, staff<strong>in</strong>g <strong>in</strong> the arts,<br />
conditions under which arts <strong>in</strong>struction is provided, the role <strong>of</strong> arts educators <strong>in</strong> plann<strong>in</strong>g<br />
and other factors that affect the role <strong>of</strong> arts education programs <strong>in</strong> school and district<br />
improvement.<br />
<strong>Status</strong> <strong>of</strong> <strong>Arts</strong> <strong>Education</strong> <strong>in</strong> <strong>Ohio</strong>’s <strong>Public</strong> Schools 66
STAGE 1: ANALYSIS OF ODE DATA<br />
Quadrant <strong>Arts</strong> <strong>Education</strong> Research analyzed 20,249 records for the 2009-2010 school year from ODE’s<br />
<strong>Education</strong> Management Information System (EMIS). EMIS is <strong>Ohio</strong>’s statewide data collection system<br />
for primary and secondary education. It <strong>in</strong>cludes staff, student, district/build<strong>in</strong>g and f<strong>in</strong>ancial data.<br />
School Levels and Types<br />
<strong>The</strong> study <strong>of</strong> ODE data captured student<br />
enrollment by grade level for 29 different arts<br />
courses <strong>of</strong>fered <strong>in</strong> traditional public schools and<br />
community schools. Table 16 shows the<br />
characteristics <strong>of</strong> those schools.<br />
Each record conta<strong>in</strong>ed the school, district, course<br />
name, teacher name and qualifications, grade level<br />
and student enrollment.<br />
<strong>The</strong> duration <strong>of</strong> the courses (e.g., daily, weekly,<br />
semester-long, yearlong, etc.) was not <strong>in</strong>cluded <strong>in</strong><br />
this data.<br />
ODE data enables the identification <strong>of</strong> teachers<br />
who are certified arts specialists—those with<br />
either the Multi-Age license (pre-K-12) or the<br />
Adolescence to Young Adult license (grades 7-12)<br />
<strong>in</strong> an arts discipl<strong>in</strong>e. Teachers with Early<br />
Childhood <strong>Education</strong> licenses also are considered<br />
qualified to teach the arts to grades preK-3.<br />
Teachers who are licensed to teach physical<br />
education can teach dance and those licensed to<br />
teach <strong>in</strong>tegrated language arts can teach<br />
drama/theatre.<br />
District Types<br />
<strong>The</strong> analysis <strong>of</strong> ODE data also reviewed student<br />
enrollment, teacher assignment and arts courses<br />
based on ODE’s seven school district typologies,<br />
which are categories that the ODE uses <strong>in</strong> mak<strong>in</strong>g<br />
comparisons and exam<strong>in</strong><strong>in</strong>g equity among school<br />
districts. <strong>The</strong> seven typologies are based on such<br />
variables as total student enrollment, number <strong>of</strong><br />
employees, geography, median <strong>in</strong>come level,<br />
population density, educational atta<strong>in</strong>ment and the<br />
percentages <strong>of</strong> students who are liv<strong>in</strong>g <strong>in</strong> poverty<br />
and/or belong to a m<strong>in</strong>ority population.<br />
Table 16: Differences <strong>in</strong> School<br />
Characteristics Exam<strong>in</strong>ed <strong>in</strong> ODE Data<br />
Characteristic<br />
School Type (Grade Span)<br />
Elementary (typically grades K-<br />
5)<br />
# <strong>of</strong><br />
Schools<br />
1,864<br />
Middle (typically grades 6-8) 1,469<br />
High (grades 9-12) 1,054<br />
Note: Some schools are counted twice because<br />
they serve two different grade spans (e.g., K-8<br />
schools).<br />
School Type<br />
Traditional <strong>Public</strong> School 2,969<br />
Community School 246<br />
Other 112<br />
Community Category<br />
Island District or College Corner 3<br />
Rural/Agricultural – high<br />
poverty, low median <strong>in</strong>come<br />
Rural/Agricultural – small<br />
student population, low poverty,<br />
low-to- moderate median<br />
<strong>in</strong>come<br />
Rural/Small Town – moderateto-<br />
high median <strong>in</strong>come<br />
Urban – low median <strong>in</strong>come,<br />
high poverty<br />
345<br />
496<br />
272<br />
485<br />
Major Urban – very high poverty 499<br />
Urban/Suburban – high median<br />
<strong>in</strong>come<br />
Urban/Suburban – very high<br />
median <strong>in</strong>come, very low<br />
poverty<br />
596<br />
323<br />
Unclassified 308<br />
<strong>Status</strong> <strong>of</strong> <strong>Arts</strong> <strong>Education</strong> <strong>in</strong> <strong>Ohio</strong>’s <strong>Public</strong> Schools 67
<strong>The</strong> typologies are as follows:<br />
Type 1: Rural/Agricultural — high poverty, low median <strong>in</strong>come: 96 school districts,<br />
approximate total average daily membership (ADM) = 160,000 students.<br />
Type 2: Rural/Agricultural — small student population, low poverty, low-to-moderate<br />
median <strong>in</strong>come: 161 school districts, approximate total ADM = 220,000 students.<br />
Type 3: Rural/Small Town — moderate-to-high median <strong>in</strong>come: 81 school districts,<br />
approximate total ADM = 130,000 students.<br />
Type 4: Urban — low median <strong>in</strong>come, high poverty: 102 school districts, approximate<br />
total ADM = 290,000 students.<br />
Type 5: Major Urban — very high poverty: 15 school districts, approximate total ADM<br />
= 360,000 students.<br />
Type 6: Urban/Suburban — high median <strong>in</strong>come: 107 school districts, approximate<br />
total ADM = 420,000 students.<br />
Type 7: Urban/Suburban — very high median <strong>in</strong>come, very low poverty: 46 school<br />
districts, approximate total ADM = 240,000 students.<br />
Note: Average Daily Membership (ADM) means the number <strong>of</strong> students enrolled <strong>in</strong> a school or district at<br />
a given time <strong>in</strong> the school year.<br />
Community Schools<br />
<strong>The</strong> analysis <strong>of</strong> ODE data <strong>in</strong>cluded 246 community schools, which is about 7 percent <strong>of</strong> all public<br />
community schools. S<strong>in</strong>ce community schools are not <strong>in</strong>cluded <strong>in</strong> ODE’s school district typologies,<br />
<strong>in</strong>formation about how variables such as poverty, <strong>in</strong>come level and demographics affect equity for arts<br />
education <strong>in</strong> community schools could not be analyzed. S<strong>in</strong>ce most community schools serve students <strong>in</strong><br />
low-<strong>in</strong>come communities, it is likely that poverty levels are high among the families <strong>of</strong> community school<br />
students.<br />
STATUS SURVEY BY QUADRANT<br />
<strong>The</strong> pr<strong>in</strong>cipals <strong>of</strong> all <strong>Ohio</strong> public schools, <strong>in</strong>clud<strong>in</strong>g traditional public and community schools,<br />
were asked <strong>in</strong> April 2010 to complete an onl<strong>in</strong>e survey to provide detailed <strong>in</strong>formation about their<br />
arts education programs.<br />
Types <strong>of</strong> Survey Questions<br />
<strong>The</strong> <strong>Status</strong> Survey asked for <strong>in</strong>formation <strong>in</strong> the follow<strong>in</strong>g areas:<br />
• Types <strong>of</strong> music, visual arts, drama/theatre and dance courses (curricular and<br />
extracurricular) <strong>of</strong>fered, by grade level.<br />
• Number <strong>of</strong> students enrolled <strong>in</strong> arts courses.<br />
• Number <strong>of</strong> hours <strong>in</strong> a year dedicated to arts education, by arts discipl<strong>in</strong>e.<br />
<strong>Status</strong> <strong>of</strong> <strong>Arts</strong> <strong>Education</strong> <strong>in</strong> <strong>Ohio</strong>’s <strong>Public</strong> Schools 68
• Certification level <strong>of</strong> teachers provid<strong>in</strong>g arts education.<br />
• Non-salary budgets allocated for arts education.<br />
• Use <strong>of</strong> visit<strong>in</strong>g artists, field trips and artists-<strong>in</strong>-residence.<br />
• Pr<strong>of</strong>essional development <strong>of</strong>fer<strong>in</strong>gs to arts and general classroom teachers.<br />
• <strong>Arts</strong> education policies, such as adoption <strong>of</strong> standards, high school graduation<br />
requirements <strong>in</strong> the arts, student assessment <strong>in</strong> the arts, etc.<br />
Response Rate<br />
A total <strong>of</strong> 542 schools completed the <strong>Status</strong> Survey, represent<strong>in</strong>g at least one school from 303<br />
school districts and 13 community schools. <strong>The</strong> response rate for the survey was 16 percent.<br />
Compared to other states that have conducted similar studies, the response rate was slightly below<br />
average, but adequate for generalizations, accord<strong>in</strong>g to<br />
Quadrant <strong>Arts</strong> <strong>Education</strong> Research (2012). Furthermore, the<br />
data from EMIS, which <strong>in</strong>cludes all schools and districts <strong>in</strong><br />
the state, re<strong>in</strong>forced many <strong>of</strong> the survey f<strong>in</strong>d<strong>in</strong>gs.<br />
Survey respondents serve approximately 295,000 <strong>of</strong> the total<br />
1.8 million <strong>Ohio</strong> K-12 students.<br />
Throughout the survey, “school type” was def<strong>in</strong>ed as<br />
elementary school (any school with one or more grades <strong>in</strong><br />
the K-5 range); middle school (any school with one or more<br />
<strong>The</strong> response rate for the<br />
2010 <strong>Status</strong> Survey was 16<br />
percent. <strong>The</strong> 542 <strong>Ohio</strong> public<br />
schools that responded<br />
represented 303 <strong>of</strong> <strong>Ohio</strong>’s<br />
612 school districts and 13<br />
community schools.<br />
grades <strong>in</strong> the 6-8 range); and high school (any school with one or more grades <strong>in</strong> the 9-12 range).<br />
School build<strong>in</strong>gs serv<strong>in</strong>g broader grade spans, such as K-8 or 7-12 schools, were counted as<br />
multiple school types. Based on those def<strong>in</strong>itions, most <strong>of</strong> the schools participat<strong>in</strong>g <strong>in</strong> the <strong>Status</strong><br />
Survey were elementary schools (64 percent), followed by middle schools (46 percent), and high<br />
schools (24 percent).<br />
Table 17: Type and Size <strong>of</strong> Schools Respond<strong>in</strong>g to the <strong>Status</strong> Survey<br />
School Type<br />
M<strong>in</strong>imum Number<br />
<strong>of</strong> Students<br />
Maximum Number<br />
<strong>of</strong> Students<br />
Median Number <strong>of</strong><br />
Students<br />
Elementary<br />
90 2,713 412<br />
(n=347, 64% <strong>of</strong> schools)<br />
Middle<br />
60 2,713 454<br />
(n=246, 46 % <strong>of</strong> schools)<br />
High<br />
60 4,066 640<br />
(n=131, 24% <strong>of</strong> schools)<br />
Schools serv<strong>in</strong>g wider grade spans than shown <strong>in</strong> Column 1 are counted multiple times.<br />
<strong>Status</strong> <strong>of</strong> <strong>Arts</strong> <strong>Education</strong> <strong>in</strong> <strong>Ohio</strong>’s <strong>Public</strong> Schools 69
PREVIOUS STATUS REPORTS<br />
<strong>The</strong> <strong>Status</strong> <strong>of</strong> <strong>Arts</strong> <strong>Education</strong> <strong>in</strong> <strong>Ohio</strong>’s Schools (<strong>Status</strong> Survey) and analysis <strong>of</strong> ODE data, both<br />
completed <strong>in</strong> 2010, were the first studies to exam<strong>in</strong>e participation, access, conditions for quality<br />
and systemic factors at the school level. Previous surveys exam<strong>in</strong>ed arts education at the district<br />
level.<br />
INITIAL SURVEYS—1989-1996<br />
In 1989, the OAAE, <strong>in</strong> partnership with the OAC and ODE and with the support <strong>of</strong> <strong>Ohio</strong> education<br />
and arts education associations, conducted the first survey <strong>of</strong> arts education <strong>in</strong> <strong>Ohio</strong>’s public<br />
schools. Dr. Roberta Newcomer directed the effort. That survey was replicated <strong>in</strong> 1996, and the<br />
results <strong>of</strong> the two surveys enabled analysis <strong>of</strong> changes <strong>in</strong> arts education over a seven-year period.<br />
DEFINITION OF STRENGTHS AND CHALLENGES—2000<br />
In 2000, OAAE and its partners facilitated a new survey, <strong>Status</strong> <strong>of</strong> <strong>Arts</strong> <strong>Education</strong> <strong>in</strong> <strong>Ohio</strong>’s School<br />
Districts. <strong>The</strong> 2000 survey provided data, trends and <strong>in</strong>sights <strong>in</strong>to the strengths and challenges <strong>of</strong><br />
arts education programs <strong>in</strong> <strong>Ohio</strong>’s schools. <strong>The</strong> results were used to measure progress <strong>in</strong> meet<strong>in</strong>g<br />
goals <strong>of</strong> the OAAE’s strategic plan and <strong>in</strong>itiatives.<br />
EXAMINATION OF PUBLIC ATTITUDES—2005<br />
In 2005, <strong>in</strong> partnership with the OAC, the OAAE surveyed arts education <strong>in</strong> <strong>Ohio</strong>’s public school<br />
districts a fourth time to evaluate public attitudes toward arts education and the status <strong>of</strong> arts<br />
education <strong>in</strong> <strong>Ohio</strong>’s school districts. Data were collected by Kent State University under the<br />
direction <strong>of</strong> Dr. Brian McDonough. Dr. Corw<strong>in</strong> Georges analyzed the results and prepared the<br />
report. Funds to support the 2005 <strong>Status</strong> Survey were designated from the OAC through the<br />
Wallace Foundation State <strong>Arts</strong> Partnership <strong>of</strong> Cultural Participation (START) Program grant<br />
award. Additional support for the 2005 <strong>Status</strong> Survey was provided by the OAAE, Kennedy Center<br />
Alliance for <strong>Arts</strong> <strong>Education</strong> Network (an education program <strong>of</strong> the John F. Kennedy Center for the<br />
Perform<strong>in</strong>g <strong>Arts</strong>), the ODE, the <strong>Ohio</strong> Music <strong>Education</strong> Association, the <strong>Ohio</strong> Art <strong>Education</strong><br />
Association, the <strong>Ohio</strong> <strong>Education</strong>al <strong>The</strong>atre Association, and <strong>Ohio</strong>Dance. <strong>The</strong> 2005 report was based<br />
primarily on questions used <strong>in</strong> the previous surveys, allow<strong>in</strong>g analysts to present trend <strong>in</strong>formation<br />
for most responses.<br />
INITIAL ANALYSIS OF ODE DATA BY OAAE—2009<br />
In August 2009, the OAAE hired the consult<strong>in</strong>g firm Driscoll and Fleeter (Columbus, OH) to<br />
analyze and report on data available from the ODE’s <strong>Education</strong> Management Information System<br />
(EMIS) regard<strong>in</strong>g student enrollment <strong>in</strong> arts courses <strong>in</strong> <strong>Ohio</strong>’s public schools. That project,<br />
supported by the <strong>Ohio</strong> Foundation for Music <strong>Education</strong> and the <strong>Ohio</strong> Art <strong>Education</strong> Association,<br />
helped team members to improve their understand<strong>in</strong>g <strong>of</strong> how ODE data could be used <strong>in</strong> this<br />
current study.<br />
<strong>Status</strong> <strong>of</strong> <strong>Arts</strong> <strong>Education</strong> <strong>in</strong> <strong>Ohio</strong>’s <strong>Public</strong> Schools 70
ACKNOWLEDGEMENTS<br />
We would like to extend our appreciation to the follow<strong>in</strong>g <strong>in</strong>dividuals for their unyield<strong>in</strong>g support <strong>of</strong> the<br />
<strong>Status</strong> <strong>of</strong> <strong>Arts</strong> <strong>Education</strong> <strong>in</strong> <strong>Ohio</strong>’s <strong>Public</strong> Schools.<br />
Project Director:<br />
Corw<strong>in</strong> Georges, Ph.D., Wittenberg University<br />
Project Steer<strong>in</strong>g Committee:<br />
Donna S. Coll<strong>in</strong>s, <strong>Ohio</strong> Alliance for <strong>Arts</strong> <strong>Education</strong><br />
Joanne Eubanks, formerly <strong>of</strong> the <strong>Ohio</strong> <strong>Arts</strong> <strong>Council</strong><br />
Corw<strong>in</strong> Georges, Ph.D., Wittenberg University<br />
Mary Campbell-Zopf, <strong>Ohio</strong> <strong>Arts</strong> <strong>Council</strong><br />
Nancy Pistone, <strong>Ohio</strong> Department <strong>of</strong> <strong>Education</strong><br />
Joan Platz, <strong>Ohio</strong> Alliance for <strong>Arts</strong> <strong>Education</strong><br />
Additional Project Support:<br />
Board <strong>of</strong> Directors, <strong>Ohio</strong> Alliance for <strong>Arts</strong> <strong>Education</strong><br />
Christy Farnbauch, Strategic L<strong>in</strong>ks, LLC<br />
Chiquita Mull<strong>in</strong>s Lee, <strong>Ohio</strong> <strong>Arts</strong> <strong>Council</strong><br />
Sheila Milligan, <strong>Ohio</strong> Department <strong>of</strong> <strong>Education</strong><br />
Marilyn Troyer, Ph.D., formerly <strong>of</strong> the <strong>Ohio</strong><br />
Department <strong>of</strong> <strong>Education</strong><br />
Project Analysis Team:<br />
Pat Cirillo, Ph.D., Cypress Research<br />
Robert B. Morrison, Quadrant <strong>Arts</strong> <strong>Education</strong> Research<br />
Joan Platz, <strong>Ohio</strong> Alliance for <strong>Arts</strong> <strong>Education</strong><br />
Deborah Vrabel, Consultant for project<br />
<strong>The</strong> <strong>Status</strong> <strong>of</strong> <strong>Arts</strong> <strong>Education</strong> <strong>in</strong><br />
<strong>Ohio</strong>’s <strong>Public</strong> Schools was<br />
supported with human and f<strong>in</strong>ancial<br />
resources from the <strong>Ohio</strong> <strong>Arts</strong><br />
<strong>Council</strong>, <strong>Ohio</strong> Department <strong>of</strong><br />
<strong>Education</strong>, <strong>The</strong> John F. Kennedy<br />
Center, <strong>The</strong> National Endowment<br />
for the <strong>Arts</strong>, <strong>Ohio</strong> Foundation for<br />
Music <strong>Education</strong>, <strong>Ohio</strong> Music<br />
<strong>Education</strong> Association, <strong>Ohio</strong> Art<br />
<strong>Education</strong> Association, <strong>Ohio</strong><br />
<strong>Education</strong>al <strong>The</strong>atre Association,<br />
<strong>Ohio</strong>Dance and the <strong>Ohio</strong> Alliance<br />
for <strong>Arts</strong> <strong>Education</strong>.<br />
We also acknowledge the efforts <strong>of</strong><br />
super<strong>in</strong>tendents, pr<strong>in</strong>cipals, teachers<br />
and adm<strong>in</strong>istrative staff <strong>in</strong> <strong>Ohio</strong>’s<br />
schools and districts for their<br />
support <strong>of</strong> data collection and<br />
report<strong>in</strong>g through the survey<br />
conducted by Quadrant <strong>Arts</strong><br />
<strong>Education</strong> Research, and the<br />
<strong>Education</strong>al Management<br />
Information System (EMIS) at the<br />
<strong>Ohio</strong> Department <strong>of</strong> <strong>Education</strong>.<br />
Report Authors:<br />
Joan Platz, <strong>Ohio</strong> Alliance for <strong>Arts</strong> <strong>Education</strong><br />
Deborah Vrabel, Consultant for project<br />
<strong>Status</strong> <strong>of</strong> <strong>Arts</strong> <strong>Education</strong> <strong>in</strong> <strong>Ohio</strong>’s <strong>Public</strong> Schools 71
Donna Coll<strong>in</strong>s,<br />
Executive Director<br />
Dr. Richard A. Ross,<br />
Super<strong>in</strong>tendent <strong>of</strong> <strong>Public</strong> Instruction<br />
Julie S. Henahan,<br />
Executive Director