Oakland Schools District Service Report 2012
Oakland Schools District Service Report 2012
Oakland Schools District Service Report 2012

Create successful ePaper yourself
Turn your PDF publications into a flip-book with our unique Google optimized e-Paper software.
2011-<strong>2012</strong> <strong>District</strong> <strong>Service</strong> <strong>Report</strong> • October <strong>2012</strong> 10<br />
what we do for STUDENTS<br />
Improving student achievement<br />
It is <strong>Oakland</strong> <strong>Schools</strong>’ role to work behind the scenes, helping those who teach<br />
<strong>Oakland</strong> County’s students. Although we do not have direct responsibility for<br />
guiding student achievement, we believe there is indeed a correlation between the<br />
instructional support we provide and the instructional gains made by students of the<br />
teachers we train, coach and support. We are proud to be counted among the reasons<br />
behind the outstanding achievement of <strong>Oakland</strong> County students as we compare<br />
them to the state averages of standardized tests.<br />
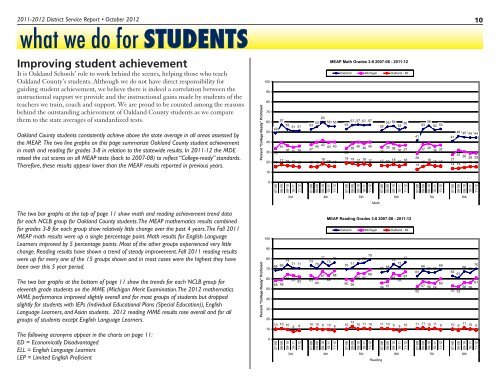
<strong>Oakland</strong> County students consistently achieve above the state average in all areas assessed by<br />
the MEAP. The two line graphs on this page summarize <strong>Oakland</strong> County student achievement<br />
in math and reading for grades 3-8 in relation to the statewide results. In 2011-12 the MDE<br />
raised the cut scores on all MEAP tests (back to 2007-08) to reflect “College-ready” standards.<br />
Therefore, these results appear lower than the MEAP results reported in previous years.<br />
Percent "College Ready" Proficient<br />
100<br />
90<br />
80<br />
70<br />
60<br />
50<br />
40<br />
30<br />
20<br />
10<br />
MEAP Math Grades 3-8 2007-08 - 2011-12<br />
<strong>Oakland</strong> Michigan <strong>Oakland</strong> - MI<br />
60<br />
57<br />
53 51 51<br />
53 55 56 56 57 57 57 57<br />
55 56<br />
53<br />
52 52 55 56<br />
53 52 53<br />
49<br />
46 45 44 44<br />
41<br />
41<br />
40<br />
36<br />
33 35 36 37 40 42 40 40<br />
38 40 39 40 39 38<br />
34<br />
35 36 37 37 39 36 37 32<br />
29<br />
30<br />
27 29 29<br />
15 17 16 16 15 15 15 18 19 19<br />
16 16<br />
17 18 17 17 16<br />
18 16<br />
18<br />
13 16 18 16 16<br />
14 14 15 16 15<br />
0<br />
07-08<br />
08-09<br />
09-10<br />
10-11<br />
11-12<br />
07-08<br />
08-09<br />
09-10<br />
10-11<br />
11-12<br />
07-08<br />
08-09<br />
09-10<br />
10-11<br />
11-12<br />
07-08<br />
08-09<br />
09-10<br />
10-11<br />
11-12<br />
07-08<br />
08-09<br />
09-10<br />
10-11<br />
11-12<br />
07-08<br />
08-09<br />
09-10<br />
10-11<br />
11-12<br />
3rd 4th 5th 6th 7th 8th<br />
Math<br />
The two bar graphs at the top of page 11 show math and reading achievement trend data<br />
for each NCLB group for <strong>Oakland</strong> County students. The MEAP mathematics results combined<br />
for grades 3-8 for each group show relatively little change over the past 4 years. The Fall 2011<br />
MEAP math results were up a single percentage point. Math results for English Language<br />
Learners improved by 5 percentage points. Most of the other groups experienced very little<br />
change. Reading results have shown a trend of steady improvement. Fall 2011 reading results<br />
were up for every one of the 15 groups shown and in most cases were the highest they have<br />
been over this 5 year period.<br />
The two bar graphs at the bottom of page 11 show the trends for each NCLB group for<br />
eleventh grade students on the MME (Michigan Merit Examination. The <strong>2012</strong> mathematics<br />
MME performance improved slightly overall and for most groups of students but dropped<br />
slightly for students with IEPs (Individual Educational Plans (Special Education)), English<br />
Language Learners, and Asian students. <strong>2012</strong> reading MME results rose overall and for all<br />
groups of students except English Language Learners.<br />
The following acronyms appear in the charts on page 11:<br />
ED = Economically Disadvantaged<br />
ELL = English Language Learners<br />
LEP = Limited English Proficient<br />
Percent "College Ready" Proficient<br />
MEAP Reading Grades 3-8 2007-08 - 2011-12<br />
<strong>Oakland</strong> Michigan <strong>Oakland</strong> - MI<br />
100<br />
90<br />
77<br />
74 73 73 76 75 76 79 80<br />
77<br />
75<br />
68 69 71 71 70 70 71 72<br />
67 68 68 69<br />
70<br />
66 66<br />
63<br />
67 68<br />
69<br />
67<br />
60 65 65 65<br />
65 63 62 63 64<br />
63<br />
58 59<br />
60 60 59<br />
56 57 60<br />
57 56<br />
50<br />
56<br />
52<br />
40<br />
30<br />
20<br />
70<br />
68 66<br />
63 61<br />
61<br />
56 56<br />
53 52<br />
10 10 10 8 9<br />
10 10 9 10 8<br />
10 12 10 11 10 11 10<br />
10<br />
9 8 10 11 11 10 11 9 10 9<br />
11 10 9<br />
0<br />
07-08<br />
08-09<br />
09-10<br />
10-11<br />
11-12<br />
07-08<br />
08-09<br />
09-10<br />
10-11<br />
11-12<br />
07-08<br />
08-09<br />
09-10<br />
10-11<br />
11-12<br />
07-08<br />
08-09<br />
09-10<br />
10-11<br />
11-12<br />
07-08<br />
08-09<br />
09-10<br />
10-11<br />
11-12<br />
07-08<br />
08-09<br />
09-10<br />
10-11<br />
11-12<br />
3rd 4th 5th 6th 7th 8th<br />
Reading