Blueback Geodata Investigator Flyer - Ocean - Schlumberger
Blueback Geodata Investigator Flyer - Ocean - Schlumberger
Blueback Geodata Investigator Flyer - Ocean - Schlumberger

You also want an ePaper? Increase the reach of your titles
YUMPU automatically turns print PDFs into web optimized ePapers that Google loves.
<strong>Blueback</strong> Reservoir the preferred and chosen GeoScience Solutions Partner<br />
<strong>Blueback</strong> Reservoir www.blueback-reservoir.com<br />
sales@blueback-reservoir.com | information@blueback-reservoir.com<br />
<strong>Blueback</strong> Support Portal: support.blueback-reservoir.com<br />
<strong>Blueback</strong> <strong>Geodata</strong> <strong>Investigator</strong><br />
Integrated geoscience plotting & data analysis in Petrel<br />
The <strong>Blueback</strong> <strong>Geodata</strong> <strong>Investigator</strong> brings long awaited powerful cross<br />
domain data analysis to Petrel*. The Histogram, Scatterplot, Matrix,<br />
Parallel coordinates and Crossplot windows include a series of tools<br />
that can be applied on well, table and point data, seismic, 3D model<br />
parameters and surface attributes.<br />
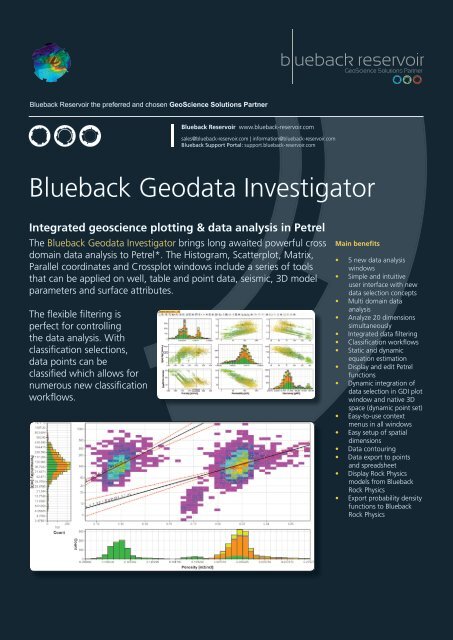
The flexible filtering is<br />
perfect for controlling<br />
the data analysis. With<br />
classification selections,<br />
data points can be<br />
classified which allows for<br />
numerous new classification<br />
workflows.<br />
Main benefits<br />
• 5 new data analysis<br />
windows<br />
• Simple and intuitive<br />
user interface with new<br />
data selection concepts<br />
• Multi domain data<br />
analysis<br />
• Analyze 20 dimensions<br />
simultaneously<br />
• Integrated data filtering<br />
• Classification workflows<br />
• Static and dynamic<br />
equation estimation<br />
• Display and edit Petrel<br />
functions<br />
• Dynamic integration of<br />
data selection in GDI plot<br />
window and native 3D<br />
space (dynamic point set)<br />
• Easy-to-use context<br />
menus in all windows<br />
• Easy setup of spatial<br />
dimensions<br />
• Data contouring<br />
• Data export to points<br />
and spreadsheet<br />
• Display Rock Physics<br />
models from <strong>Blueback</strong><br />
Rock Physics<br />
• Export probability density<br />
functions to <strong>Blueback</strong><br />
Rock Physics
Detailed data analysis is required at all stages<br />
of the Petrel workflow. The <strong>Blueback</strong> <strong>Geodata</strong><br />
<strong>Investigator</strong> addresses the analysis requirements<br />
of the geomodeler and the geophysicist.<br />
Understanding your data distribution and trends<br />
prior to building your reservoir models can be crucial<br />
when making decisions.<br />
Data selection and import<br />
The <strong>Blueback</strong> <strong>Geodata</strong> <strong>Investigator</strong> distinguishes data<br />
selection from data visualization. Data selection is done once<br />
by adding data to an ‘investigation’ - this allows you to share a<br />
single investigation between many plot windows. <strong>Blueback</strong> <strong>Geodata</strong><br />
<strong>Investigator</strong> also allows for spatial analysis (Log vs Time, Depth, X, Y) of<br />
well data.<br />
In addition, the investigation is a container for all new data that<br />
is generated from the <strong>Blueback</strong> <strong>Geodata</strong> <strong>Investigator</strong>, e.g. filters,<br />
annotations, classifications and equations. A performance indicator<br />
is supplied in the dialog, thus helping the user to control the selected<br />
amount of data to match the hardware setup.<br />
Windows and tools<br />
The <strong>Blueback</strong> <strong>Geodata</strong> <strong>Investigator</strong> includes new dedicated windows;<br />
Histogram, Scatterplots, Matrix, Parallel coordinates and Crossplots<br />
(Histograms along X and Y axis in a Scatterplot). These windows contain<br />
a series of tools to control appearance, annotations, filtering and creating<br />
equations for data correlation. Window linking is also provided to better<br />
see cross dimension filtering effects.<br />
The Matrix and Parallel coordinate<br />
windows are specifically designed<br />
to investigate several data<br />
dimensions at once. Locate the<br />
hidden data trends in a simple and<br />
intuitive way!<br />
5 custom windows<br />
• Histogram<br />
• Scatterplot<br />
• Crossplot<br />
• Matrix<br />
• Parallel coordinates<br />
Analyze cross domain data<br />
in the same space<br />
• Wells<br />
• 3D Seismic<br />
• 2D Seismic (also by<br />
vintage)<br />
• Grid model parameters<br />
• Surface attributes<br />
• User defined table data<br />
• Point sets with attribute<br />
Classify data directly in the scatterplot and view<br />
results along the well track<br />
<strong>Blueback</strong> Reservoir www.blueback-reservoir.com<br />
sales@blueback-reservoir.com | information@blueback-reservoir.com<br />
<strong>Blueback</strong> Support Portal: support.blueback-reservoir.com