


Create successful ePaper yourself
Turn your PDF publications into a flip-book with our unique Google optimized e-Paper software.
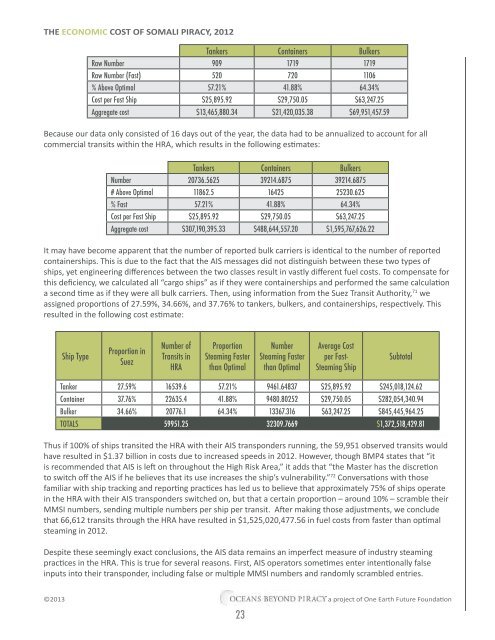
THE ECONOMIC COST OF SOMALI PIRACY, 2012<br />
Tankers Containers Bulkers<br />
Raw Number 909 1719 1719<br />
Raw Number (Fast) 520 720 1106<br />
% Above Optimal 57.21% 41.88% 64.34%<br />
Cost per Fast Ship $25,895.92 $29,750.05 $63,247.25<br />
Aggregate cost $13,465,880.34 $21,420,035.38 $69,951,457.59<br />
Because our data only consisted of 16 days out of the year, the data had to be annualized to account for all<br />
commercial transits within the HRA, which results in the following estimates:<br />
Tankers Containers Bulkers<br />
Number 20736.5625 39214.6875 39214.6875<br />
# Above Optimal 11862.5 16425 25230.625<br />
% Fast 57.21% 41.88% 64.34%<br />
Cost per Fast Ship $25,895.92 $29,750.05 $63,247.25<br />
Aggregate cost $307,190,395.33 $488,644,557.20 $1,595,767,626.22<br />
It may have become apparent that the number of <strong>report</strong>ed bulk carriers is identical to the number of <strong>report</strong>ed<br />
containerships. This is due to the fact that the AIS messages did not distinguish between these two types of<br />
ships, yet engineering differences between the two classes result in vastly different fuel costs. To compensate for<br />
this deficiency, we calculated all “cargo ships” as if they were containerships and performed the same calculation<br />
a second time as if they were all bulk carriers. Then, using information from the Suez Transit Authority, 71 we<br />
assigned proportions of 27.59%, 34.66%, and 37.76% to tankers, bulkers, and containerships, respectively. This<br />
resulted in the following cost estimate:<br />
Ship Type<br />
Proportion in<br />
Suez<br />
Number of<br />
Transits in<br />
HRA<br />
Proportion<br />
Steaming Faster<br />
than Optimal<br />
Number<br />
Steaming Faster<br />
than Optimal<br />
Average Cost<br />
per Fast-<br />
Steaming Ship<br />
Subtotal<br />
Tanker 27.59% 16539.6 57.21% 9461.64837 $25,895.92 $245,018,124.62<br />
Container 37.76% 22635.4 41.88% 9480.80252 $29,750.05 $282,054,340.94<br />
Bulker 34.66% 20776.1 64.34% 13367.316 $63,247.25 $845,445,964.25<br />
TOTALS 59951.25 32309.7669 $1,372,518,429.81<br />
Thus if 100% of ships transited the HRA with their AIS transponders running, the 59,951 observed transits would<br />
have resulted in $1.37 billion in costs due to increased speeds in 2012. However, though BMP4 states that “it<br />
is recommended that AIS is left on throughout the High Risk Area,” it adds that “the Master has the discretion<br />
to switch off the AIS if he believes that its use increases the ship’s vulnerability.” 72 Conversations with those<br />
familiar with ship tracking and <strong>report</strong>ing practices has led us to believe that approximately 75% of ships operate<br />
in the HRA with their AIS transponders switched on, but that a certain proportion – around 10% – scramble their<br />
MMSI numbers, sending multiple numbers per ship per transit. After making those adjustments, we conclude<br />
that 66,612 transits through the HRA have resulted in $1,525,020,477.56 in fuel costs from faster than optimal<br />
steaming in 2012.<br />
Despite these seemingly exact conclusions, the AIS data remains an imperfect measure of industry steaming<br />
practices in the HRA. This is true for several reasons. First, AIS operators sometimes enter intentionally false<br />
inputs into their transponder, including false or multiple MMSI numbers and randomly scrambled entries.<br />
©2013<br />
23<br />
a project of One Earth Future Foundation