Create successful ePaper yourself
Turn your PDF publications into a flip-book with our unique Google optimized e-Paper software.
THE ECONOMIC COST OF SOMALI PIRACY, 2012<br />
Second, basic user error sometimes results in faulty information. Finally, some users simply choose not to steam<br />
through the HRA with their AIS transponders switched on. Moreover, there are variables such as current, wind,<br />
and hull condition that affect a ship’s fuel consumption rate that are not captured in our data.<br />
Nonetheless, our results are in line with our previous estimate that $2.7 billion was spent on increased speeds in<br />
2011, especially when held up against our finding that both the proportion of ships speeding and the amount by<br />
which they speed dropped from 2011 to 2012. Moreover, our finding that there are over 65,000 annual transits<br />
through the Indian Ocean each year (as opposed to the 42,450 estimated in 2011) is in line with estimates given<br />
by those familiar with vessel tracking and <strong>report</strong>ing practices. Thus despite the shortcomings inherent in our<br />
methodology, our result falls well within reasonably acceptable estimates that have been endorsed by experts in<br />
the field.<br />
In addition to providing information on the cost of increased speed, the satellite AIS data used in this section<br />
sheds some light on different ships’ abilities to comply with BMP4’s recommendation that ships transiting the<br />
HRA should travel at a speed of at least 18 knots, as well as the effects of the summer and winter monsoon<br />
seasons on steaming practices.<br />
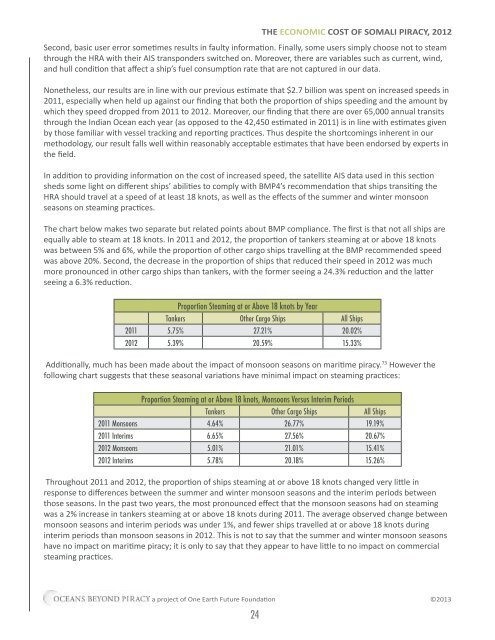
The chart below makes two separate but related points about BMP compliance. The first is that not all ships are<br />
equally able to steam at 18 knots. In 2011 and 2012, the proportion of tankers steaming at or above 18 knots<br />
was between 5% and 6%, while the proportion of other cargo ships travelling at the BMP recommended speed<br />
was above 20%. Second, the decrease in the proportion of ships that reduced their speed in 2012 was much<br />
more pronounced in other cargo ships than tankers, with the former seeing a 24.3% reduction and the latter<br />
seeing a 6.3% reduction.<br />
Proportion Steaming at or Above 18 knots by Year<br />
Tankers Other Cargo Ships All Ships<br />
2011 5.75% 27.21% 20.02%<br />
2012 5.39% 20.59% 15.33%<br />
Additionally, much has been made about the impact of monsoon seasons on maritime piracy. 73 However the<br />
following chart suggests that these seasonal variations have minimal impact on steaming practices:<br />
Proportion Steaming at or Above 18 knots, Monsoons Versus Interim Periods<br />
Tankers Other Cargo Ships All Ships<br />
2011 Monsoons 4.64% 26.77% 19.19%<br />
2011 Interims 6.65% 27.56% 20.67%<br />
2012 Monsoons 5.01% 21.01% 15.41%<br />
2012 Interims 5.78% 20.18% 15.26%<br />
Throughout 2011 and 2012, the proportion of ships steaming at or above 18 knots changed very little in<br />
response to differences between the summer and winter monsoon seasons and the interim periods between<br />
those seasons. In the past two years, the most pronounced effect that the monsoon seasons had on steaming<br />
was a 2% increase in tankers steaming at or above 18 knots during 2011. The average observed change between<br />
monsoon seasons and interim periods was under 1%, and fewer ships travelled at or above 18 knots during<br />
interim periods than monsoon seasons in 2012. This is not to say that the summer and winter monsoon seasons<br />
have no impact on maritime piracy; it is only to say that they appear to have little to no impact on commercial<br />
steaming practices.<br />
a project of One Earth Future Foundation ©2013<br />
24


