


Create successful ePaper yourself
Turn your PDF publications into a flip-book with our unique Google optimized e-Paper software.
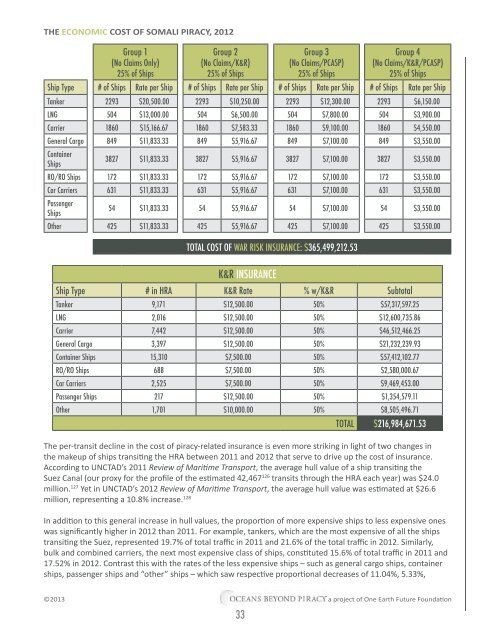
THE ECONOMIC COST OF SOMALI PIRACY, 2012<br />
Group 1<br />
(No Claims Only)<br />
25% of Ships<br />
Group 2<br />
(No Claims/K&R)<br />
25% of Ships<br />
Group 3<br />
(No Claims/PCASP)<br />
25% of Ships<br />
Group 4<br />
(No Claims/K&R/PCASP)<br />
25% of Ships<br />
Ship Type # of Ships Rate per Ship # of Ships Rate per Ship # of Ships Rate per Ship # of Ships Rate per Ship<br />
Tanker 2293 $20,500.00 2293 $10,250.00 2293 $12,300.00 2293 $6,150.00<br />
LNG 504 $13,000.00 504 $6,500.00 504 $7,800.00 504 $3,900.00<br />
Carrier 1860 $15,166.67 1860 $7,583.33 1860 $9,100.00 1860 $4,550.00<br />
General Cargo 849 $11,833.33 849 $5,916.67 849 $7,100.00 849 $3,550.00<br />
Container<br />
Ships<br />
3827 $11,833.33 3827 $5,916.67 3827 $7,100.00 3827 $3,550.00<br />
RO/RO Ships 172 $11,833.33 172 $5,916.67 172 $7,100.00 172 $3,550.00<br />
Car Carriers 631 $11,833.33 631 $5,916.67 631 $7,100.00 631 $3,550.00<br />
Passenger<br />
Ships<br />
54 $11,833.33 54 $5,916.67 54 $7,100.00 54 $3,550.00<br />
Other 425 $11,833.33 425 $5,916.67 425 $7,100.00 425 $3,550.00<br />
TOTAL COST OF WAR RISK INSURANCE: $365,499,212.53<br />
K&R INSURANCE<br />
Ship Type # in HRA K&R Rate % w/K&R Subtotal<br />
Tanker 9,171 $12,500.00 50% $57,317,597.25<br />
LNG 2,016 $12,500.00 50% $12,600,735.86<br />
Carrier 7,442 $12,500.00 50% $46,512,466.25<br />
General Cargo 3,397 $12,500.00 50% $21,232,239.93<br />
Container Ships 15,310 $7,500.00 50% $57,412,102.77<br />
RO/RO Ships 688 $7,500.00 50% $2,580,000.67<br />
Car Carriers 2,525 $7,500.00 50% $9,469,453.00<br />
Passenger Ships 217 $12,500.00 50% $1,354,579.11<br />
Other 1,701 $10,000.00 50% $8,505,496.71<br />
TOTAL $216,984,671.53<br />
The per-transit decline in the cost of piracy-related insurance is even more striking in light of two changes in<br />
the makeup of ships transiting the HRA between 2011 and 2012 that serve to drive up the cost of insurance.<br />
According to UNCTAD’s 2011 Review of Maritime Transport, the average hull value of a ship transiting the<br />
Suez Canal (our proxy for the profile of the estimated 42,467 126 transits through the HRA each year) was $24.0<br />
million. 127 Yet in UNCTAD’s 2012 Review of Maritime Transport, the average hull value was estimated at $26.6<br />
million, representing a 10.8% increase. 128<br />
In addition to this general increase in hull values, the proportion of more expensive ships to less expensive ones<br />
was significantly higher in 2012 than 2011. For example, tankers, which are the most expensive of all the ships<br />
transiting the Suez, represented 19.7% of total traffic in 2011 and 21.6% of the total traffic in 2012. Similarly,<br />
bulk and combined carriers, the next most expensive class of ships, constituted 15.6% of total traffic in 2011 and<br />
17.52% in 2012. Contrast this with the rates of the less expensive ships – such as general cargo ships, container<br />
ships, passenger ships and “other” ships – which saw respective proportional decreases of 11.04%, 5.33%,<br />
©2013<br />
33<br />
a project of One Earth Future Foundation