2005 - Oil India Limited
2005 - Oil India Limited
2005 - Oil India Limited

You also want an ePaper? Increase the reach of your titles
YUMPU automatically turns print PDFs into web optimized ePapers that Google loves.
OIL beyond territorial barriers<br />
The Wealth Creators and Foreign Exchange Earners<br />
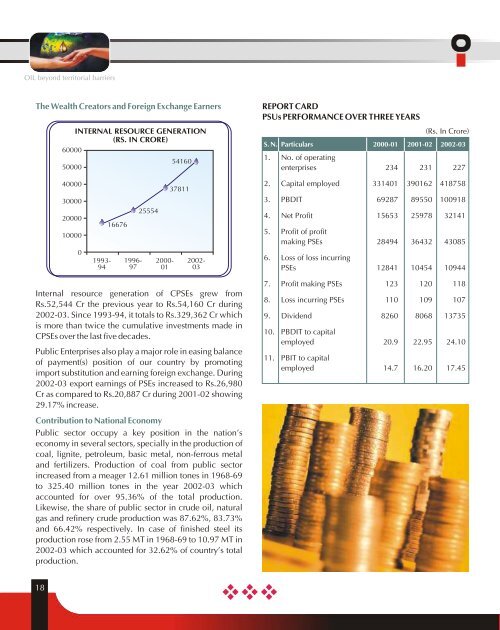
INTERNAL RESOURCE GENERATION<br />
(RS. IN CRORE)<br />
60000<br />
54160<br />
50000<br />
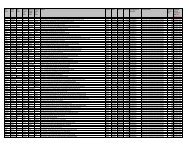
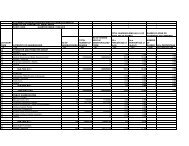
REPORT CARD<br />
PSUs PERFORMANCE OVER THREE YEARS<br />
(Rs. In Crore)<br />
S. N. Particulars 2000-01 2001-02 2002-03<br />
1. No. of operating<br />
enterprises 234 231 227<br />
40000<br />
30000<br />
20000<br />
10000<br />
0<br />
1993-<br />
94<br />
16676<br />
1996-<br />
97<br />
25554<br />
2000-<br />
01<br />
37811<br />
2002-<br />
03<br />
2. Capital employed 331401 390162 418758<br />
3. PBDIT 69287 89550 100918<br />
4. Net Profit 15653 25978 32141<br />
5. Profit of profit<br />
making PSEs 28494 36432 43085<br />
6. Loss of loss incurring<br />
PSEs 12841 10454 10944<br />
Internal resource generation of CPSEs grew from<br />
Rs.52,544 Cr the previous year to Rs.54,160 Cr during<br />
2002-03. Since 1993-94, it totals to Rs.329,362 Cr which<br />
is more than twice the cumulative investments made in<br />
CPSEs over the last five decades.<br />
Public Enterprises also play a major role in easing balance<br />
of payment(s) position of our country by promoting<br />
import substitution and earning foreign exchange. During<br />
2002-03 export earnings of PSEs increased to Rs.26,980<br />
Cr as compared to Rs.20,887 Cr during 2001-02 showing<br />
29.17% increase.<br />
Contribution to National Economy<br />
Public sector occupy a key position in the nation's<br />
economy in several sectors, specially in the production of<br />
coal, lignite, petroleum, basic metal, non-ferrous metal<br />
and fertilizers. Production of coal from public sector<br />
increased from a meager 12.61 million tones in 1968-69<br />
to 325.40 million tones in the year 2002-03 which<br />
accounted for over 95.36% of the total production.<br />
Likewise, the share of public sector in crude oil, natural<br />
gas and refinery crude production was 87.62%, 83.73%<br />
and 66.42% respectively. In case of finished steel its<br />
production rose from 2.55 MT in 1968-69 to 10.97 MT in<br />
2002-03 which accounted for 32.62% of country's total<br />
production.<br />
7. Profit making PSEs 123 120 118<br />
8. Loss incurring PSEs 110 109 107<br />
9. Dividend 8260 8068 13735<br />
10. PBDIT to capital<br />
employed 20.9 22.95 24.10<br />
11. PBIT to capital<br />
employed 14.7 16.20 17.45<br />
18