ECONOMIC FORECASTING REVIEW - Parsons Brinckerhoff
ECONOMIC FORECASTING REVIEW - Parsons Brinckerhoff
ECONOMIC FORECASTING REVIEW - Parsons Brinckerhoff

Create successful ePaper yourself
Turn your PDF publications into a flip-book with our unique Google optimized e-Paper software.
Vol. 3 • Issue 2<br />
Construction Economic Review & Highway Cost Escalation Forecast<br />
Machinery and Equipment – U.S. is a net exporter of<br />
construction machinery and equipment. Equipment costs<br />
have remained relatively stable over last few years. Decrease<br />
in global demand and weak dollar are two factors that are<br />
expected to affect the cost of equipment in the near future.<br />
Given that these two are countervailing forces, we expect<br />
equipment costs to remain stable over the next few years.<br />
Steel – after the steep run up in 2008 and market correction<br />
thereafter, the cost of steel has slightly rebounded in the most<br />
recent BLS Producer Price Index (PPI) data, a 5.7 percent<br />
increase from 2009 Q2 to 2009 Q3. We expect steel prices to<br />
moderately increase in the next few years.<br />
Asphalt – asphalt prices are closely correlated with crude<br />
oil and refined petroleum prices, but there can be a lag in<br />
the effect. As forecasted by Moody’s Economy.com, crude oil<br />
prices are expected to spike up in 2010, which may result in<br />
an increase in asphalt prices in 2011. Recent BLS PPI shows a<br />
six percent increase from 2009 Q2 to 2009 Q3.<br />
Aggregate – aggregate is a highly localized commodity, and<br />
as such prices would vary from region to region. Relative<br />
to other commodities, aggregates have withstood the<br />
downward price pressures of the recession. Recent BLS PPI<br />
data shows a 0.3 percent decrease from 2009 Q2 to 2009 Q3.<br />
We anticipate aggregate prices to remain flat for the next few<br />
years.<br />
Ready Mix Concrete – concrete prices, relative to other<br />
commodities have withstood the downward price pressures<br />
of the recession. In fact, BLS’s PPI recently showed a price<br />
decrease of one percent in 2009 Q3 from 2009 Q2. Over the<br />
next few years, we anticipate a moderate increase in concrete<br />
prices primarily because of increases in global demand and<br />
increased transportation costs (concrete prices are closely tied<br />
to transportation costs and energy costs in general).<br />
Market factors affecting construction costs<br />
Stimulus funding<br />
The previously anticipated inflationary impacts from<br />
stimulus funding are not being fully felt in 2009. This is<br />
driven by two key factors.<br />
First, only a small percentage of stimulus funds have<br />
actually been spent. Currently, only $5.29 billion of the $30.28<br />
billion available to the Department of Transportation have<br />
been paid out. 1 While the Department of Transportation<br />
spending is not the only infrastructure spending in the<br />
American Recovery and Reinvestment Act of 2009 (ARRA),<br />
it represents approximately 80 percent of all transportation<br />
and infrastructure spending. 2 Given that there is at least<br />
some anticipated lag in stimulus effects on the economy from<br />
government spending, it is consistent that there would be no<br />
clear impact in 2009.<br />
It is anticipated that stimulus spending on transportation<br />
projects will continue through 2019, with approximately<br />
20 percent of total stimulus spending in FY 2010 and<br />
approximately 75 percent of all spending completed by the<br />
end of FY 2013. 3<br />
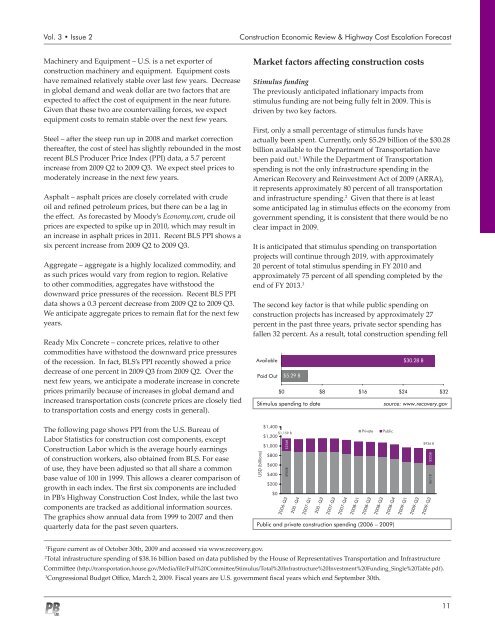
The second key factor is that while public spending on<br />
construction projects has increased by approximately 27<br />
percent in the past three years, private sector spending has<br />
fallen 32 percent. As a result, total construction spending fell<br />
Available<br />
Paid Out<br />
$5.29 B<br />
$30.28 B<br />
$0 $8 $16 $24 $32<br />
Stimulus spending to date<br />
source: www.recovery.gov<br />
The following page shows PPI from the U.S. Bureau of<br />
Labor Statistics for construction cost components, except<br />
Construction Labor which is the average hourly earnings<br />
of construction workers, also obtained from BLS. For ease<br />
of use, they have been adjusted so that all share a common<br />
base value of 100 in 1999. This allows a clearer comparison of<br />
growth in each index. The first six components are included<br />
in PB’s Highway Construction Cost Index, while the last two<br />
components are tracked as additional information sources.<br />
The graphics show annual data from 1999 to 2007 and then<br />
quarterly data for the past seven quarters.<br />
USD (billions)<br />
$1,400<br />
Private Public<br />
$1,159 B<br />
$1,200<br />
$1,000<br />
$800<br />
$600<br />
$400<br />
$200<br />
$0<br />
$903B<br />
$256B<br />
2006-Q3<br />
200 -Q4<br />
2007-Q1<br />
200 -Q2<br />
2007-Q3<br />
2007-Q4<br />
2008-Q1<br />
2008-Q2<br />
2008-Q3<br />
Public and private construction spending (2006 – 2009)<br />
2008-Q4<br />
2009-Q1<br />
2009-Q2<br />
$936 B<br />
$611B $325B<br />
2009-Q3<br />
1<br />
Figure current as of October 30th, 2009 and accessed via www.recovery.gov.<br />
2<br />
Total infrastructure spending of $38.16 billion based on data published by the House of Representatives Transportation and Infrastructure<br />
Committee (http://transportation.house.gov/Media/file/Full%20Committee/Stimulus/Total%20Infrastructure%20Investment%20Funding_Single%20Table.pdf).<br />
3<br />
Congressional Budget Office, March 2, 2009. Fiscal years are U.S. government fiscal years which end September 30th.<br />
11