

Attachment tables only (PDF - 395 Kb)
Attachment tables only (PDF - 395 Kb)
Attachment tables only (PDF - 395 Kb)

Create successful ePaper yourself
Turn your PDF publications into a flip-book with our unique Google optimized e-Paper software.
Table 12A.2<br />
Table 12A.2<br />
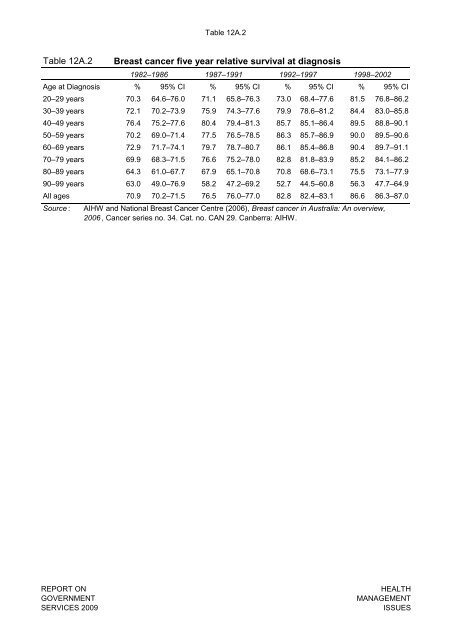
Breast cancer five year relative survival at diagnosis<br />
1982–1986 1987–1991 1992–1997 1998–2002<br />
Age at Diagnosis % 95% CI % 95% CI % 95% CI % 95% CI<br />
20–29 years 70.3 64.6–76.0 71.1 65.8–76.3 73.0 68.4–77.6 81.5 76.8–86.2<br />
30–39 years 72.1 70.2–73.9 75.9 74.3–77.6 79.9 78.6–81.2 84.4 83.0–85.8<br />
40–49 years 76.4 75.2–77.6 80.4 79.4–81.3 85.7 85.1–86.4 89.5 88.8–90.1<br />
50–59 years 70.2 69.0–71.4 77.5 76.5–78.5 86.3 85.7–86.9 90.0 89.5–90.6<br />
60–69 years 72.9 71.7–74.1 79.7 78.7–80.7 86.1 85.4–86.8 90.4 89.7–91.1<br />
70–79 years 69.9 68.3–71.5 76.6 75.2–78.0 82.8 81.8–83.9 85.2 84.1–86.2<br />
80–89 years 64.3 61.0–67.7 67.9 65.1–70.8 70.8 68.6–73.1 75.5 73.1–77.9<br />
90–99 years 63.0 49.0–76.9 58.2 47.2–69.2 52.7 44.5–60.8 56.3 47.7–64.9<br />
All ages 70.9 70.2–71.5 76.5 76.0–77.0 82.8 82.4–83.1 86.6 86.3–87.0<br />
Source : AIHW and National Breast Cancer Centre (2006), Breast cancer in Australia: An overview,<br />
2006 , Cancer series no. 34. Cat. no. CAN 29. Canberra: AIHW.<br />
REPORT ON<br />
GOVERNMENT<br />
SERVICES 2009<br />
HEALTH<br />
MANAGEMENT<br />
ISSUES


