Attachment tables only (PDF - 395 Kb)
Attachment tables only (PDF - 395 Kb)
Attachment tables only (PDF - 395 Kb)
Create successful ePaper yourself
Turn your PDF publications into a flip-book with our unique Google optimized e-Paper software.
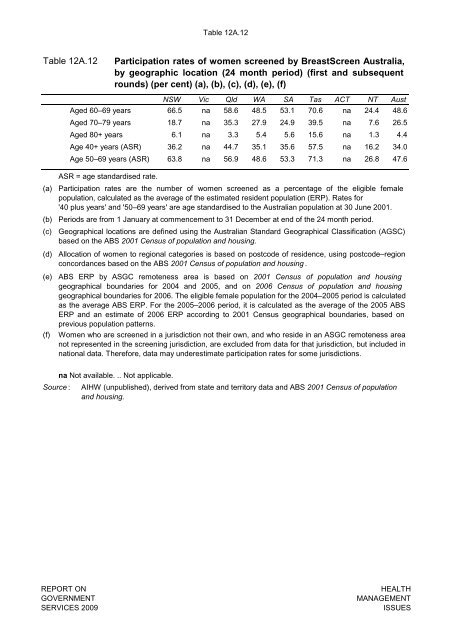
Table 12A.12<br />
Table 12A.12<br />
Participation rates of women screened by BreastScreen Australia,<br />
by geographic location (24 month period) (first and subsequent<br />
rounds) (per cent) (a), (b), (c), (d), (e), (f)<br />
NSW Vic Qld WA SA Tas ACT NT Aust<br />
Aged 60–69 years 66.5 na 58.6 48.5 53.1 70.6 na 24.4 48.6<br />
Aged 70–79 years 18.7 na 35.3 27.9 24.9 39.5 na 7.6 26.5<br />
Aged 80+ years 6.1 na 3.3 5.4 5.6 15.6 na 1.3 4.4<br />
Age 40+ years (ASR) 36.2 na 44.7 35.1 35.6 57.5 na 16.2 34.0<br />
Age 50–69 years (ASR) 63.8 na 56.9 48.6 53.3 71.3 na 26.8 47.6<br />
ASR = age standardised rate.<br />
(a)<br />
(b)<br />
(c)<br />
(d)<br />
(e)<br />
(f)<br />
Participation rates are the number of women screened as a percentage of the eligible female<br />
population, calculated as the average of the estimated resident population (ERP). Rates for<br />
'40 plus years' and '50–69 years' are age standardised to the Australian population at 30 June 2001.<br />
Periods are from 1 January at commencement to 31 December at end of the 24 month period.<br />
Geographical locations are defined using the Australian Standard Geographical Classification (AGSC)<br />
based on the ABS 2001 Census of population and housing.<br />
Allocation of women to regional categories is based on postcode of residence, using postcode–region<br />
concordances based on the ABS 2001 Census of population and housing .<br />
ABS ERP by ASGC remoteness area is based on 2001 Census of population and housing<br />
geographical boundaries for 2004 and 2005, and on 2006 Census of population and housing<br />
geographical boundaries for 2006. The eligible female population for the 2004–2005 period is calculated<br />
as the average ABS ERP. For the 2005–2006 period, it is calculated as the average of the 2005 ABS<br />
ERP and an estimate of 2006 ERP according to 2001 Census geographical boundaries, based on<br />
previous population patterns.<br />
Women who are screened in a jurisdiction not their own, and who reside in an ASGC remoteness area<br />
not represented in the screening jurisdiction, are excluded from data for that jurisdiction, but included in<br />
national data. Therefore, data may underestimate participation rates for some jurisdictions.<br />
na Not available. .. Not applicable.<br />
Source : AIHW (unpublished), derived from state and territory data and ABS 2001 Census of population<br />
and housing.<br />
REPORT ON<br />
GOVERNMENT<br />
SERVICES 2009<br />
HEALTH<br />
MANAGEMENT<br />
ISSUES


