

Attachment tables only (PDF - 395 Kb)
Attachment tables only (PDF - 395 Kb)
Attachment tables only (PDF - 395 Kb)

Create successful ePaper yourself
Turn your PDF publications into a flip-book with our unique Google optimized e-Paper software.
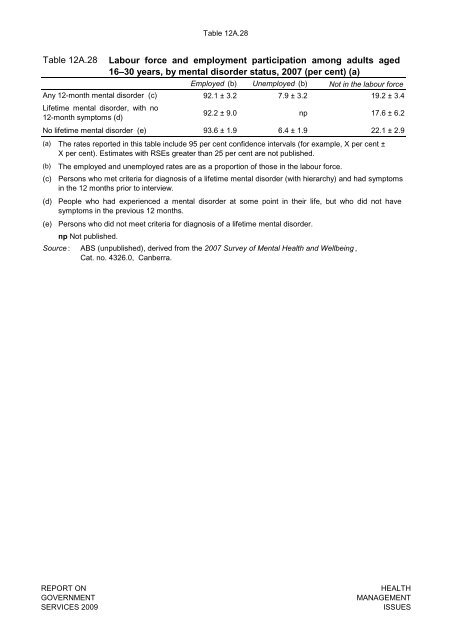
Table 12A.28<br />
Table 12A.28<br />
Labour force and employment participation among adults aged<br />
16–30 years, by mental disorder status, 2007 (per cent) (a)<br />
Employed (b) Unemployed (b) Not in the labour force<br />
Any 12-month mental disorder (c)<br />
92.1 ± 3.2 7.9 ± 3.2 19.2 ± 3.4<br />
Lifetime mental disorder, with no<br />
12-month symptoms (d)<br />
92.2 ± 9.0 np 17.6 ± 6.2<br />
No lifetime mental disorder (e) 93.6 ± 1.9 6.4 ± 1.9 22.1 ± 2.9<br />
(a)<br />
(b)<br />
(c)<br />
(d)<br />
The rates reported in this table include 95 per cent confidence intervals (for example, X per cent ±<br />
X per cent). Estimates with RSEs greater than 25 per cent are not published.<br />
The employed and unemployed rates are as a proportion of those in the labour force.<br />
Persons who met criteria for diagnosis of a lifetime mental disorder (with hierarchy) and had symptoms<br />
in the 12 months prior to interview.<br />
People who had experienced a mental disorder at some point in their life, but who did not have<br />
symptoms in the previous 12 months.<br />
(e) Persons who did not meet criteria for diagnosis of a lifetime mental disorder.<br />
np Not published.<br />
Source : ABS (unpublished), derived from the 2007 Survey of Mental Health and Wellbeing ,<br />
Cat. no. 4326.0, Canberra.<br />
REPORT ON<br />
GOVERNMENT<br />
SERVICES 2009<br />
HEALTH<br />
MANAGEMENT<br />
ISSUES


