

Attachment tables only (PDF - 395 Kb)
Attachment tables only (PDF - 395 Kb)
Attachment tables only (PDF - 395 Kb)

Create successful ePaper yourself
Turn your PDF publications into a flip-book with our unique Google optimized e-Paper software.
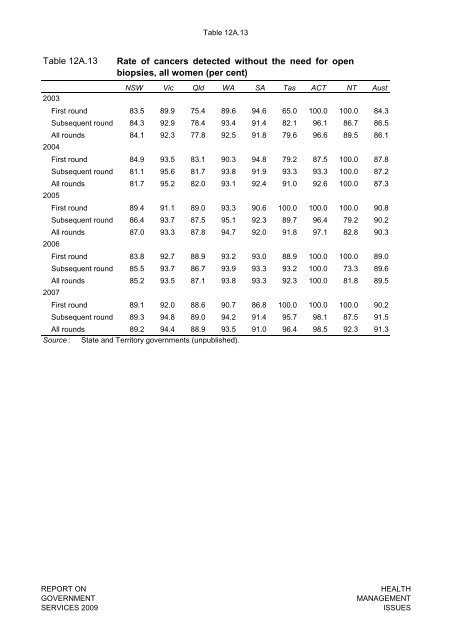
Table 12A.13<br />
Table 12A.13<br />
2003<br />
NSW Vic Qld WA SA Tas ACT NT Aust<br />
First round 83.5 89.9 75.4 89.6 94.6 65.0 100.0 100.0 84.3<br />
Subsequent round 84.3 92.9 78.4 93.4 91.4 82.1 96.1 86.7 86.5<br />
All rounds 84.1 92.3 77.8 92.5 91.8 79.6 96.6 89.5 86.1<br />
2004<br />
First round 84.9 93.5 83.1 90.3 94.8 79.2 87.5 100.0 87.8<br />
Subsequent round 81.1 95.6 81.7 93.8 91.9 93.3 93.3 100.0 87.2<br />
All rounds 81.7 95.2 82.0 93.1 92.4 91.0 92.6 100.0 87.3<br />
2005<br />
First round 89.4 91.1 89.0 93.3 90.6 100.0 100.0 100.0 90.8<br />
Subsequent round 86.4 93.7 87.5 95.1 92.3 89.7 96.4 79.2 90.2<br />
All rounds 87.0 93.3 87.8 94.7 92.0 91.8 97.1 82.8 90.3<br />
2006<br />
First round 83.8 92.7 88.9 93.2 93.0 88.9 100.0 100.0 89.0<br />
Subsequent round 85.5 93.7 86.7 93.9 93.3 93.2 100.0 73.3 89.6<br />
All rounds 85.2 93.5 87.1 93.8 93.3 92.3 100.0 81.8 89.5<br />
2007<br />
Rate of cancers detected without the need for open<br />
biopsies, all women (per cent)<br />
First round 89.1 92.0 88.6 90.7 86.8 100.0 100.0 100.0 90.2<br />
Subsequent round 89.3 94.8 89.0 94.2 91.4 95.7 98.1 87.5 91.5<br />
All rounds 89.2 94.4 88.9 93.5 91.0 96.4 98.5 92.3 91.3<br />
Source : State and Territory governments (unpublished).<br />
REPORT ON<br />
GOVERNMENT<br />
SERVICES 2009<br />
HEALTH<br />
MANAGEMENT<br />
ISSUES


