Ecological Footprint - Region of Peel
Ecological Footprint - Region of Peel
Ecological Footprint - Region of Peel

Create successful ePaper yourself
Turn your PDF publications into a flip-book with our unique Google optimized e-Paper software.
<strong>Ecological</strong> <strong>Footprint</strong><br />
<strong>Peel</strong> Data Centre<br />
What is it?<br />
An ecological footprint (EF) is a measure <strong>of</strong> the demands that<br />
people place on nature. More specifically, the EF measures<br />
how much biologically productive land and water area is<br />
required to produce all the resources a given population<br />
consumes and absorb the waste that is produced. By looking<br />
at human consumption and comparing it to nature's<br />
productivity, the EF provides a means <strong>of</strong> estimating the impact<br />
individuals, organizations, cities, regions or nations have on<br />
nature.<br />
The EF <strong>of</strong> any individual, household or population considers all<br />
<strong>of</strong> the land and water that is used for crops, roads, grazing,<br />
fishing, buildings and for producing wood products, and<br />
organizes this information into six separate components<br />
(Energy Land, Crop Land, Pasture Land, Forest Land, Sea<br />
Space, and Built Area) to calculate a total ecological footprint<br />
for an individual or community.<br />
Why is it important to you?<br />
Everyday, everyone has an impact on the earth. While this is<br />
not necessarily a bad thing, the size <strong>of</strong> the impact we have can<br />
quickly lead to an unsustainable balance between our<br />
demands on nature and its ability to supply us with the things<br />
we need to live.<br />
The Federation <strong>of</strong> Canadian Municipalities (FCM) in their 2003<br />
report on the <strong>Ecological</strong> <strong>Footprint</strong>s <strong>of</strong> Canadian Municipalities<br />
and <strong>Region</strong>s refers to ecological footprint analysis (EFA) as an<br />
accounting tool and reporting system for measuring progress<br />
towards sustainability.<br />
At the municipal or regional level, EFA is suggested as one <strong>of</strong><br />
several performance indicators for measuring community<br />
sustainability.<br />
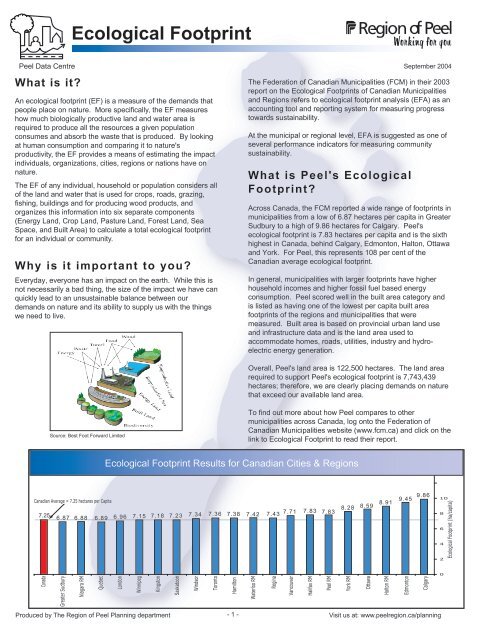
What is <strong>Peel</strong>'s <strong>Ecological</strong><br />
<strong>Footprint</strong>?<br />
September 2004<br />
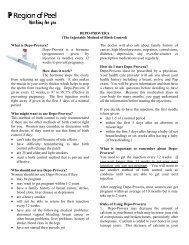
Across Canada, the FCM reported a wide range <strong>of</strong> footprints in<br />
municipalities from a low <strong>of</strong> 6.87 hectares per capita in Greater<br />
Sudbury to a high <strong>of</strong> 9.86 hectares for Calgary. <strong>Peel</strong>'s<br />
ecological footprint is 7.83 hectares per capita and is the sixth<br />
highest in Canada, behind Calgary, Edmonton, Halton, Ottawa<br />
and York. For <strong>Peel</strong>, this represents 108 per cent <strong>of</strong> the<br />
Canadian average ecological footprint.<br />
In general, municipalities with larger footprints have higher<br />
household incomes and higher fossil fuel based energy<br />
consumption. <strong>Peel</strong> scored well in the built area category and<br />
is listed as having one <strong>of</strong> the lowest per capita built area<br />
footprints <strong>of</strong> the regions and municipalities that were<br />
measured. Built area is based on provincial urban land use<br />
and infrastructure data and is the land area used to<br />
accommodate homes, roads, utilities, industry and hydroelectric<br />
energy generation.<br />
Overall, <strong>Peel</strong>'s land area is 122,500 hectares. The land area<br />
required to support <strong>Peel</strong>'s ecological footprint is 7,743,439<br />
hectares; therefore, we are clearly placing demands on nature<br />
that exceed our available land area.<br />
Source: Best Foot Forward Limited<br />
To find out more about how <strong>Peel</strong> compares to other<br />
municipalities across Canada, log onto the Federation <strong>of</strong><br />
Canadian Municipalities website (www.fcm.ca) and click on the<br />
link to <strong>Ecological</strong> <strong>Footprint</strong> to read their report.<br />
<strong>Ecological</strong> <strong>Footprint</strong> Results for Canadian Cities & <strong>Region</strong>s<br />
14<br />
12<br />
Canadian Average = 7.25 hectares per Capita<br />
7.25<br />
6.87 6.88 6.89 6.96 7.15 7.18 7.23 7.34 7.36 7.38 7.42 7.43<br />
7.71 7.83<br />
7.83<br />
8.28<br />
8.59 8.91 9.45 9.86<br />
10<br />
8<br />
6<br />
4<br />
2<br />
<strong>Ecological</strong> <strong>Footprint</strong> (ha/capita)<br />
0<br />
Produced by The <strong>Region</strong> <strong>of</strong> <strong>Peel</strong> Planning department<br />
- 1 - Visit us at: www.peelregion.ca/planning
<strong>Ecological</strong> <strong>Footprint</strong><br />
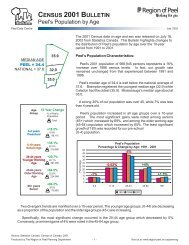
The Average <strong>Peel</strong> Resident's<br />
<strong>Ecological</strong> <strong>Footprint</strong> by<br />
Land/Area Category (%)<br />
This diagram illustrates the average ecological footprint or total<br />
land and water area that is required to support a resident <strong>of</strong><br />
<strong>Peel</strong> <strong>Region</strong> by land and water category.<br />
Pasture Land<br />
3%<br />
Built Land<br />
4%<br />
Sea Space<br />
2%<br />
CD: Census Division<br />
CMA: Census Metropolitian<br />
Area<br />
ECOLOGICAL FOOTPRINTS<br />
Comparing <strong>Footprint</strong>s in the Greater Toronto Area<br />
Canada<br />
Toronto (CMA)<br />
York <strong>Region</strong>al<br />
Municipality<br />
(CD)<br />
<strong>Peel</strong> <strong>Region</strong>al<br />
Municipality<br />
(CD)<br />
September 2004<br />
Halton<br />
<strong>Region</strong>al<br />
Municipality<br />
(CD)<br />
Hamilton<br />
(CMA)<br />
Energy Land 4.00 4.05 4.56 4.23 5.03 4.03<br />
Crop Land 1.39 1.48 1.70 1.70 1.70 1.50<br />
Pasture Land 0.21 0.22 0.25 0.25 0.25 0.23<br />
Sea Space 0.15 0.15 0.18 0.18 0.18 0.22<br />
Forest Land 1.14 1.14 1.27 1.16 1.43 1.09<br />
Built Area 0.36 0.31 0.32 0.31 0.32 0.31<br />
Forest Land<br />
17%<br />
Total <strong>Ecological</strong><br />
<strong>Footprint</strong> (hectares per<br />
capita)<br />
7.25 7.35 8.28 7.83 8.91 7.37<br />
Crop Land<br />
21%<br />
Comparing the <strong>Ecological</strong><br />
<strong>Footprint</strong> Internationally<br />
How Does Canada Compare? The FCM report found that the<br />
average Canadian has the third largest ecological footprint in<br />
the world, behind the United States and the United Arab<br />
Emirates. Current analysis shows that on average the<br />
Canadian ecological footprint is 7.25 hectares. This indicates<br />
that it takes 7.25 hectares <strong>of</strong> land and sea throughout the<br />
world to support each Canadian.<br />
Internationally, ecological footprints in many other countries<br />
are much lower than Canada's as indicated by the following<br />
examples:<br />
• India - 0.86 hectares/person<br />
• Pakistan - 0.64 hectares/person<br />
• Japan - 4.77 hectares/person<br />
Source: WWF Living Planet Report 2002<br />
Energy Land<br />
53%<br />
INFORMATION NEEDED TO CALCULATE AN ECOLGICAL FOOTPRINT<br />
HOUSEHOLD OR<br />
INDIVIDUAL<br />
FOOTPRINT<br />
CITY, TOWN<br />
OR REGION<br />
FOOTPRINT<br />
What can I do to change my<br />
community's and my personal<br />
footprint?<br />
While it may not be possible to affect all <strong>of</strong> the variables that<br />
produce your community's ecological footprint, you can<br />
personally take action in several ways to reduce your<br />
individual ecological footprint.<br />
If enough individual action is taken we can expect to observe<br />
improvements in the <strong>Region</strong>'s ecological footprint over time.<br />
You may wish to try some <strong>of</strong> the following actions in these<br />
areas:<br />
Food:<br />
• Buy more locally grown and organic food<br />
• Buy more unpackaged and unprocessed foods<br />
• Eat vegetarian meals more frequently<br />
Mobility:<br />
• Drive your car less and carpool whenever possible<br />
• If you drive, choose a more fuel efficient vehicle<br />
• Use public transit, bike or walk whenever possible<br />
Housing:<br />
• Hang clothes to dry - limit the number <strong>of</strong> loads <strong>of</strong> laundry<br />
_ that go in your dryer<br />
• Reduce the number <strong>of</strong> days you use the air conditioner<br />
Practice water and energy conservation<br />
• Turn <strong>of</strong>f lights and use energy efficient bulbs and appliances<br />
» Amount and type <strong>of</strong> food consumed<br />
» Amount and type <strong>of</strong> electricity used<br />
» Size <strong>of</strong> house or apartment<br />
» Gasoline use<br />
» Population density<br />
» Average household size<br />
» Consumer spending<br />
» Energy use<br />
Try these simple suggestions and see how much you can<br />
reduce your ecological footprint.<br />
» Fuel efficiency<br />
» Miles travelled by vehicle, transit, bike<br />
and foot<br />
» Urban land use<br />
Produced by The <strong>Region</strong> <strong>of</strong> <strong>Peel</strong> Planning department<br />
- 2 -<br />
Note: All Charts and Graphs are reproduced from the <strong>Ecological</strong> <strong>Footprint</strong>s <strong>of</strong><br />
Canadian Municipalities and <strong>Region</strong>s report prepared by Anielski<br />
Management Inc. for the Federation <strong>of</strong> Canadian Municipalities.<br />
Visit us at: www.peelregion.ca/planning