Overview of Capital Account Crisis - IMF
Overview of Capital Account Crisis - IMF
Overview of Capital Account Crisis - IMF

Create successful ePaper yourself
Turn your PDF publications into a flip-book with our unique Google optimized e-Paper software.
- 2 -<br />
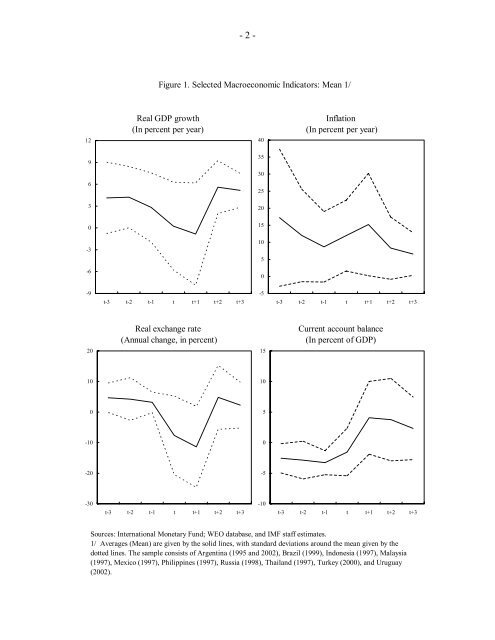
Figure 1. Selected Macroeconomic Indicators: Mean 1/<br />
12<br />
Real GDP growth<br />
(In percent per year)<br />
40<br />
Inflation<br />
(In percent per year)<br />
9<br />
35<br />
30<br />
6<br />
25<br />
3<br />
20<br />
0<br />
15<br />
-3<br />
10<br />
5<br />
-6<br />
0<br />
-9<br />
t-3 t-2 t-1 t t+1 t+2 t+3<br />
-5<br />
t-3 t-2 t-1 t t+1 t+2 t+3<br />
20<br />
Real exchange rate<br />
(Annual change, in percent)<br />
15<br />
Current account balance<br />
(In percent <strong>of</strong> GDP)<br />
10<br />
10<br />
0<br />
5<br />
-10<br />
0<br />
-20<br />
-5<br />
-30<br />
t-3 t-2 t-1 t t+1 t+2 t+3<br />
-10<br />
t-3 t-2 t-1 t t+1 t+2 t+3<br />
Sources: International Monetary Fund; WEO database, and <strong>IMF</strong> staff estimates.<br />
1/ Averages (Mean) are given by the solid lines, with standard deviations around the mean given by the<br />
dotted lines. The sample consists <strong>of</strong> Argentina (1995 and 2002), Brazil (1999), Indonesia (1997), Malaysia<br />
(1997), Mexico (1997), Philippines (1997), Russia (1998), Thailand (1997), Turkey (2000), and Uruguay<br />
(2002).