Overview of Capital Account Crisis - IMF
Overview of Capital Account Crisis - IMF
Overview of Capital Account Crisis - IMF

Create successful ePaper yourself
Turn your PDF publications into a flip-book with our unique Google optimized e-Paper software.
- 20 -<br />
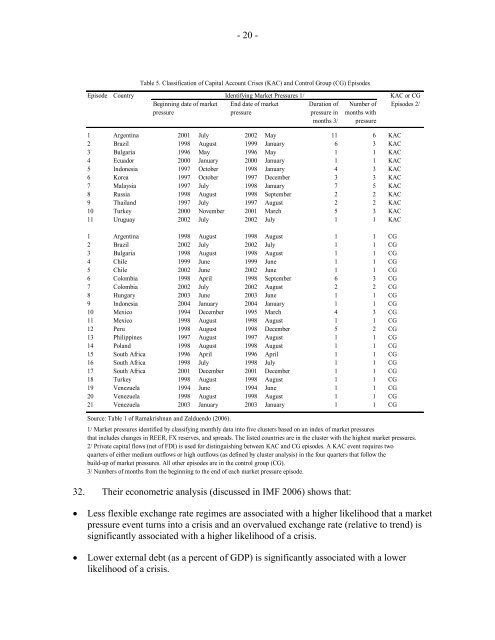
Table 5. Classification <strong>of</strong> <strong>Capital</strong> <strong>Account</strong> Crises (KAC) and Control Group (CG) Episodes<br />
Episode<br />
Country<br />
Beginning date <strong>of</strong> market<br />
pressure<br />
Identifying Market Pressures 1/<br />
End date <strong>of</strong> market<br />
pressure<br />
Duration <strong>of</strong><br />
pressure in<br />
months 3/<br />
Number <strong>of</strong><br />
months with<br />
pressure<br />
KAC or CG<br />
Episodes 2/<br />
1 Argentina 2001 July 2002 May 11 6 KAC<br />
2 Brazil 1998 August 1999 January 6 3 KAC<br />
3 Bulgaria 1996 May 1996 May 1 1 KAC<br />
4 Ecuador 2000 January 2000 January 1 1 KAC<br />
5 Indonesia 1997 October 1998 January 4 3 KAC<br />
6 Korea 1997 October 1997 December 3 3 KAC<br />
7 Malaysia 1997 July 1998 January 7 5 KAC<br />
8 Russia 1998 August 1998 September 2 2 KAC<br />
9 Thailand 1997 July 1997 August 2 2 KAC<br />
10 Turkey 2000 November 2001 March 5 3 KAC<br />
11 Uruguay 2002 July 2002 July 1 1 KAC<br />
1 Argentina 1998 August 1998 August 1 1 CG<br />
2 Brazil 2002 July 2002 July 1 1 CG<br />
3 Bulgaria 1998 August 1998 August 1 1 CG<br />
4 Chile 1999 June 1999 June 1 1 CG<br />
5 Chile 2002 June 2002 June 1 1 CG<br />
6 Colombia 1998 April 1998 September 6 3 CG<br />
7 Colombia 2002 July 2002 August 2 2 CG<br />
8 Hungary 2003 June 2003 June 1 1 CG<br />
9 Indonesia 2004 January 2004 January 1 1 CG<br />
10 Mexico 1994 December 1995 March 4 3 CG<br />
11 Mexico 1998 August 1998 August 1 1 CG<br />
12 Peru 1998 August 1998 December 5 2 CG<br />
13 Philippines 1997 August 1997 August 1 1 CG<br />
14 Poland 1998 August 1998 August 1 1 CG<br />
15 South Africa 1996 April 1996 April 1 1 CG<br />
16 South Africa 1998 July 1998 July 1 1 CG<br />
17 South Africa 2001 December 2001 December 1 1 CG<br />
18 Turkey 1998 August 1998 August 1 1 CG<br />
19 Venezuela 1994 June 1994 June 1 1 CG<br />
20 Venezuela 1998 August 1998 August 1 1 CG<br />
21 Venezuela 2003 January 2003 January 1 1 CG<br />
Source: Table 1 <strong>of</strong> Ramakrishnan and Zalduendo (2006).<br />
1/ Market pressures identified by classifying monthly data into five clusters based on an index <strong>of</strong> market pressures<br />
that includes changes in REER, FX reserves, and spreads. The listed countries are in the cluster with the highest market pressures.<br />
2/ Private capital flows (net <strong>of</strong> FDI) is used for distinguishing between KAC and CG episodes. A KAC event requires two<br />
quarters <strong>of</strong> either medium outflows or high outflows (as defined by cluster analysis) in the four quarters that follow the<br />
build-up <strong>of</strong> market pressures. All other episodes are in the control group (CG).<br />
3/ Numbers <strong>of</strong> months from the beginning to the end <strong>of</strong> each market pressure episode.<br />
32. Their econometric analysis (discussed in <strong>IMF</strong> 2006) shows that:<br />
• Less flexible exchange rate regimes are associated with a higher likelihood that a market<br />
pressure event turns into a crisis and an overvalued exchange rate (relative to trend) is<br />
significantly associated with a higher likelihood <strong>of</strong> a crisis.<br />
• Lower external debt (as a percent <strong>of</strong> GDP) is significantly associated with a lower<br />
likelihood <strong>of</strong> a crisis.