Proof of Evidence - Traffic Appendices
Proof of Evidence - Traffic Appendices
Proof of Evidence - Traffic Appendices

Create successful ePaper yourself
Turn your PDF publications into a flip-book with our unique Google optimized e-Paper software.
INQUIRY DOCUMENT No. SD2/3/3<br />
A46 Newark to Widmerpool<br />
Improvement<br />
Supplementary Orders<br />
<strong>Pro<strong>of</strong></strong> <strong>of</strong> <strong>Evidence</strong><br />
<strong>Traffic</strong> <strong>Appendices</strong><br />
by<br />
David Elliott BSc (Hons), CMILT, MCIHT<br />
October 2011<br />
Highways Agency<br />
Balfour Beatty<br />
The Cube<br />
86 Station Road<br />
199 Wharfside Street Redhill<br />
Birmingham<br />
Surrey<br />
B1 1RN<br />
RH1 1PQ<br />
Jacobs<br />
Friars House<br />
Manor House Drive<br />
Coventry<br />
CV1 2TE<br />
URS Scott Wilson Ltd<br />
Royal Court<br />
Basil Close<br />
Chesterfield<br />
Derbyshire<br />
S41 7SL
A46 Newark to Widmerpool Improvement – Supplementary Orders<br />
<strong>Traffic</strong> <strong>Evidence</strong> <strong>Appendices</strong>: October 2011<br />
TABLE OF CONTENTS<br />
APPENDICES<br />
Appendix A:<br />
Glossary <strong>of</strong> Terms and Abbreviations<br />
Appendix B: Comparison <strong>of</strong> <strong>Traffic</strong> Model Forecasts with the 2009<br />
Observed Flows at Farndon Roundabout<br />
Appendix C:<br />
Appendix D:<br />
Appendix E:<br />
Appendix F:<br />
Appendix G:<br />
Appendix H:<br />
Appendix I:<br />
Comparison <strong>of</strong> Planning Data from NTEM v5.3 With NTEM<br />
v6.2<br />
Transport Economics Tables for the Scheme<br />
Design Reference Flows for Farndon Roundabout<br />
Sites Served by the Access<br />
Trip Observations for Access<br />
Forecast Year Operation Analysis <strong>of</strong> Existing Access onto<br />
B6166<br />
Operation Analysis <strong>of</strong> Farndon Roundabout<br />
David Elliott 1<br />
A46NWI 2011PI <strong>Traffic</strong> <strong>Appendices</strong> v6.doc
A46 Newark to Widmerpool Improvement – Supplementary Orders<br />
<strong>Traffic</strong> <strong>Evidence</strong> <strong>Appendices</strong>: October 2011<br />
David Elliott 2<br />
A46NWI 2011PI <strong>Traffic</strong> <strong>Appendices</strong> v6.doc
A46 Newark to Widmerpool Improvement – Supplementary Orders<br />
<strong>Traffic</strong> <strong>Evidence</strong> <strong>Appendices</strong>: October 2011<br />
APPENDIX A:<br />
GLOSSARY OF TERMS AND ABBREVIATIONS<br />
Abbreviation Description<br />
AADT Annual Average Daily <strong>Traffic</strong> Flow: the total flow <strong>of</strong> traffic per year divided by 365<br />
AAWT<br />
AIL<br />
AMCB<br />
ARCADY<br />
Assignment<br />
AST<br />
ATC<br />
BCR<br />
Capacity<br />
Cars<br />
Casualty<br />
COBA<br />
Committed<br />
Convergence<br />
CRF<br />
Destination<br />
DfT<br />
DIADEM<br />
Annual Average Weekday <strong>Traffic</strong>: the average traffic on a weekday<br />
(Monday-Friday)<br />
Abnormal Indivisible Load<br />
Analysis <strong>of</strong> Monetised Costs and Benefits: A table summarising a<br />
scheme’s monetary evaluation<br />
Computer programme for the design <strong>of</strong> roundabouts<br />
The process where SATURN routes the traffic stored in the matrices along<br />
the stored network <strong>of</strong> roads and junctions. It examines the cost <strong>of</strong> each<br />
potential route from one zone to another, and directs traffic along these<br />
routes, resulting in total flows along each link and through each junction.<br />
Appraisal Summary Table: A table that summarises the assessment <strong>of</strong> a<br />
scheme against the Government’s objectives for transport. The table is<br />
intended to be presented in a concise format and thereby facilitate<br />
comparisons between alternatives.<br />
Automatic <strong>Traffic</strong> Count<br />
Benefit to Cost Ratio: Used as a measure <strong>of</strong> the value for money <strong>of</strong> a<br />
scheme, this is the Present Value <strong>of</strong> Benefits (PVB) divided by the Present<br />
Value <strong>of</strong> Costs (PVC)<br />
The maximum number <strong>of</strong> vehicles able to go through a junction or along<br />
a road given the traffic conditions<br />
Passenger vehicles with a gross vehicle weight <strong>of</strong> less than 3.5 tonnes.<br />
Such vehicles can normally accommodate not more than 15 seats.<br />
A person injured in a PIA (there may be more than one casualty in a PIA)<br />
The DoT's Cost Benefit Analysis programme to determine economic<br />
viability <strong>of</strong> road schemes.<br />
A development or road scheme which is contained within the Local Plan<br />
or the TPI, and can therefore be assumed to go ahead within the<br />
foreseeable future. This implies a degree <strong>of</strong> political and financial<br />
commitment<br />
A measure <strong>of</strong> how well the route choice decisions within the model are<br />
settling down to an stable set <strong>of</strong> traffic flows<br />
Congestion Reference Flow, the maximum sustainable daily throughput <strong>of</strong><br />
a road as defined by TA46/97 Annex D.<br />
The end point <strong>of</strong> a trip<br />
Department for Transport<br />
Dynamic Integrated Assignment and Demand Modelling – a computer<br />
program designed to enable variable-demand modelling consistent with<br />
the advice in WebTAG<br />
David Elliott 3<br />
A46NWI 2011PI <strong>Traffic</strong> <strong>Appendices</strong> v6.doc
A46 Newark to Widmerpool Improvement – Supplementary Orders<br />
<strong>Traffic</strong> <strong>Evidence</strong> <strong>Appendices</strong>: October 2011<br />
Abbreviation Description<br />
DM<br />
DMRB<br />
DOS<br />
DS<br />
ECI<br />
EMM1TAM<br />
GDP<br />
GO<br />
HA<br />
HATRIS<br />
HGV<br />
INCA<br />
Iteration<br />
ITR<br />
Link<br />
LGV<br />
LMVR<br />
Do Minimum: in forecasting scenarios this means the road schemes which<br />
are already included in the Local Plan or TPI and would be undertaken<br />
regardless, but which are not part <strong>of</strong> the scheme being tested.<br />
The Design Manual for Roads and Bridges is a technical document for<br />
road designers<br />
Degree <strong>of</strong> Saturation at a traffic-signalled junction<br />
Do Something: a forecasting scenario which includes the road scheme<br />
being tested, as well as any other schemes which are already included in<br />
the Local Plan or TPI and would be undertaken regardless.<br />
Early Contractor Initiative: a scheme where the contractor is involved at<br />
an early stage <strong>of</strong> the design and takes on the design and financial risk<br />
involved.<br />
East Midlands M1 <strong>Traffic</strong> Appraisal Model – The traffic model built to<br />
forecast the traffic flows associated with the M1 widening scheme.<br />
Gross Domestic Product<br />
Government Office – The Government Office works in coordination to<br />
deliver polices on behalf <strong>of</strong> the DLTR, the Department for Education and<br />
Skills, DTI, the Home Office, the Department for Culture, Media and<br />
Sport, DEFRA, and the Department for Work and Pensions<br />
Highways Agency<br />
Highways Agency Trunk Road Information System – A Database <strong>of</strong> flow<br />
and delay information for all trunk roads.<br />
Heavy Goods Vehicle – Goods carrying vehicle over 3,500 kg design gross<br />
weight. Within this evidence OGV is used. HGV is not a defined vehicle<br />
class and so some witnesses also refer to these as Large Goods Vehicles<br />
(LGV).<br />
Incident Cost-Benefit Analysis: A spreadsheet-based computer program<br />
for calculating delays and travel time variability costs relating to<br />
incidents, and the benefits that may arise from remedial measures to<br />
reduce their impact.<br />
SATURN runs SATALL then SATASS, the results <strong>of</strong> this are then fed into<br />
another run <strong>of</strong> SATALL. Each time SATALL and SATASS is run is known<br />
as an iteration or loop.<br />
Indirect tax revenue (e.g. fuel duty).<br />
The representation <strong>of</strong> a road within the SATURN model. In the simulation<br />
area these connect the junctions (nodes), in the buffer area they<br />
represent the road as a whole including the effects <strong>of</strong> any junctions.<br />
Light Goods Vehicle – Goods vehicle not exceeding 3,500 kg design gross<br />
weight. This term is used in relation to one <strong>of</strong> the vehicle types included<br />
in the traffic model.<br />
Note: Other witnesses may use LGV to mean ‘Large Goods Vehicle’.<br />
Local Model Validation Report – Showing that the SATURN Model is<br />
correctly representing the observed traffic movements<br />
David Elliott 4<br />
A46NWI 2011PI <strong>Traffic</strong> <strong>Appendices</strong> v6.doc
A46 Newark to Widmerpool Improvement – Supplementary Orders<br />
<strong>Traffic</strong> <strong>Evidence</strong> <strong>Appendices</strong>: October 2011<br />
Abbreviation Description<br />
Loops<br />
MAC<br />
MCC<br />
MMS<br />
Mode<br />
Model<br />
Node<br />
Network<br />
NPV<br />
NRTF<br />
NTEM<br />
NTM<br />
NTS<br />
OGV<br />
OGV1<br />
OGV2<br />
SATURN runs SATALL then SATASS, the results <strong>of</strong> this are then fed into<br />
another run <strong>of</strong> SATALL. Each time SATALL and SATASS combination is<br />
one iteration or loop.<br />
Managing Agents Contractor – This is meaning for a term maintenance<br />
contactor<br />
Manual Classified Count. <strong>Traffic</strong> count conducted by enumerators at the<br />
side <strong>of</strong> the road. Enumerators record vehicles by standard type<br />
classifications.<br />
Multi Modal Studies – The overall aim <strong>of</strong> these studies is to make<br />
recommendations for long-term strategies to address passenger and<br />
freight transport needs within study corridors, several Multi-Modal<br />
Studies being undertaken on behalf <strong>of</strong> Regional Government Offices<br />
throughout the country<br />
The type <strong>of</strong> travel undertaken: the main modes <strong>of</strong> travel are cars, OGVs,<br />
public transport (road), rail, air, sea.<br />
A computer based mathematical representation <strong>of</strong> the road network and<br />
trips using it, used to forecast effects <strong>of</strong> traffic growth and change in road<br />
structure.<br />
The representation <strong>of</strong> a junction within the SATURN model. In the<br />
simulation area, the modelling <strong>of</strong> nodes represents capacity restraint and<br />
delay associated with junctions. In the buffer area, capacity restraint and<br />
delay are not modelled at nodes.<br />
SATURN representation <strong>of</strong> the road system, with all roads and junctions<br />
<strong>of</strong> interest described mathematically.<br />
Net Present Value – Is the difference between the Present Value <strong>of</strong> Costs<br />
(PVC) and the Present Value <strong>of</strong> Benefits (PVB)<br />
National Road <strong>Traffic</strong> Forecasts. Forecasts <strong>of</strong> traffic taking into account<br />
the length <strong>of</strong> trips. Outputs from NRTF should be considered in terms <strong>of</strong><br />
vehicle-kilometres.<br />
National Trip End Model. A component <strong>of</strong> the NTM that outputs growth in<br />
trips for a study area. The NTEM calculates the trips rates for Districts,<br />
and large communities within each Districts (NTEM zones) based upon<br />
population data and land use (i.e. jobs and households).<br />
National Transport Model. An integrated multi-modal model, developed<br />
and maintained by the Department <strong>of</strong> Transport, which represents travel<br />
movements across the UK and makes forecasts.<br />
National Travel Survey.<br />
Other Goods Vehicle (category 1 or 2). A vehicle greater than 3,500 kg<br />
design gross weight (i.e. not light goods). OGV is a vehicle class used in<br />
manual classified traffic counts and is a vehicle type represented by the<br />
traffic model.<br />
Other Goods Vehicle – Category 1 (rigid goods vehicle with three axles or<br />
less, bus or coach)<br />
Other Goods Vehicle – Category 2 (rigid goods vehicles with four or more<br />
axles, or articulated goods vehicles, or OGV1 goods vehicles towing<br />
caravans or trailers).<br />
David Elliott 5<br />
A46NWI 2011PI <strong>Traffic</strong> <strong>Appendices</strong> v6.doc
A46 Newark to Widmerpool Improvement – Supplementary Orders<br />
<strong>Traffic</strong> <strong>Evidence</strong> <strong>Appendices</strong>: October 2011<br />
Abbreviation Description<br />
Origin<br />
PIA<br />
PICADY<br />
PSA<br />
PSV<br />
PVB<br />
PVC<br />
RFC<br />
RPF<br />
RPS<br />
RPI<br />
RSI<br />
RTA<br />
SATURN<br />
Simulation<br />
SPECS<br />
Stabilized<br />
TAME<br />
TEE<br />
TEMPRO<br />
TPI<br />
The start point <strong>of</strong> a trip<br />
Personal Injury Accident<br />
Computer programme for assessing the capacity and design <strong>of</strong> priority<br />
junctions<br />
Public Service Agreement – a set <strong>of</strong> Department for Transport and<br />
Highways Agency performance targets<br />
Passenger Service Vehicle (with a gross vehicle weight <strong>of</strong> 3.5 tonnes or<br />
more, usually having more than 16 seats)<br />
Present Value <strong>of</strong> Benefits<br />
Present Value <strong>of</strong> Costs (including indirect tax revenue as a negative cost)<br />
Ratio <strong>of</strong> Flow to Capacity<br />
Relative Price Factor<br />
Registration Plate Survey: a traffic survey in which vehicles’ registration<br />
plate details are recorded, then matched up to examine where vehicles<br />
enter and leave the surveyed area<br />
Retail Price Index<br />
Road Side Interview – a surveying technique where drivers are<br />
interviewed to determine journey and purpose details<br />
Road <strong>Traffic</strong> Accident: An accident on the highway that has been recorded<br />
by the police on their database.<br />
Simulation and Assignment <strong>of</strong> <strong>Traffic</strong> in Urban Road Networks – A suite <strong>of</strong><br />
computer programmes designed to store traffic and road based<br />
information, route the traffic through the road network (assignment), and<br />
analyse the operational capabilities <strong>of</strong> the junctions (simulation)<br />
The process within SATURN <strong>of</strong> calculating the amount <strong>of</strong> delay caused by<br />
the level <strong>of</strong> traffic wishing to use each junction.<br />
Average speed cameras, which time vehicles between two fixed points<br />
and record the registration numbers <strong>of</strong> vehicles that exceed the speed<br />
limit.<br />
The condition where the assignment process within the traffic model no<br />
longer causes traffic to move from one route to another depending on its<br />
stage along the assignment looping process.<br />
<strong>Traffic</strong> Appraisal, Modelling and Economics section <strong>of</strong> the Highways<br />
Agency<br />
Transport Economic Efficiency: A sub-objectives in the AST under the<br />
Economy Objective; the savings in the cost <strong>of</strong> travel is compared against<br />
the cost <strong>of</strong> providing a scheme.<br />
Trip End Model Programme – A database <strong>of</strong> planning intentions and data<br />
from which traffic growth in local areas can be derived.<br />
Targeted Programme <strong>of</strong> Improvements – This is a group <strong>of</strong> projects set<br />
for the upgrading <strong>of</strong> existing roads and the construction <strong>of</strong> new roads to<br />
improve the Motorway and Trunk road Network, to improve <strong>Traffic</strong><br />
congestion and noise<br />
David Elliott 6<br />
A46NWI 2011PI <strong>Traffic</strong> <strong>Appendices</strong> v6.doc
A46 Newark to Widmerpool Improvement – Supplementary Orders<br />
<strong>Traffic</strong> <strong>Evidence</strong> <strong>Appendices</strong>: October 2011<br />
Abbreviation Description<br />
TUBA<br />
VaDMA<br />
Validation<br />
VAT<br />
VDM<br />
WebTAG<br />
Zone<br />
Transport Users Benefit Appraisal – Similar to COBA but assesses under<br />
elastic assignment conditions.<br />
Variable Demand Modelling Advice – Government guidance on elastic and<br />
other assignment techniques<br />
A process showing how correctly a calibrated traffic model represents the<br />
observed movements<br />
Value Added Tax<br />
Variable Demand Model – this is a model where the amount <strong>of</strong> traffic on<br />
the road network can go up or down depending on overall conditions.<br />
Web based <strong>Traffic</strong> Appraisal Guidance – A series <strong>of</strong> Department for<br />
Transport advisory documents available through the Internet.<br />
A point in the SATURN traffic model representing a geographical area as<br />
an origin or destination <strong>of</strong> trips. The NTEM also defines its outputs in<br />
terms <strong>of</strong> zones.<br />
David Elliott 7<br />
A46NWI 2011PI <strong>Traffic</strong> <strong>Appendices</strong> v6.doc
A46 Newark to Widmerpool Improvement – Supplementary Orders<br />
<strong>Traffic</strong> <strong>Evidence</strong> <strong>Appendices</strong>: October 2011<br />
David Elliott 8<br />
A46NWI 2011PI <strong>Traffic</strong> <strong>Appendices</strong> v6.doc
A46 Newark to Widmerpool Improvement – Supplementary Orders<br />
<strong>Traffic</strong> <strong>Evidence</strong> <strong>Appendices</strong>: October 2011<br />
APPENDIX B:<br />
COMPARISON OF TRAFFIC MODEL FORECASTS<br />
WITH THE 2009 OBSERVED FLOWS AT FARNDON<br />
ROUNDABOUT<br />
1) Observed flows from Manual Classified Count at Farndon Roundabout 12 th May<br />
2009<br />
2) Modelled flows from ‘Do-Nothing’ traffic forecast for the year 2010.<br />
AM Peak (0800 to 0900) in vehicles per hour<br />
Differenc<br />
Observed Modelled<br />
e<br />
%<br />
Difference<br />
Road Two-way Two-way<br />
A46 North 1,749 1,720 29 2%<br />
Farndon Rd 1,019 914 105 10%<br />
A46 South 2,347 2,353 -6 0%<br />
Totals 5,115 4,987 128 3%<br />
PM Peak (1700 to 1800) in vehicles per hour<br />
Differenc<br />
Observed Modelled<br />
e<br />
%<br />
Difference<br />
Road Two-way Two-way<br />
A46 North 1,782 1,845 -63 -4%<br />
Farndon Rd 1,088 1,210 -122 -11%<br />
A46 South 2,407 2,390 17 1%<br />
Totals 5,277 5,445 -168 -3%<br />
Inter-peak (1200 to 1300) in vehicles per hour<br />
Differenc<br />
Observed Modelled<br />
e<br />
%<br />
Difference<br />
Road Two-way Two-way<br />
A46 North 1,174 1,465 -291 -25%<br />
Farndon Rd 660 757 -97 -15%<br />
A46 South 1,561 1,663 -102 -7%<br />
Totals 3,395 3,885 -490 -14%<br />
David Elliott 9<br />
A46NWI 2011PI <strong>Traffic</strong> <strong>Appendices</strong> v6.doc
A46 Newark to Widmerpool Improvement – Supplementary Orders<br />
<strong>Traffic</strong> <strong>Evidence</strong> <strong>Appendices</strong>: October 2011<br />
BLANK<br />
David Elliott 10<br />
A46NWI 2011PI <strong>Traffic</strong> <strong>Appendices</strong> v6.doc
A46 Newark to Widmerpool Improvement – Supplementary Orders<br />
<strong>Traffic</strong> <strong>Evidence</strong> <strong>Appendices</strong>: October 2011<br />
APPENDIX C:<br />
COMPARISON OF PLANNING DATA FROM<br />
NTEM V5.3 WITH NTEM V6.2<br />
Reference Demand Forecasts used during 2007 scheme development to develop 2031 Design<br />
Year Forecasts based on 2004 Base Year model:<br />
Car Driver Trip Ends: Growth Factor from 2004 to 2031<br />
Data Extracted From NTEM for PM period (16:00 to 19:00)<br />
Base Year: 2004<br />
Forecast Year: 2031<br />
NTEM v5.3 NTEM v6.2<br />
Area Description All purposes All purposes<br />
Level Name Origin Destination Origin Destination<br />
GB GB 1.204 1.204 1.213 1.213<br />
Region EM 1.218 1.218 1.212 1.212<br />
County Nottinghamshire 1.158 1.167 1.250 1.236<br />
Authority Newark and Sherwood 1.154 1.141 1.460 1.381<br />
37UG2 Newark-on-Trent 1.136 1.114 1.414 1.325<br />
Authority Rushcliffe 1.147 1.119 1.217 1.138<br />
Factors that would be derived in a 2011 traffic forecasting study to apply to an updated 2010<br />
base year traffic model:<br />
Car Driver Trip Ends: Growth Factor from 2010 to a 2027 forecast year<br />
Data Extracted From NTEM for PM period (16:00 to 19:00)<br />
Base Year: 2010<br />
Forecast Year: 2027<br />
NTEM v5.3 NTEM v6.2<br />
Area Description All purposes All purposes<br />
Level Name Origin Destination Origin Destination<br />
GB GB 1.116 1.116 1.138 1.138<br />
Region EM 1.128 1.128 1.141 1.141<br />
County Nottinghamshire 1.097 1.101 1.166 1.157<br />
Authority Newark and Sherwood 1.097 1.090 1.252 1.236<br />
37UG2 Newark-on-Trent 1.090 1.078 1.225 1.195<br />
Authority Rushcliffe 1.089 1.075 1.102 1.080<br />
Car Driver Trip Ends: Growth Factor from 2010 to a 2031 forecast year<br />
Data Extracted From NTEM for PM period (16:00 to 19:00)<br />
Base Year: 2010<br />
Forecast Year: 2031<br />
NTEM v5.3 NTEM v6.2<br />
Area Description All purposes All purposes<br />
Level Name Origin Destination Origin Destination<br />
GB GB 1.133 1.133 1.162 1.162<br />
Region EM 1.151 1.151 1.164 1.164<br />
County Nottinghamshire 1.112 1.117 1.195 1.185<br />
Authority Newark and Sherwood 1.112 1.103 1.294 1.276<br />
37UG2 Newark-on-Trent 1.104 1.089 1.261 1.226<br />
Authority Rushcliffe 1.101 1.083 1.117 1.090<br />
David Elliott 11<br />
A46NWI 2011PI <strong>Traffic</strong> <strong>Appendices</strong> v6.doc
A46 Newark to Widmerpool Improvement – Supplementary Orders<br />
<strong>Traffic</strong> <strong>Evidence</strong> <strong>Appendices</strong>: October 2011<br />
BLANK<br />
David Elliott 12<br />
A46NWI 2011PI <strong>Traffic</strong> <strong>Appendices</strong> v6.doc
A46 Newark to Widmerpool Improvement – Supplementary Orders<br />
<strong>Traffic</strong> <strong>Evidence</strong> <strong>Appendices</strong>: October 2011<br />
APPENDIX D:<br />
TRANSPORT ECONOMICS TABLES FOR THE<br />
SCHEME<br />
Tables extracted from the:<br />
“Post PI Economics Appraisal Report” (EAR);<br />
Working Paper No: D123246/4/001; Issue 1 dated April 2009.<br />
The Transport Economic Efficiency (TEE) summary results table for the User Benefit <strong>of</strong> the 60-<br />
year TUBA 1.7b analysis is shown in the following Table.<br />
Transport Economic Efficiency<br />
Central Forecast<br />
Consumers<br />
User benefits<br />
Travel Time (TUBA) 428.8<br />
Vehicle operating costs (TUBA) -185.4<br />
User charges (TUBA) 0.0<br />
During Construction (Table 9-2) -4.1<br />
NET CONSUMER BENEFITS 239.4<br />
Business<br />
User benefits<br />
Travel Time (TUBA) 728.4<br />
Vehicle operating costs (TUBA) -54.4<br />
User charges (TUBA) 0.0<br />
During Construction (Table 9-2) -5.8<br />
Subtotal 668.2<br />
Private Sector Provider Impacts<br />
Revenue (TUBA) 0.0<br />
Operating costs (TUBA) 0.0<br />
Investment costs (TUBA) 0.0<br />
Grant/subsidy (TUBA) 0.0<br />
Subtotal (TUBA) 0.0<br />
Other business Impacts<br />
Developer contributions (TUBA) 0.0<br />
NET BUSINESS IMPACT 668.2<br />
TOTAL<br />
Present Value <strong>of</strong> Transport Economic<br />
Efficiency Benefits (TEE) 907.6<br />
Note: Benefits appear as positive numbers, while costs appear as negative numbers.<br />
Note: All entries are discounted to a 2002 present value year, in 2002 prices, £Millions<br />
All entries have been directly extracted and rounded from the TUBA printouts; this may cause apparent<br />
discrepancies between total and component entries.<br />
Table entries marked TUBA are from the TUBA printout; other references relate to the EAR.<br />
David Elliott 13<br />
A46NWI 2011PI <strong>Traffic</strong> <strong>Appendices</strong> v6.doc
A46 Newark to Widmerpool Improvement – Supplementary Orders<br />
<strong>Traffic</strong> <strong>Evidence</strong> <strong>Appendices</strong>: October 2011<br />
The Public Accounts table summarises the discounted cost <strong>of</strong> government expenditure since<br />
2007; i.e. during Scheme preparation, construction and during maintenance over the 60-year<br />
period <strong>of</strong> operation.<br />
Public Accounts<br />
Central Forecast<br />
Local Government Funding<br />
Revenue (TUBA) 0.0<br />
Operating costs (TUBA) 0.0<br />
Investment costs (TUBA) 0.0<br />
Developer Contributions (TUBA) 0.0<br />
Grant/Subsidy Payments (TUBA) 0.0<br />
NET IMPACT 0.0<br />
Central Government Funding<br />
Revenue (TUBA) 0.0<br />
Operating costs (sect 10.1.7) 4.7<br />
Investment costs (sect 7.2.8) 244.2<br />
Developer Contributions (TUBA) 0.0<br />
Grant/Subsidy Payments (TUBA) 0.0<br />
Tax Revenues (Construction, Table 9-3) 0.6<br />
Indirect Tax Revenues (TUBA) -196.4<br />
NET IMPACT 53.1<br />
TOTAL<br />
TOTAL Present Value <strong>of</strong> Costs (PVC) 53.1<br />
Note: Costs appear as positive numbers, while revenues and developer contributions appear as negative<br />
numbers.<br />
Note: All entries are discounted to a 2002 present value year, in 2002 prices, £Millions.<br />
All entries have been directly extracted and rounded from the TUBA printouts; this may cause apparent<br />
discrepancies between total and component entries.<br />
Table entries marked TUBA are taken from the TUBA printout; others references relate to the EAR.<br />
The following Analysis <strong>of</strong> Monetised Costs and Benefits (AMCB) table takes the accident benefit<br />
(calculated using COBA version 11R7) and carbon benefit (calculated using TUBA version 1.7b)<br />
into account. There are summaries for the PVB, PVC and NPV, appraised over the 60-year<br />
operational period.<br />
David Elliott 14<br />
A46NWI 2011PI <strong>Traffic</strong> <strong>Appendices</strong> v6.doc
A46 Newark to Widmerpool Improvement – Supplementary Orders<br />
<strong>Traffic</strong> <strong>Evidence</strong> <strong>Appendices</strong>: October 2011<br />
Analysis <strong>of</strong> Monetised Costs and Benefits<br />
Central Forecast<br />
Non-Exchequer Impacts<br />
Consumer User Benefits (Table 11-5) 239.3<br />
Business User Benefits (Table 11-5) 668.2<br />
Private Sector Provider Impacts (Table 11-5) 0.0<br />
Other Business Impacts (Table 11-5) 0.0<br />
Accident Benefits (Table 8-1) 114.0<br />
Carbon Benefits during Construction (Table 9-4) 0.1<br />
Carbon Benefits (TUBA) -35.3<br />
Net present Value <strong>of</strong> Benefits (PVB) 986.3<br />
Local Government Funding (11-6) 0.0<br />
Central Government Funding (11-6) 53.1<br />
Net present Value Costs (PVC) 53.1<br />
Overall Impact<br />
Net present Value (NPV) 933.2<br />
Note: All entries are discounted to a 2002 present value year, in 2002 prices, £Millions<br />
Entries have been directly extracted and rounded from the TUBA printouts; this may cause apparent discrepancies<br />
between total and component entries.<br />
References are to the source tables in the EAR.<br />
On the basis <strong>of</strong> available costing information, and based on 2002 prices discounted to a 2002<br />
present value year over a 60-year period, the Scheme has a benefit to users (PVB) <strong>of</strong> £986.3M,<br />
and a fiscal cost (PVC) <strong>of</strong> £53.1M, resulting in a total Net Present Value (NPV) <strong>of</strong> £933.2<br />
million benefit.<br />
On the basis <strong>of</strong> the evaluation undertaken in 2009, the Benefit to Cost Ratio (BCR) under<br />
central forecast conditions would be 18.6.<br />
The notes on the next page document the changes made by DfT to the scheme economic<br />
evaluation process since April 2009 when the above tables were produced.<br />
David Elliott 15<br />
A46NWI 2011PI <strong>Traffic</strong> <strong>Appendices</strong> v6.doc
A46 Newark to Widmerpool Improvement – Supplementary Orders<br />
<strong>Traffic</strong> <strong>Evidence</strong> <strong>Appendices</strong>: October 2011<br />
DfT Changes to Scheme Appraisal Guidance In 2011<br />
Since the AMCB table was produced, there have been a number <strong>of</strong> amendments to the DfT’s<br />
TAG guidance. These updates were published in April 2011. The main changes to the advice<br />
provided in the DfT’s TAG documents are summarised as follows:<br />
a) Adoption <strong>of</strong> latest Department <strong>of</strong> Energy and Climate Change (DECC) values for the<br />
cost <strong>of</strong> carbon emissions (adopted cross-government in June).<br />
b) Revised Benefit Cost Ratio (BCR) formula.<br />
c) Updated economic parameters including values <strong>of</strong> travel time growth, reliability, the<br />
prevention <strong>of</strong> accidents, noise, fuel costs, fuel duty and VAT.<br />
d) New monetary valuations <strong>of</strong> the health impact <strong>of</strong> air pollutants.<br />
e) A requirement for assessments <strong>of</strong> social and distributional impacts.<br />
f) Changes to the Appraisal Summary Table (AST) consistent with reform <strong>of</strong> the decision<br />
making process.<br />
g) National Trip End Model (NTEM) new dataset v6.2.<br />
h) Revised guidance on uncertainty, variable demand and the treatment <strong>of</strong> costs.<br />
Changes a, c, d and g would change the net present value <strong>of</strong> the Scheme. However the scale<br />
<strong>of</strong> the changes identified in the April 2011 TAG documents are small in relation to the size <strong>of</strong> the<br />
present value <strong>of</strong> benefits delivered to road users by the Scheme.<br />
Of the above changes, the most significant for the A46 Newark Widmerpool Improvement<br />
scheme is the revised Benefit Cost Ration (BCR) formula (change b). With the Scheme, the<br />
road users will pay more Indirect tax revenue (ITR) to HM Treasury which is accounted as part<br />
<strong>of</strong> the increased fuel costs within the vehicle operating costs calculation in the TEE table above.<br />
The revised guidance is to treat ITR as part <strong>of</strong> the wider public finances and any increase in ITR<br />
collected is to be considered as a benefit to society. As a result, ITR should be included in the<br />
Present Value Benefits (PVB) rather than as a reduction to the Present Value Costs (PVC).<br />
Therefore the PVC will increase overall as will the PVB <strong>of</strong> the Scheme.<br />
If this change was applied to the above tables, notwithstanding that the other changes should<br />
also applied, then the extra ITR (£195.8 million) paid by Road Users to HM Treasury would no<br />
longer reduce the PVC total but would be contribute to the total PVB. The BCR would thus<br />
become:<br />
PVB (including Wider Public Finances): £986.3 + £195.8 = £1,182.1 million<br />
PVC (Broad Transport Budget): £53.1 + £195.8 = £248.9 million<br />
NPV: PVB - PVC = £933.2 million<br />
BCR: PVB / PVC = 4.75<br />
The Net Present Value (NPV) is not changed by the change to the treatment <strong>of</strong> ITR and<br />
confirms that the Scheme would deliver strong transport economic benefits to the national<br />
economy.<br />
The recalculated BCR remains high at 4.75. This value is greater than 2.0 and confirms that the<br />
Scheme will provide very good value for money.<br />
David Elliott 16<br />
A46NWI 2011PI <strong>Traffic</strong> <strong>Appendices</strong> v6.doc
A46 Newark to Widmerpool Improvement – Supplementary Orders<br />
<strong>Traffic</strong> <strong>Evidence</strong> <strong>Appendices</strong>: October 2011<br />
APPENDIX E:<br />
DESIGN REFERENCE FLOWS FOR FARNDON<br />
ROUNDABOUT<br />
David Elliott 17<br />
A46NWI 2011PI <strong>Traffic</strong> <strong>Appendices</strong> v6.doc
A46 Newark to Widmerpool Improvement – Supplementary Orders<br />
<strong>Traffic</strong> <strong>Evidence</strong> <strong>Appendices</strong>: October 2011<br />
Farndon Roundabout: Design Reference Flows: 2031 Central Growth: AM Peak (0800 to 0900)<br />
Flows in Vehicles, except where PCU is indicated 1<br />
Cars Old A46 S A46 N B6166 New A46 S Totals:<br />
Old A46 S 0 64 120 10 194<br />
A46 N 15 0 61 773 849<br />
B6166 109 21 0 488 617<br />
New A46 S 0 1210 433 0 1643<br />
Totals: 124 1295 614 1271 3305<br />
OGV1 Old A46 S A46 N B6166 New A46 S Totals:<br />
PCU Old A46 S 0 2 2 0 4<br />
A46 N 2 0 7 62 70<br />
B6166 6 12 0 30 47<br />
New A46 S 0 94 41 0 135<br />
Totals: 7 109 49 91 257<br />
OGV2 Old A46 S A46 N B6166 New A46 S Totals:<br />
PCU Old A46 S 0 3 2 0 5<br />
A46 N 4 0 10 214 228<br />
B6166 3 19 0 65 87<br />
New A46 S 0 165 39 0 204<br />
Totals: 7 187 52 279 525<br />
Vehicle Old A46 S A46 N B6166 New A46 S Totals:<br />
Old A46 S 0 67 122 10 199<br />
A46 N 18 0 70 911 999<br />
B6166 114 36 0 535 684<br />
New A46 S 0 1340 473 0 1813<br />
Totals: 132 1442 665 1456 3695<br />
Vehicle Old A46 S A46 N B6166 New A46 S Totals:<br />
Old A46 S 0 67 122 10 199<br />
A46 N 18 0 70 911 999<br />
B6166 114 36 0 535 684<br />
New A46 S 0 1340 473 0 1813<br />
Totals: 132 1442 665 1456 3695<br />
Turning Flows<br />
Vehicles per hour<br />
A46 N (Newark Bypass)<br />
18<br />
911<br />
67 70<br />
122<br />
10 B6166 Newark<br />
Exg A46 S 36<br />
(Farndon) 114<br />
0 535<br />
1340<br />
473<br />
New A46 S<br />
Turning Flows at Farndon Roundabout in Vehicles<br />
2031 With Scheme: AM Peak<br />
Veh A46 N B6166 New A46 S Exg A46 S Total<br />
A46 N 0 70 911 18 999<br />
B6166 36 0 535 114 684<br />
New A46 S 1340 473 0 0 1813<br />
Exg A46 S 67 122 10 0 199<br />
Total 1442 665 1456 132 3695<br />
David Elliott 18<br />
A46NWI 2011PI <strong>Traffic</strong> <strong>Appendices</strong> v6.doc
A46 Newark to Widmerpool Improvement – Supplementary Orders<br />
<strong>Traffic</strong> <strong>Evidence</strong> <strong>Appendices</strong>: October 2011<br />
Farndon Roundabout: Design Reference Flows: 2031 Central Growth: Inter-peak<br />
Flows in Vehicles, except where PCU is indicated 1<br />
Cars Old A46 S A46 N B6166 New A46 S Totals:<br />
Old A46 S 0 38 31 20 89<br />
A46 N 14 0 94 768 876<br />
B6166 27 146 0 266 440<br />
New A46 S 0 870 350 0 1220<br />
Totals: 41 1054 475 1054 2625<br />
OGV1 Old A46 S A46 N B6166 New A46 S Totals:<br />
PCU Old A46 S 0 3 0 0 3<br />
A46 N 1 0 12 72 85<br />
B6166 2 16 0 23 42<br />
New A46 S 0 51 26 0 77<br />
Totals: 3 70 39 95 207<br />
OGV2 Old A46 S A46 N B6166 New A46 S Totals:<br />
PCU Old A46 S 0 0 0 0 0<br />
A46 N 1 0 20 167 188<br />
B6166 3 26 0 60 89<br />
New A46 S 0 143 43 0 186<br />
Totals: 4 169 63 227 463<br />
Vehicle Old A46 S A46 N B6166 New A46 S Totals:<br />
Old A46 S 0 39 31 20 90<br />
A46 N 15 0 111 887 1013<br />
B6166 30 167 0 308 505<br />
New A46 S 0 967 384 0 1352<br />
Totals: 44 1174 526 1215 2960<br />
Vehicle Old A46 S A46 N B6166 New A46 S Totals:<br />
Old A46 S 0 39 31 20 90<br />
A46 N 15 0 111 887 1013<br />
B6166 30 167 0 308 505<br />
New A46 S 0 967 384 0 1352<br />
Totals: 44 1174 526 1215 2960<br />
Turning Flows<br />
Vehicles per hour<br />
A46 N (Newark Bypass)<br />
15<br />
887<br />
39 111<br />
31<br />
20 B6166 Newark<br />
Exg A46 S 167<br />
(Farndon) 30<br />
0 308<br />
967<br />
384<br />
New A46 S<br />
Turning Flows at Farndon Roundabout in Vehicles<br />
2031 With Scheme: Inter-peak<br />
Veh A46 N B6166 New A46 S Exg A46 S Total<br />
A46 N 0 111 887 15 1013<br />
B6166 167 0 308 30 505<br />
New A46 S 967 384 0 0 1352<br />
Exg A46 S 39 31 20 0 90<br />
Total 1174 526 1215 44 2960<br />
David Elliott 19<br />
A46NWI 2011PI <strong>Traffic</strong> <strong>Appendices</strong> v6.doc
A46 Newark to Widmerpool Improvement – Supplementary Orders<br />
<strong>Traffic</strong> <strong>Evidence</strong> <strong>Appendices</strong>: October 2011<br />
Farndon Roundabout: Design Reference Flows: 2031 Central Growth: PM Peak (1700 to 1800)<br />
Flows in Vehicles, except where PCU is indicated 1<br />
Cars Old A46 S A46 N B6166 New A46 S Totals:<br />
Old A46 S 0 41 87 3 131<br />
A46 N 35 0 88 1158 1280<br />
B6166 270 130 0 228 627<br />
New A46 S 0 1167 610 0 1777<br />
Totals: 305 1338 785 1388 3815<br />
OGV1 Old A46 S A46 N B6166 New A46 S Totals:<br />
PCU Old A46 S 0 1 1 0 2<br />
A46 N 1 0 5 24 29<br />
B6166 2 5 0 5 12<br />
New A46 S 0 47 24 0 71<br />
Totals: 2 54 29 28 114<br />
OGV2 Old A46 S A46 N B6166 New A46 S Totals:<br />
PCU Old A46 S 0 0 0 0 0<br />
A46 N 1 0 9 110 121<br />
B6166 2 11 0 25 38<br />
New A46 S 0 109 32 0 141<br />
Totals: 3 120 42 135 299<br />
Vehicle Old A46 S A46 N B6166 New A46 S Totals:<br />
Old A46 S 0 41 88 3 132<br />
A46 N 35 0 95 1225 1355<br />
B6166 272 138 0 242 652<br />
New A46 S 0 1245 638 0 1883<br />
Totals: 307 1424 820 1470 4022<br />
Vehicle Old A46 S A46 N B6166 New A46 S Totals:<br />
Old A46 S 0 41 88 3 132<br />
A46 N 35 0 95 1225 1355<br />
B6166 272 138 0 242 652<br />
New A46 S 0 1245 638 0 1883<br />
Totals: 307 1424 820 1470 4022<br />
Turning Flows<br />
Vehicles per hour<br />
A46 N (Newark Bypass)<br />
35<br />
1225<br />
41 95<br />
88<br />
3 B6166 Newark<br />
Exg A46 S 138<br />
(Farndon) 272<br />
0 242<br />
1245<br />
638<br />
New A46 S<br />
Turning Flows at Farndon Roundabout in Vehicles<br />
2031 With Scheme: PM Peak<br />
Veh A46 N B6166 New A46 S Exg A46 S Total<br />
A46 N 0 95 1225 35 1355<br />
B6166 138 0 242 272 652<br />
New A46 S 1245 638 0 0 1883<br />
Exg A46 S 41 88 3 0 132<br />
Total 1424 820 1470 307 4022<br />
David Elliott 20<br />
A46NWI 2011PI <strong>Traffic</strong> <strong>Appendices</strong> v6.doc
A46 Newark to Widmerpool Improvement – Supplementary Orders<br />
<strong>Traffic</strong> <strong>Evidence</strong> <strong>Appendices</strong>: October 2011<br />
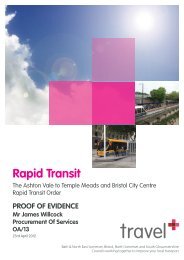
APPENDIX F: SITES SERVED BY THE ACCESS<br />
The main sites served by the Access are indicated in the following aerial photo,<br />
which was used during the development stage <strong>of</strong> the Scheme.<br />
Access<br />
David Elliott 21<br />
A46NWI 2011PI <strong>Traffic</strong> <strong>Appendices</strong> v6.doc
A46 Newark to Widmerpool Improvement – Supplementary Orders<br />
<strong>Traffic</strong> <strong>Evidence</strong> <strong>Appendices</strong>: October 2011<br />
David Elliott 22<br />
A46NWI 2011PI <strong>Traffic</strong> <strong>Appendices</strong> v6.doc
08/08/2011<br />
Monday…<br />
09/08/2011<br />
Tuesday<br />
10/08/2011<br />
Wednesday<br />
11/08/2011<br />
Thursday<br />
12/08/2011<br />
Friday<br />
18/08/2011<br />
Thursday…<br />
19/08/2011<br />
Friday<br />
30/08/2011<br />
Tuesday…<br />
31/08/2011<br />
Wednesday<br />
01/09/2011<br />
Thursday<br />
02/09/2011<br />
Friday<br />
05/09/2011<br />
Monday…<br />
06/09/2011<br />
Tuesday<br />
A46 Newark to Widmerpool Improvement – Supplementary Orders<br />
<strong>Traffic</strong> <strong>Evidence</strong> <strong>Appendices</strong>: October 2011<br />
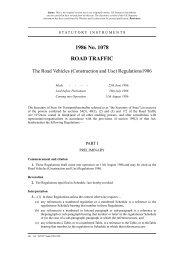
APPENDIX G:<br />
TRIP OBSERVATIONS FOR ACCESS<br />
VehClass (All)<br />
Weekend Weekday AM Peak<br />
Hour Start 8<br />
Sum <strong>of</strong> Veh<br />
In Out Grand Total<br />
Week 33 Monday 08/08/2011 6 2 8<br />
Tuesday 09/08/2011 16 5 21<br />
Wednesday 10/08/2011 19 4 23<br />
Thursday 11/08/2011 19 10 29<br />
Friday 12/08/2011 13 8 21<br />
Week 34 Thursday 18/08/2011 16 5 21<br />
Friday 19/08/2011 16 7 23<br />
Week 36 Tuesday 30/08/2011 18 5 23<br />
Wednesday 31/08/2011 16 4 20<br />
Thursday 01/09/2011 16 4 20<br />
Friday 02/09/2011 14 5 19<br />
Week 37 Monday 05/09/2011 13 5 18<br />
Tuesday 06/09/2011 11 5 16<br />
Grand Total 193 69 262<br />
Average 14.8 5.3 20.2<br />
20<br />
18<br />
In<br />
Out<br />
16<br />
14<br />
12<br />
10<br />
8<br />
6<br />
4<br />
2<br />
0<br />
David Elliott 23<br />
A46NWI 2011PI <strong>Traffic</strong> <strong>Appendices</strong> v6.doc
08/08/2011<br />
Monday…<br />
09/08/2011<br />
Tuesday<br />
10/08/2011<br />
Wednesday<br />
11/08/2011<br />
Thursday<br />
12/08/2011<br />
Friday<br />
18/08/2011<br />
Thursday…<br />
19/08/2011<br />
Friday<br />
30/08/2011<br />
Tuesday…<br />
31/08/2011<br />
Wednesday<br />
01/09/2011<br />
Thursday<br />
02/09/2011<br />
Friday<br />
05/09/2011<br />
Monday…<br />
06/09/2011<br />
Tuesday<br />
A46 Newark to Widmerpool Improvement – Supplementary Orders<br />
<strong>Traffic</strong> <strong>Evidence</strong> <strong>Appendices</strong>: October 2011<br />
VehClass (All)<br />
Weekend Weekday PM Peak<br />
Hour Start 17<br />
Sum <strong>of</strong> Veh<br />
In Out Grand Total<br />
Week 33 Monday 08/08/2011 3 9 12<br />
Tuesday 09/08/2011 5 5<br />
Wednesday 10/08/2011 2 10 12<br />
Thursday 11/08/2011 5 9 14<br />
Friday 12/08/2011 8 9 17<br />
Week 34 Thursday 18/08/2011 4 12 16<br />
Friday 19/08/2011 4 9 13<br />
Week 36 Tuesday 30/08/2011 2 7 9<br />
Wednesday 31/08/2011 2 11 13<br />
Thursday 01/09/2011 3 8 11<br />
Friday 02/09/2011 4 12 16<br />
Week 37 Monday 05/09/2011 1 10 11<br />
Tuesday 06/09/2011 2 9 11<br />
Grand Total 40 120 160<br />
Average 3.3 9.2 12.3<br />
20<br />
18<br />
16<br />
In<br />
Out<br />
14<br />
12<br />
10<br />
8<br />
6<br />
4<br />
2<br />
0<br />
David Elliott 24<br />
A46NWI 2011PI <strong>Traffic</strong> <strong>Appendices</strong> v6.doc
A46 Newark to Widmerpool Improvement – Supplementary Orders<br />
<strong>Traffic</strong> <strong>Evidence</strong> <strong>Appendices</strong>: October 2011<br />
APPENDIX H:<br />
FORECAST YEAR OPERATION ANALYSIS OF<br />
EXISTING ACCESS ONTO B6166<br />
A PICADY model has been produced for the existing priority junction that provides<br />
access onto the B6166. Models were prepared with the 2027 forecast demands in<br />
the AM and PM peak hours assigned on the B6166. All <strong>of</strong> P A Freight trips were<br />
assumed to turn right into and right out <strong>of</strong> the site (i.e. a worst case scenario for<br />
capacity).<br />
PICADY approach labels<br />
Arm A: B6166 North<br />
Arm B: Site Access<br />
Arm C: B6166 South<br />
PICADY Results<br />
Table H.1: 2027 Forecast (NTEM v6.2): Analysis <strong>of</strong> Priority B6166 / P A Freight<br />
Access<br />
Approach<br />
Max RFC<br />
AM<br />
Max<br />
Queue<br />
Max RFC<br />
PM<br />
Max<br />
Queue<br />
Site Access 0.03 0.0 0.06 0.1<br />
B6166 South (Right Turn) 0.07 0.1 0.01 0.0<br />
The target RFC for the design <strong>of</strong> a new rural priority junction is 0.75. The<br />
maximum RFC values in the table above are much less than the target value<br />
indicating that the existing Access has sufficient capacity for the expected demand<br />
forecast.<br />
Queues and delays would be small.<br />
David Elliott 25<br />
A46NWI 2011PI <strong>Traffic</strong> <strong>Appendices</strong> v6.doc
A46 Newark to Widmerpool Improvement – Supplementary Orders<br />
<strong>Traffic</strong> <strong>Evidence</strong> <strong>Appendices</strong>: October 2011<br />
BLANK<br />
David Elliott 26<br />
A46NWI 2011PI <strong>Traffic</strong> <strong>Appendices</strong> v6.doc
A46 Newark to Widmerpool Improvement – Supplementary Orders<br />
<strong>Traffic</strong> <strong>Evidence</strong> <strong>Appendices</strong>: October 2011<br />
APPENDIX I:<br />
OPERATION ANALYSIS OF FARNDON<br />
ROUNDABOUT<br />
An ARCADY model has been produced for the proposed Farndon roundabout. The<br />
drawing extract below shows the expected road markings at Farndon roundabout.<br />
The geometric parameters used for the ARCADY analysis were measured from the<br />
drawing.<br />
The A46 South (Arm A) is a standard dual carriageway. The approach half-width is<br />
7.3 metres (i.e. measured between the 1 metre wide hard strips marked on either<br />
side <strong>of</strong> the carriageway).<br />
David Elliott 27<br />
A46NWI 2011PI <strong>Traffic</strong> <strong>Appendices</strong> v6.doc
A46 Newark to Widmerpool Improvement – Supplementary Orders<br />
<strong>Traffic</strong> <strong>Evidence</strong> <strong>Appendices</strong>: October 2011<br />
ARCADY Parameters<br />
For the ARCADY analysis the approaches were labelled as:<br />
Arm A: A46 (South)<br />
Arm B: Fosse Road<br />
Arm C: A46 (North)<br />
Arm D: Farndon Road (B6166)<br />
Arm E: Access<br />
Table I.1: Roundabout parameters measured using drawing SK127<br />
Arm V (m) E (m) L (m) R (m) D (m)<br />
PHI<br />
(DEG)<br />
A 7.30 9.50 45.00 38.00 130.00 41.0<br />
B 3.50 8.50 16.00 45.00 130.00 26.0<br />
C 7.30 10.00 20.00 38.00 130.00 44.0<br />
D 3.25 8.00 14.00 43.00 130.00 35.0<br />
E 3.50 7.50 19.00 44.00 130.00 34.0<br />
V = approach road half-width; E = entry width; L = effective flare length; R = entry<br />
radius;<br />
D = inscribed circle diameter; PHI = entry angle<br />
ARCADY Results – No Trips On The Access<br />
An ARCADY analysis was undertaken using the 2031 DRF forecasts (using NTEM<br />
v5.2 growth) in AM and PM peaks.<br />
Table I.2: 2031 Design Reference Flows<br />
Approach<br />
Max RFC<br />
AM<br />
Max<br />
Queue<br />
Max RFC<br />
PM<br />
Max<br />
Queue<br />
ARM A 0.752 3.0 0.806 4.1<br />
ARM B 0.221 0.3 0.154 0.2<br />
ARM C 0.493 1.0 0.637 1.7<br />
ARM D 0.622 1.6 0.620 1.6<br />
ARM E 0.000 0.0 0.000 0.0<br />
The target RFC for the design <strong>of</strong> a new roundabout is 0.85. All <strong>of</strong> the maximum<br />
RFC values in the table above are less than the target value indicating that the<br />
roundabout design has sufficient capacity for the expected demand forecast.<br />
David Elliott 28<br />
A46NWI 2011PI <strong>Traffic</strong> <strong>Appendices</strong> v6.doc
A46 Newark to Widmerpool Improvement – Supplementary Orders<br />
<strong>Traffic</strong> <strong>Evidence</strong> <strong>Appendices</strong>: October 2011<br />
ARCADY Results With Observed Use Of the Access<br />
Adding the average weekday use <strong>of</strong> the access, in the AM and PM peak hours (as<br />
calculated in Appendix G) to Approaches C and E gives the following results.<br />
Table I.3: 2031 Design Reference Flows<br />
Approach<br />
Max RFC<br />
AM<br />
Max<br />
Queue<br />
Max RFC<br />
PM<br />
Max<br />
Queue<br />
ARM A 0.752 3.0 0.806 4.1<br />
ARM B 0.221 0.3 0.154 0.2<br />
ARM C 0.501 1.0 0.639 1.8<br />
ARM D 0.625 1.7 0.621 1.6<br />
ARM E 0.005 0.0 0.010 0.0<br />
Compared with the analysis with no trips on the access (Table H.2) there is no<br />
material difference in the operational performance <strong>of</strong> the roundabout (assuming<br />
that the level <strong>of</strong> use <strong>of</strong> the site is remains as observed).<br />
ARCADY Results With Alternative Forecast (and Observed Use Of the<br />
Access)<br />
A further ARCADY analysis was undertaken using 2027 flow forecast (using NTEM<br />
v6.2 growth factors) in the AM and PM peak hours, which is presented in Table H.4<br />
below. These 2027 forecast flows are higher than the 2031 DRF forecasts used to<br />
design the Farndon roundabout because NTEM v6.2 has larger growth factors as<br />
documented in Appendix C. To convert from the 2031 DRF flows to a 2027<br />
equivalent (using NTEM 6.2 growth) a factor <strong>of</strong> 1.076 was applied. The ARCADY<br />
results for the Farndon roundabout are:<br />
Table I.4: 2027 Flow Forecasts (using NTEM v6.2)<br />
Approach<br />
Max RFC<br />
AM<br />
Max<br />
Queue<br />
Max RFC<br />
PM<br />
Max<br />
Queue<br />
ARM A 0.813 4.3 0.874 6.8<br />
ARM B 0.261 0.4 0.184 0.2<br />
ARM C 0.543 1.2 0.692 2.2<br />
ARM D 0.696 2.3 0.695 2.3<br />
ARM E 0.006 0.0 0.011 0.0<br />
David Elliott 29<br />
A46NWI 2011PI <strong>Traffic</strong> <strong>Appendices</strong> v6.doc
A46 Newark to Widmerpool Improvement – Supplementary Orders<br />
<strong>Traffic</strong> <strong>Evidence</strong> <strong>Appendices</strong>: October 2011<br />
In summary, the tables above show:<br />
‣ The 2027 AM and PM peaks demands based on NTEM v6.2 growth factors<br />
have been assigned to the ARCADY models.<br />
‣ Differences between 2031 DRF and 2027 forecasts: The 2027 flows were<br />
derived using NTEM v6.2 growth factors applied to 2010 counts (17 years<br />
growth), whereas the historical 2031 flows were derived using NTEM v5.3<br />
growth factors applied to 2004 observations (27 years growth), which turns<br />
out to be less because NTEM now includes significantly more growth in<br />
Newark. See tables at Appendix C.<br />
‣ The analysis with the 2031 DRF demands shows the roundabout to be<br />
operating within the target RFC for new designs.<br />
‣ The analysis using the 2027 forecasts with NTEM v6.2 growth factors shows<br />
maximum RFC values less than the target value <strong>of</strong> 0.85, except on the A46<br />
South approach (arm A) which shows an RFC <strong>of</strong> 0.87. However, the ratio<br />
remains less than 1.0 and therefore it is more than likely that the roundabout<br />
would operate acceptably. The NTEM v6.2 growth factors reflect an increase<br />
in allocated development in the Newark area and these developments may<br />
have to fund improvement works to mitigate their traffic impacts.<br />
‣ In both analyses, queues and delays are shown to be minimal.<br />
‣ The impact <strong>of</strong> the trips on the Access, assuming no intensification <strong>of</strong> use <strong>of</strong><br />
the ‘PA Freight’ site, is forecast to be negligible.<br />
David Elliott 30<br />
A46NWI 2011PI <strong>Traffic</strong> <strong>Appendices</strong> v6.doc
A46 Newark to Widmerpool Improvement – Supplementary Orders<br />
<strong>Traffic</strong> <strong>Evidence</strong> <strong>Appendices</strong>: October 2011<br />
BLANK<br />
David Elliott 31<br />
A46NWI 2011PI <strong>Traffic</strong> <strong>Appendices</strong> v6.doc