Did the Swiss Economy Really Stagnate in the 1990s, and Is ...
Did the Swiss Economy Really Stagnate in the 1990s, and Is ...
Did the Swiss Economy Really Stagnate in the 1990s, and Is ...

Create successful ePaper yourself
Turn your PDF publications into a flip-book with our unique Google optimized e-Paper software.
1<br />
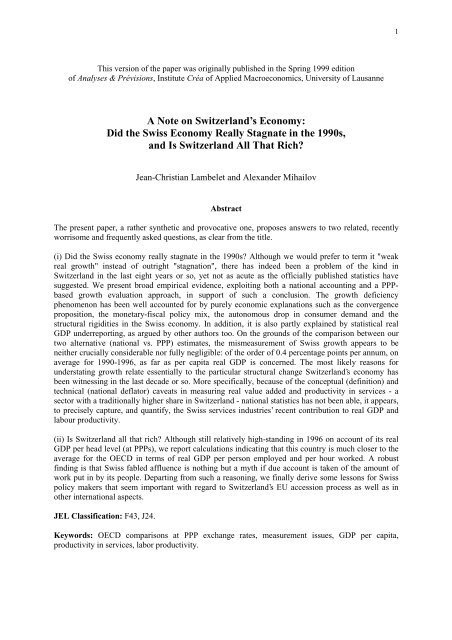
This version of <strong>the</strong> paper was orig<strong>in</strong>ally published <strong>in</strong> <strong>the</strong> Spr<strong>in</strong>g 1999 edition<br />
of Analyses & Prévisions, Institute Créa of Applied Macroeconomics, University of Lausanne<br />
A Note on Switzerl<strong>and</strong>’s <strong>Economy</strong>:<br />
<strong>Did</strong> <strong>the</strong> <strong>Swiss</strong> <strong>Economy</strong> <strong>Really</strong> <strong>Stagnate</strong> <strong>in</strong> <strong>the</strong> <strong>1990s</strong>,<br />
<strong>and</strong> <strong>Is</strong> Switzerl<strong>and</strong> All That Rich?<br />
Jean-Christian Lambelet <strong>and</strong> Alex<strong>and</strong>er Mihailov<br />
Abstract<br />
The present paper, a ra<strong>the</strong>r syn<strong>the</strong>tic <strong>and</strong> provocative one, proposes answers to two related, recently<br />
worrisome <strong>and</strong> frequently asked questions, as clear from <strong>the</strong> title.<br />
(i) <strong>Did</strong> <strong>the</strong> <strong>Swiss</strong> economy really stagnate <strong>in</strong> <strong>the</strong> <strong>1990s</strong>? Although we would prefer to term it "weak<br />
real growth" <strong>in</strong>stead of outright "stagnation", <strong>the</strong>re has <strong>in</strong>deed been a problem of <strong>the</strong> k<strong>in</strong>d <strong>in</strong><br />
Switzerl<strong>and</strong> <strong>in</strong> <strong>the</strong> last eight years or so, yet not as acute as <strong>the</strong> officially published statistics have<br />
suggested. We present broad empirical evidence, exploit<strong>in</strong>g both a national account<strong>in</strong>g <strong>and</strong> a PPPbased<br />
growth evaluation approach, <strong>in</strong> support of such a conclusion. The growth deficiency<br />
phenomenon has been well accounted for by purely economic explanations such as <strong>the</strong> convergence<br />
proposition, <strong>the</strong> monetary-fiscal policy mix, <strong>the</strong> autonomous drop <strong>in</strong> consumer dem<strong>and</strong> <strong>and</strong> <strong>the</strong><br />
structural rigidities <strong>in</strong> <strong>the</strong> <strong>Swiss</strong> economy. In addition, it is also partly expla<strong>in</strong>ed by statistical real<br />
GDP underreport<strong>in</strong>g, as argued by o<strong>the</strong>r authors too. On <strong>the</strong> grounds of <strong>the</strong> comparison between our<br />
two alternative (national vs. PPP) estimates, <strong>the</strong> mismeasurement of <strong>Swiss</strong> growth appears to be<br />
nei<strong>the</strong>r crucially considerable nor fully negligible: of <strong>the</strong> order of 0.4 percentage po<strong>in</strong>ts per annum, on<br />
average for 1990-1996, as far as per capita real GDP is concerned. The most likely reasons for<br />
understat<strong>in</strong>g growth relate essentially to <strong>the</strong> particular structural change Switzerl<strong>and</strong>’s economy has<br />
been witness<strong>in</strong>g <strong>in</strong> <strong>the</strong> last decade or so. More specifically, because of <strong>the</strong> conceptual (def<strong>in</strong>ition) <strong>and</strong><br />
technical (national deflator) caveats <strong>in</strong> measur<strong>in</strong>g real value added <strong>and</strong> productivity <strong>in</strong> services - a<br />
sector with a traditionally higher share <strong>in</strong> Switzerl<strong>and</strong> - national statistics has not been able, it appears,<br />
to precisely capture, <strong>and</strong> quantify, <strong>the</strong> <strong>Swiss</strong> services <strong>in</strong>dustries’ recent contribution to real GDP <strong>and</strong><br />
labour productivity.<br />
(ii) <strong>Is</strong> Switzerl<strong>and</strong> all that rich? Although still relatively high-st<strong>and</strong><strong>in</strong>g <strong>in</strong> 1996 on account of its real<br />
GDP per head level (at PPPs), we report calculations <strong>in</strong>dicat<strong>in</strong>g that this country is much closer to <strong>the</strong><br />
average for <strong>the</strong> OECD <strong>in</strong> terms of real GDP per person employed <strong>and</strong> per hour worked. A robust<br />
f<strong>in</strong>d<strong>in</strong>g is that <strong>Swiss</strong> fabled affluence is noth<strong>in</strong>g but a myth if due account is taken of <strong>the</strong> amount of<br />
work put <strong>in</strong> by its people. Depart<strong>in</strong>g from such a reason<strong>in</strong>g, we f<strong>in</strong>ally derive some lessons for <strong>Swiss</strong><br />
policy makers that seem important with regard to Switzerl<strong>and</strong>’s EU accession process as well as <strong>in</strong><br />
o<strong>the</strong>r <strong>in</strong>ternational aspects.<br />
JEL Classification: F43, J24.<br />
Keywords: OECD comparisons at PPP exchange rates, measurement issues, GDP per capita,<br />
productivity <strong>in</strong> services, labor productivity.
2<br />
A Note on Switzerl<strong>and</strong>’s <strong>Economy</strong><br />
<strong>Did</strong> <strong>the</strong> <strong>Swiss</strong> economy really stagnate <strong>in</strong> <strong>the</strong> 1990’s,<br />
<strong>and</strong> is Switzerl<strong>and</strong> really all that rich ?<br />
Jean-Christian Lambelet <strong>and</strong> Alex<strong>and</strong>er Mihailov<br />
Créa Institute, Lausanne University<br />
1. Stagnation <strong>in</strong> <strong>the</strong> 1990’s ?<br />
1.1 The conventional view (national growth estimates)<br />
The graphs <strong>in</strong> Figure 1 illustrate a widely-known "fact" about <strong>the</strong> growth performance of <strong>the</strong><br />
<strong>Swiss</strong> economy <strong>in</strong> <strong>the</strong> <strong>1990s</strong>. Compar<strong>in</strong>g Switzerl<strong>and</strong> with <strong>the</strong> OECD <strong>and</strong> <strong>the</strong> European<br />
Union as a whole, <strong>and</strong> with three neighbor<strong>in</strong>g countries (Austria, France, Italy), 1 it is seen that<br />
<strong>the</strong> curve for Switzerl<strong>and</strong>'s total real GDP - as estimated by national sources - became flat <strong>in</strong><br />
1991 <strong>and</strong> rema<strong>in</strong>ed essentially so <strong>the</strong>reafter (with however a slight uptick <strong>in</strong> 1997 <strong>and</strong> 1998)<br />
whereas no comparable break occurred <strong>in</strong> <strong>the</strong> o<strong>the</strong>r countries or groups of countries. The latter<br />
were also hit by a recession or a slow-down <strong>in</strong> <strong>the</strong> first years of <strong>the</strong> decade, but <strong>the</strong>y <strong>the</strong>n<br />
resumed grow<strong>in</strong>g more or less along <strong>the</strong>ir former path. In Switzerl<strong>and</strong>, by contrast, <strong>the</strong> 1990-<br />
91 years seem to have marked a break <strong>in</strong> <strong>the</strong> series, apparently usher<strong>in</strong>g <strong>in</strong> a new epoch of<br />
stagnation, a k<strong>in</strong>d of "steady state".<br />
The recent <strong>Swiss</strong> picture looks even bleaker if one considers real GDP on a per capita basis<br />
as illustrated <strong>in</strong> Figure 2. It is seen that accord<strong>in</strong>g to Switzerl<strong>and</strong>'s official national accounts,<br />
real output per capita actually decl<strong>in</strong>ed <strong>in</strong> 1991-96. It <strong>the</strong>n recovered somewhat <strong>in</strong> 1997 <strong>and</strong><br />
1998, but its level <strong>in</strong> <strong>the</strong> latter year rema<strong>in</strong>ed below <strong>the</strong> 1990 peak... As aga<strong>in</strong>st that, real GDP<br />
per capita <strong>in</strong> <strong>the</strong> o<strong>the</strong>r countries or groups of countries exhibits <strong>the</strong> same overall pattern as<br />
total real GDP.<br />
Thus, judg<strong>in</strong>g from <strong>the</strong>se two sets of graphs, Switzerl<strong>and</strong>'s economy would seem to "st<strong>and</strong><br />
out" <strong>in</strong>ternationally <strong>in</strong> <strong>the</strong> <strong>1990s</strong> on account of its stagnation or quasi-stagnation, <strong>in</strong> <strong>the</strong> sense<br />
that it appears to be at or close to <strong>the</strong> bottom of <strong>the</strong> <strong>in</strong>ternational growth league.<br />
1.2 Doubts about <strong>the</strong> conventional view<br />
Does <strong>the</strong> picture afforded by <strong>Swiss</strong> national data correspond to reality or might it be due, at<br />
least <strong>in</strong> part, to various data (ie. measurement) problems?<br />
1 / Germany is not <strong>in</strong>cluded because of data problems (discont<strong>in</strong>uous series or series of questionable<br />
homogeneity) aris<strong>in</strong>g from its re-unification.
3<br />
Figure 1: Total Real GDP - International Comparison, 1970-1998<br />
(<strong>in</strong> millions of USD at 1990 prices <strong>and</strong> exchange rat es; semi- log scale)<br />
240<br />
220<br />
200<br />
Switzerl<strong>and</strong><br />
20000<br />
18000<br />
16000<br />
14000<br />
12000<br />
OECD<br />
180<br />
10000<br />
160<br />
70 75 80 85 90 95<br />
8000<br />
70 75 80 85 90 95<br />
8000<br />
7000<br />
6000<br />
EU<br />
200<br />
180<br />
160<br />
140<br />
Austria<br />
5000<br />
120<br />
100<br />
4000<br />
70 75 80 85 90 95<br />
80<br />
70 75 80 85 90 95<br />
1400<br />
1200<br />
1000<br />
800<br />
France<br />
1300<br />
1200<br />
1100<br />
1000<br />
900<br />
800<br />
700<br />
Italy<br />
600<br />
70 75 80 85 90 95<br />
600<br />
70 75 80 85 90 95<br />
Source: OECD-OCDE (1999), "National Accounts: Ma<strong>in</strong> Aggregates - 1960-1997 - Volume 1 - Comptes<br />
nationaux: pr<strong>in</strong>cipaux agrégats", Paris, Part Six, Table 7, pp. 138-139.
4<br />
Figure 2: Real GDP per Capita - International Comparison, 1970-1998<br />
(<strong>in</strong> US D at 1990 prices <strong>and</strong> exch ange rat es; semi-log scale)<br />
34000<br />
Switzerl<strong>and</strong><br />
22000<br />
OECD<br />
32000<br />
30000<br />
20000<br />
18000<br />
16000<br />
28000<br />
14000<br />
26000<br />
70 75 80 85 90 95<br />
12000<br />
70 75 80 85 90 95<br />
22000<br />
20000<br />
18000<br />
16000<br />
14000<br />
EU<br />
24000<br />
22000<br />
20000<br />
18000<br />
16000<br />
14000<br />
Austria<br />
12000<br />
12000<br />
10000<br />
70 75 80 85 90 95<br />
10000<br />
70 75 80 85 90 95<br />
France<br />
24000<br />
22000<br />
20000<br />
18000<br />
16000<br />
14000<br />
Italy<br />
22000<br />
20000<br />
18000<br />
16000<br />
14000<br />
12000<br />
70 75 80 85 90 95<br />
12000<br />
70 75 80 85 90 95<br />
S ource: OECD-OCDE (1999), "National Accounts: Ma<strong>in</strong> Aggregates - 1960-1997 - Volume 1 - Comptes<br />
nationaux: pr<strong>in</strong>cipaux agrégats", P aris, Part Six, Table 7, pp. 138-139 <strong>and</strong> Part Eight, Table 1, pp. 174-175.
5<br />
1.2.1 Ulrich Kohli’s f<strong>in</strong>d<strong>in</strong>gs<br />
In two sem<strong>in</strong>al papers, Ulrich Kohli (University of Geneva) identified several reasons why<br />
recent economic growth has most likely been underestimated <strong>in</strong> Switzerl<strong>and</strong>. 2 His first (1993)<br />
paper concentrates on <strong>the</strong> so-called terms of trade effect: s<strong>in</strong>ce Switzerl<strong>and</strong>’s terms of trade<br />
have tended to evolve quite favorably as shown by Figure 3, 3 deflat<strong>in</strong>g <strong>Swiss</strong> nom<strong>in</strong>al exports<br />
by <strong>the</strong> import price <strong>in</strong>dex (thus measur<strong>in</strong>g, as it were, <strong>the</strong>ir real "purchas<strong>in</strong>g power" on world<br />
markets) will result <strong>in</strong> a higher growth rate for exports, <strong>and</strong> hence also for real GDP<br />
considered as an (imperfect) measure of economic welfare. 4<br />
1.4<br />
Figure 3: Switzerl<strong>and</strong>’s Terms of Trade, 1980-1998<br />
(semi-log scale)<br />
1.2<br />
1.0<br />
0.8<br />
80 81 82 83 84 85 86 87 88 89 90 91 92 93 94 95 96 97 98<br />
goods services goods <strong>and</strong> services<br />
Source: Créa databank.<br />
As Figure 3 also shows, <strong>the</strong> improvement <strong>in</strong> <strong>the</strong> <strong>Swiss</strong> terms of trade has been particularly<br />
strong for services, a fact to which we shall return below (section 1.2.2).<br />
Ulrich Kohli’s second (1997) paper deals firstly with <strong>the</strong> more technical problem of which<br />
<strong>in</strong>dices are or should be used when comput<strong>in</strong>g real GDP <strong>and</strong> hence its growth path. Real GDP<br />
is typically computed as a direct Laspeyres quantity <strong>in</strong>dex of <strong>the</strong> various GDP components<br />
while <strong>the</strong> GDP price deflator is conventionally calculated as a direct Paasche <strong>in</strong>dex. Argu<strong>in</strong>g<br />
as he does that this may be unsatisfactory on various grounds, Kohli re-computes<br />
2 / U. Kohli, "GNP Growth Account<strong>in</strong>g <strong>in</strong> <strong>the</strong> Open <strong>Economy</strong>: Parametric <strong>and</strong> Nonparametric Estimates for<br />
Switzerl<strong>and</strong>", Revue suisse d'économie politique et de statistique, 1993/129, 601; <strong>Swiss</strong> Real GDP Growth,<br />
1980-1996, work<strong>in</strong>g paper, mimeo, University of Geneva, 1997.<br />
3 / Mean<strong>in</strong>g that <strong>the</strong> average price of <strong>Swiss</strong> exports has tended to <strong>in</strong>crease faster than <strong>the</strong> average price of <strong>Swiss</strong><br />
imports.<br />
4 / It would appear that <strong>the</strong> fairly impressive <strong>and</strong> cont<strong>in</strong>uous improvement <strong>in</strong> Switzerl<strong>and</strong>’s terms of trade may be<br />
attributed, <strong>in</strong> first approximation <strong>and</strong> at least <strong>in</strong> part, to <strong>the</strong> above-average performance of <strong>Swiss</strong> export<br />
<strong>in</strong>dustries on world markets.
6<br />
Switzerl<strong>and</strong>’s total real GDP us<strong>in</strong>g four different <strong>in</strong>dices (ie. <strong>the</strong> conventional Laspeyres <strong>and</strong><br />
Paasche <strong>in</strong>dices, Fisher's ideal as well as Törnqvist superlative <strong>in</strong>dex) <strong>in</strong> both <strong>the</strong>ir direct <strong>and</strong><br />
cha<strong>in</strong> version. He thus gets eight different estimates of Switzerl<strong>and</strong>'s real GDP <strong>in</strong> <strong>the</strong> 1980-<br />
1996 period.<br />
Interest<strong>in</strong>gly enough, Kohli f<strong>in</strong>ds that his various estimates of total real GDP rema<strong>in</strong> closely<br />
bunched <strong>in</strong> <strong>the</strong> 1980s, only to diverge sharply <strong>in</strong> <strong>the</strong> <strong>1990s</strong>. For (e.g.) 1996, <strong>the</strong> estimated<br />
growth rates range from -1.4% (Laspeyres' cha<strong>in</strong> <strong>in</strong>dex) to +3.2% (Paasche's direct <strong>in</strong>dex).<br />
The Törnqvist cha<strong>in</strong> <strong>in</strong>dex, preferred by Kohli on methodological grounds toge<strong>the</strong>r with <strong>the</strong><br />
Fisher <strong>in</strong>dex, falls <strong>in</strong>-between, yield<strong>in</strong>g an estimated growth rate of 0.1%.<br />
Ano<strong>the</strong>r possible source of underestimation or distortion exam<strong>in</strong>ed by Kohli <strong>in</strong> his 1997<br />
paper concerns <strong>the</strong> deflation of Switzerl<strong>and</strong>'s GDP component termed "changes <strong>in</strong> <strong>in</strong>ventories<br />
<strong>and</strong> statistical discrepancy". One feature of <strong>the</strong> <strong>Swiss</strong> national accounts which, until recently,<br />
used to dist<strong>in</strong>guish <strong>the</strong>m from <strong>the</strong>ir foreign counterparts was that <strong>the</strong>y did not <strong>in</strong>dicate <strong>in</strong>ventory<br />
changes <strong>and</strong> statistical discrepancy separately, but bunch <strong>the</strong>m <strong>in</strong>to one aggregate. 5<br />
Moreover, <strong>the</strong> correspond<strong>in</strong>g price deflator, which <strong>the</strong> official tables did not <strong>in</strong>dicate but<br />
which can be calculated, tended to fluctuate most wildly, suggest<strong>in</strong>g that someth<strong>in</strong>g might<br />
have been amiss with this aggregate when taken <strong>in</strong> real terms. Kohli tried to correct for this <strong>in</strong><br />
various ways, <strong>and</strong> fur<strong>the</strong>rmore select<strong>in</strong>g a geometric average of <strong>the</strong> growth factors <strong>in</strong>dicated<br />
by <strong>the</strong> Fisher <strong>and</strong> implicit Törnqvist cha<strong>in</strong> <strong>in</strong>dices (see above), he reached <strong>the</strong> follow<strong>in</strong>g<br />
general conclusion :<br />
(...) One can venture that real growth might have been about 1.6% <strong>in</strong> 1994, 0.8% <strong>in</strong><br />
1995 <strong>and</strong> -0.4% <strong>in</strong> 1996, a performance that is not quite as bad as <strong>the</strong> official figures<br />
suggest. [These official figures are: 0.5% <strong>in</strong> 1994, 0.6% <strong>in</strong> 1995 <strong>and</strong> 0.0% <strong>in</strong> 1996]. 6<br />
But <strong>the</strong>re are o<strong>the</strong>r reasons than those exam<strong>in</strong>ed by Kohli why Switzerl<strong>and</strong>'s real growth<br />
may have been underestimated <strong>in</strong> <strong>the</strong> <strong>1990s</strong>, as we shall now see.<br />
1.2.2 Productivity growth <strong>in</strong> <strong>the</strong> services sector<br />
It is well known that estimat<strong>in</strong>g real growth, ie. <strong>the</strong> change <strong>in</strong> real value added, is very<br />
arduous for services <strong>in</strong> general, 7 <strong>and</strong> particularly so for f<strong>in</strong>ancial-bank<strong>in</strong>g, 8 <strong>in</strong>formationtechnology<br />
9 <strong>and</strong> <strong>in</strong>surance 10 services. The balance of <strong>in</strong>formed op<strong>in</strong>ion is that real<br />
5 / This peculiarity has now been corrected: <strong>in</strong>ventory changes <strong>and</strong> statistical discrepancy are reported separately<br />
<strong>in</strong> today’s <strong>Swiss</strong> national accounts. But this was not <strong>the</strong> case for <strong>the</strong> data available at <strong>the</strong> time Kohli wrote his<br />
paper.<br />
6 / Add<strong>in</strong>g up <strong>the</strong> annual growth rates calculated by Kohli yields a total of 2.0%, as aga<strong>in</strong>st 1.1% for <strong>the</strong> official<br />
figures. This means that, accord<strong>in</strong>g to Kohli, growth <strong>in</strong> 1994-96 was almost twice that <strong>in</strong>dicated by <strong>the</strong> official<br />
data.<br />
7 / See for example: M.N. Baily <strong>and</strong> R.J. Gordon, "The Productivity Slowdown, Measurement <strong>Is</strong>sues, <strong>and</strong> <strong>the</strong><br />
Explosion of Computer Power", Brook<strong>in</strong>gs Papers on Economic Activity, 1988/2, 347-429; S. Fisher,<br />
"Symposium on <strong>the</strong> Slowdown <strong>in</strong> Productivity Growth", Journal of Economic Perspectives, 1988/2, 3-7; Z. Griliches,<br />
"Productivity Puzzles <strong>and</strong> R&D: Ano<strong>the</strong>r Non-Explanation", Journal of Economic Perspectives, 1988/2,<br />
9-21; D.W. Jorgenson, "Productivity <strong>and</strong> Postwar US Economic Growth", Journal of Economic Perspectives,<br />
1988/2, 23-41. Also see <strong>the</strong> updated <strong>and</strong> enlarged <strong>in</strong>ternet version of: OECD, Measurement of Valued Added at<br />
Constant Prices <strong>in</strong> Services Activities, Sources <strong>and</strong> Methods, Paris, 1987.<br />
8 / See for example: J.H. Boyd <strong>and</strong> M. Gertler, "Are Banks Dead? Or Are <strong>the</strong> Reports Greatly Exaggerated?",<br />
Federal Reserve Bank of M<strong>in</strong>neapolis Quarterly Review, 1994/18/3; M.J. M<strong>and</strong>el, "F<strong>in</strong>ancial Services: The<br />
Silent Eng<strong>in</strong>e", American News Commentary, Bus<strong>in</strong>ess Week, Dec. 21, 1998, 59-60.<br />
9 / See for example: Information Technology Outlook, OECD, Paris, 1997.<br />
10 / See for example: J. Gadrey, "A propos de l'analyse économique des services d'assurance: le concept de<br />
produit et la question de son évaluation", Revue économique, 1994/45/2, 193-213.
7<br />
productivity growth <strong>in</strong> those sectors tends to be seriously underestimated <strong>in</strong> most national<br />
accounts, if not <strong>in</strong> all of <strong>the</strong>m.<br />
The result<strong>in</strong>g underestimation of real GDP growth may however vary by country depend<strong>in</strong>g<br />
first on country-specific national-account<strong>in</strong>g techniques <strong>and</strong>, second, on <strong>the</strong> overall<br />
importance of <strong>the</strong> services sectors <strong>in</strong> each country. It may well be that <strong>the</strong> underestimation is<br />
especially important on both counts <strong>in</strong> <strong>the</strong> case of Switzerl<strong>and</strong>.<br />
Whereas it is difficult to generalize about country-specific national-account<strong>in</strong>g techniques<br />
(however see below), Figure 4 shows that <strong>the</strong> share of services <strong>in</strong> total civilian employment is<br />
significantly larger <strong>in</strong> Switzerl<strong>and</strong> than <strong>in</strong> <strong>the</strong> European Union taken as a whole. 11 Moreover,<br />
<strong>the</strong> slight reversal of <strong>the</strong> positive trend which occurred <strong>in</strong> <strong>the</strong> early <strong>1990s</strong> was longer <strong>and</strong><br />
more pronounced <strong>in</strong> <strong>the</strong> EU than <strong>in</strong> Switzerl<strong>and</strong>.<br />
70<br />
Figure 4: Share of Services <strong>in</strong> Total Civilian Employment<br />
(<strong>in</strong> %; semi-log scale)<br />
65<br />
60<br />
55<br />
50<br />
45<br />
74 76 78 80 82 84 86 88 90 92 94 96<br />
Switzerl<strong>and</strong>*<br />
EU<br />
* The service sector employment <strong>and</strong> <strong>the</strong> civilian employment<br />
time series for Switzerl<strong>and</strong> were adjusted backwards to account<br />
for a break <strong>in</strong> <strong>the</strong> series <strong>in</strong> 1991. The adjustment consisted <strong>in</strong><br />
"<strong>in</strong>flat<strong>in</strong>g" <strong>the</strong> 1973-1990 "old" figures by <strong>the</strong> average ratio<br />
derived for <strong>the</strong> years 1991, 1992 <strong>and</strong> 1993, for which both<br />
"old" <strong>and</strong> "new" figures are available.<br />
Source: OECD-OCDE (1997) "Labour Force Statistics - 1976-1996 - Statistiques de la population<br />
active", Paris, Table 4.0, pp. 26-27 <strong>and</strong> Table 7.0, pp. 40-41.<br />
Ano<strong>the</strong>r clue to an underestimation of real productivity growth <strong>in</strong> services that may be more<br />
important <strong>in</strong> Switzerl<strong>and</strong> than elsewhere is <strong>the</strong> fact that <strong>the</strong> <strong>Swiss</strong> terms of trade for services<br />
have improved massively over time (see above, Figure 3), more so it would seem than for<br />
most o<strong>the</strong>r countries.<br />
11 / We use <strong>the</strong> share <strong>in</strong> employment ra<strong>the</strong>r than <strong>the</strong> share <strong>in</strong> output precisely because of <strong>the</strong> difficulties associated<br />
with measur<strong>in</strong>g output <strong>in</strong> <strong>the</strong> services activities.
8<br />
1.2.3 O<strong>the</strong>r factors<br />
A related issue has to do with productivity growth <strong>in</strong> <strong>the</strong> public sector <strong>and</strong> especially <strong>in</strong> <strong>the</strong><br />
official adm<strong>in</strong>istrations (which <strong>in</strong>clude public education). If our <strong>in</strong>formation is correct,<br />
reported real productivity growth <strong>in</strong> this sector seems to be essentially nil <strong>in</strong> Switzerl<strong>and</strong><br />
because - <strong>the</strong>re be<strong>in</strong>g no markets - <strong>the</strong> changes <strong>in</strong> real output are calculated from <strong>the</strong> changes<br />
<strong>in</strong> real <strong>in</strong>puts, ie. mostly hours worked. 12 In France, by contrast, a real productivity growth<br />
factor equal to 1% p.a. is apparently <strong>in</strong>serted "by h<strong>and</strong>".<br />
On a more technical level, national statistical offices <strong>in</strong> many countries 13 use <strong>the</strong> so-called<br />
double-deflation method to estimate real value added <strong>in</strong> service activities whereas Switzerl<strong>and</strong><br />
applies <strong>the</strong> direct extrapolation method. 14 The former is demonstrably more precise than <strong>the</strong><br />
latter, <strong>and</strong> it is not impossible that Switzerl<strong>and</strong>’s use of <strong>the</strong> less sophisticated method also<br />
leads to an underestimation of real growth <strong>in</strong> <strong>the</strong> services sector.<br />
To sum up: <strong>the</strong>re are thus many reasons to suspect that <strong>the</strong> reported growth of real GDP has<br />
been underestimated <strong>in</strong> Switzerl<strong>and</strong>, particularly <strong>in</strong> <strong>the</strong> <strong>1990s</strong>, <strong>and</strong> it may well be that this<br />
underestimation has been more serious <strong>in</strong> Switzerl<strong>and</strong> than <strong>in</strong> many o<strong>the</strong>r OECD countries<br />
<strong>and</strong> perhaps <strong>in</strong> most.<br />
Does that mean that Switzerl<strong>and</strong>’s stagnation <strong>in</strong> <strong>the</strong> <strong>1990s</strong> may be noth<strong>in</strong>g more than a<br />
statistical artefact? In o<strong>the</strong>r words, does it mean that <strong>the</strong> <strong>Swiss</strong> economy might not, after all,<br />
have fallen beh<strong>in</strong>d <strong>the</strong> o<strong>the</strong>r <strong>in</strong>dustrialized countries, or most of <strong>the</strong>m? Our answer to <strong>the</strong>se<br />
questions is a qualified no; ie. it will be argued <strong>in</strong> <strong>the</strong> next two sections that <strong>the</strong>re has <strong>in</strong>deed<br />
been a problem of slow growth, although not as acute as suggested by national data.<br />
1.3 Ano<strong>the</strong>r View (PPP surveys)<br />
Ano<strong>the</strong>r, altoge<strong>the</strong>r different way of assess<strong>in</strong>g <strong>and</strong> compar<strong>in</strong>g <strong>the</strong> "growth performance" of<br />
<strong>the</strong> OECD countries is by reference to <strong>the</strong> cross-section results of <strong>the</strong> periodic PPP<br />
(purchas<strong>in</strong>g power parity) surveys masterm<strong>in</strong>ded by <strong>the</strong> OECD. As <strong>the</strong> reader may know,<br />
<strong>the</strong>se surveys allow <strong>the</strong> computation of "artificial" or "non-market" exchange rates (ie. PPP<br />
exchange rates) which equalize <strong>the</strong> purchas<strong>in</strong>g power of any given sum <strong>in</strong> <strong>the</strong> various national<br />
currencies concerned. 15 Given <strong>the</strong>se PPP exchange rates, total <strong>and</strong> per capita GDP can <strong>the</strong>n be<br />
mean<strong>in</strong>gfully compared <strong>in</strong> <strong>the</strong> various participat<strong>in</strong>g countries, 16 <strong>and</strong> <strong>the</strong> latter may be ranked<br />
<strong>in</strong> each survey year by reference to an <strong>in</strong>dex equal to 100 for <strong>the</strong> OECD as a whole.<br />
Table 1 <strong>in</strong>dicates <strong>the</strong> per capita GDP rank<strong>in</strong>g of 25 OECD countries <strong>in</strong> <strong>the</strong> 1990, 1993 <strong>and</strong><br />
1996 survey years. (The figures for 1997 are extrapolations based on <strong>in</strong>flation rate differentials<br />
<strong>and</strong> are reproduced for <strong>in</strong>formation purposes only). The 1990 survey is <strong>the</strong> first one <strong>in</strong><br />
12 / To illustrate: as far as we know, <strong>the</strong> (m<strong>in</strong>uscule) contribution of our Institute to Switzerl<strong>and</strong>’s real GDP is still<br />
measured <strong>in</strong> <strong>the</strong> official national accounts on <strong>the</strong> basis of hours worked. Yet, because of <strong>the</strong> huge advance <strong>in</strong><br />
computer technology (software as well as hardware), we can do today <strong>in</strong> two or three days what used to take us a<br />
month.<br />
13 / Ie. Japan, Denmark, <strong>the</strong> United States, Germany, France, Canada, <strong>the</strong> Ne<strong>the</strong>rl<strong>and</strong>s <strong>and</strong> Sweden.<br />
14 / Often bas<strong>in</strong>g <strong>the</strong> extrapolation on a s<strong>in</strong>gle <strong>in</strong>dicator. On this, see <strong>the</strong> updated <strong>and</strong> enlarged <strong>in</strong>ternet version of:<br />
OECD, Measurement of Valued Added at Constant Prices <strong>in</strong> Services Activities, Sources <strong>and</strong> Methods, Paris,<br />
1987.<br />
15 / The PPP exchange rates often diverge considerably from <strong>the</strong> market rates. For example, <strong>the</strong> American dollar<br />
was worth 1.236 <strong>Swiss</strong> francs on <strong>the</strong> market <strong>in</strong> 1996 (annual average) whereas <strong>the</strong> PPP exchange rate was 2.05<br />
francs to <strong>the</strong> US dollar.<br />
16 / Ie. much more mean<strong>in</strong>gfully than if market exchange rates are used.
9<br />
which Switzerl<strong>and</strong> participated fully, <strong>the</strong> <strong>Swiss</strong> figures <strong>in</strong> <strong>the</strong> OECD tables for earlier years<br />
be<strong>in</strong>g <strong>in</strong>direct estimates of questionable accuracy. A close look at <strong>the</strong> methodology used by<br />
<strong>the</strong> OECD <strong>and</strong> <strong>the</strong> considerable amount of effort <strong>and</strong> <strong>in</strong>formation that goes <strong>in</strong>to <strong>the</strong> PPP<br />
surveys suggest that <strong>the</strong> result<strong>in</strong>g country rank<strong>in</strong>gs are probably fairly reliable, although of<br />
course not perfectly so. 17 In that respect, it is noteworthy that <strong>the</strong>se PPP results are used, as a<br />
rule, by Brussels to determ<strong>in</strong>e <strong>the</strong> member countries’ contributions to <strong>the</strong> EU budget.<br />
Table 1: GDP per Capita - Indices Us<strong>in</strong>g Current PPPs (OECD=100)<br />
1990 1993 1996 1997*<br />
Canada 114 108 110 111<br />
Mexico 36 38 35 36<br />
United States 137 136 135 136<br />
Japan 110 114 117 114<br />
Australia 99 97 103 102<br />
New Zeal<strong>and</strong> 82 83 84 83<br />
Austria 103 106 108 107<br />
Belgium 103 109 108 108<br />
Denmark 105 109 118 119<br />
F<strong>in</strong>l<strong>and</strong> 100 86 92 95<br />
France 107 103 100 99<br />
Germany 99 102 103 103<br />
Greece 57 61 64 65<br />
Icel<strong>and</strong> 107 104 114 116<br />
Irel<strong>and</strong> 70 79 90 96<br />
Italy 100 98 100 99<br />
Luxembourg 141 156 155 154<br />
Ne<strong>the</strong>rl<strong>and</strong>s 98 99 102 103<br />
Norway 108 118 124 125<br />
Portugal 59 64 67 68<br />
Spa<strong>in</strong> 73 74 74 74<br />
Sweden 105 93 96 95<br />
Switzerl<strong>and</strong> 131 130 122 121<br />
Turkey 29 31 29 30<br />
United K<strong>in</strong>gdom 98 94 95 95<br />
OECD 25 100 100 100 100<br />
*Extrapolations based on <strong>in</strong>flation-rate differentials.<br />
Source: OECD-OCDE (1999), "National Accounts: Ma<strong>in</strong> Aggregates - 1960-1997, Volume 1 -<br />
Comptes nationaux : pr<strong>in</strong>cipaux agrégats", Paris, Part Seven, Comparative Tables Based on<br />
PPPs, Table 3, pp. 162-163.<br />
Table 1 shows that per capita GDP <strong>in</strong> Switzerl<strong>and</strong> decreased but slightly between 1990 <strong>and</strong><br />
1993 relative to an OECD average equal to 100, ie. from 131 to 130, which is probably not<br />
17 / For a discussion of <strong>the</strong>se matters as well as for some results that can be obta<strong>in</strong>ed from <strong>the</strong> OECD PPP data,<br />
see: J.Ch. Lambelet, "Niveau de vie et niveaux des prix en Suisse et dans les autres pays de l’OCDE", Analyses<br />
& Prévisions, Institut Créa, Université de Lausanne, Spr<strong>in</strong>g 1994 edition.
10<br />
significant. From 1993 to 1996, however, it fell by no less than 8 po<strong>in</strong>ts, ie. from 130 to 122.<br />
This is particularly <strong>in</strong>terest<strong>in</strong>g <strong>in</strong>asmuch as it means that Switzerl<strong>and</strong> hardly lost any ground<br />
dur<strong>in</strong>g <strong>the</strong> recession years of <strong>the</strong> early <strong>1990s</strong>, but that it did fall back significantly after <strong>the</strong><br />
OECD-wide recession had ended. We shall return to this f<strong>in</strong>d<strong>in</strong>g later on when exam<strong>in</strong><strong>in</strong>g <strong>the</strong><br />
possible reasons for Switzerl<strong>and</strong>’s relative growth under-performance <strong>in</strong> <strong>the</strong> 1993-1996<br />
(possibly 1993-1998) years.<br />
Let it also be noted, by anticipation on this paper’s last section ("<strong>Is</strong> Switzerl<strong>and</strong> really all<br />
that rich?"), that per capita GDP never<strong>the</strong>less rema<strong>in</strong>ed comparatively high <strong>in</strong> Switzerl<strong>and</strong> <strong>in</strong><br />
1996, its level (122) be<strong>in</strong>g surpassed <strong>in</strong> that year only by Luxembourg (155), <strong>the</strong> United<br />
States (135) <strong>and</strong> Norway (124). Thus, Switzerl<strong>and</strong> still ranked number four among <strong>the</strong> 25<br />
OECD countries considered.<br />
A wealth of o<strong>the</strong>r <strong>in</strong>trigu<strong>in</strong>g <strong>and</strong> possibly significant <strong>in</strong>formation can be extracted<br />
from Table 1. 18 Thus, <strong>the</strong> United States apparently managed to "hold its rank" for all<br />
practical purposes between 1990 (137) <strong>and</strong> 1996 (135), as did Italy (100 <strong>in</strong> both<br />
years), but not Canada (with a fall from 114 to 110). Germany, on <strong>the</strong> o<strong>the</strong>r h<strong>and</strong>, appears<br />
to have ga<strong>in</strong>ed ground (from 99 to 103) despite <strong>the</strong> difficulties aris<strong>in</strong>g from its<br />
re-unification. 19 Regard<strong>in</strong>g <strong>the</strong> less-affluent OECD countries, it may be a matter of<br />
concern that if Portugal, Greece <strong>and</strong> especially Irel<strong>and</strong> managed to forge ahead<br />
(respectively from 59 to 67, 57 to 64, <strong>and</strong> 70 to 90), this was not <strong>the</strong> case for Mexico<br />
(36 to 35), Spa<strong>in</strong> (73 to 74) <strong>and</strong> Turkey (29 <strong>in</strong> both years). Curiously or not, Brita<strong>in</strong>’s<br />
thatcherite reforms did not prevent its slipp<strong>in</strong>g somewhat (from 98 to 95, mean<strong>in</strong>g<br />
that by 1996 it was hardly ahead of...Irel<strong>and</strong>). Similarly, New Zeal<strong>and</strong>’s much talkedabout<br />
reforms seem to have had practically no impact on its rank<strong>in</strong>g (which <strong>in</strong>creased<br />
but slightly, from a low 82 to a barely higher 84), although it could of course<br />
be argued that, absent <strong>the</strong>se reforms, it would have fallen back. Similarly, much has<br />
been made of <strong>the</strong> "Dutch model", but its impact does not seem to have been<br />
overwhelm<strong>in</strong>g, at least as far as per capita GDP goes, <strong>the</strong> Dutch <strong>in</strong>dex hav<strong>in</strong>g<br />
<strong>in</strong>creased but modestly from 98 to 102. Denmark, on <strong>the</strong> o<strong>the</strong>r h<strong>and</strong>, has attracted<br />
much less <strong>in</strong>ternational curiosity although it managed an impressive jump from 105<br />
to 118 (as did Norway, but for more down-to-earth - or "down-to-sea" - reasons, of<br />
course). Contrary to what may have been expected, Japan improved its relative<br />
st<strong>and</strong><strong>in</strong>g between 1990 <strong>and</strong> 1996 (from 110 to 117), as did - surpris<strong>in</strong>gly? - Belgium<br />
(from 103 to 108), Austria (also from 103 to 108) <strong>and</strong> Australia (from 99 to 103).<br />
F<strong>in</strong>ally, France’s <strong>in</strong>dex fell by almost as much as Switzerl<strong>and</strong>’s (ie. by 7 po<strong>in</strong>ts as<br />
compared to 9) while Sweden’s retreated by exactly as many po<strong>in</strong>ts as Switzerl<strong>and</strong>,<br />
but from a significantly lower <strong>in</strong>itial level, with <strong>the</strong> result that Sweden’s per capita<br />
GDP appears to be less, nowadays, than <strong>the</strong> OECD average.<br />
1.4 Compar<strong>in</strong>g <strong>the</strong> two views<br />
Compar<strong>in</strong>g <strong>the</strong> two views (national growth estimates vs. PPP results) may give some<br />
<strong>in</strong>dications about <strong>the</strong> extent to which national sources tend to underestimate - or possibly<br />
overestimate - real per capita growth <strong>in</strong> <strong>the</strong> countries considered.<br />
18 / Of course, <strong>the</strong> 1990-1996 changes <strong>in</strong> <strong>the</strong> various countries’ rank<strong>in</strong>g which will be po<strong>in</strong>ted out presently <strong>in</strong> this<br />
paragraph may be due <strong>in</strong> part to short-term country-specific cyclical <strong>in</strong>fluences (<strong>the</strong> national bus<strong>in</strong>ess cycles not<br />
be<strong>in</strong>g fully synchronized) ra<strong>the</strong>r than to longer-term "structural" factors.<br />
19 / Both figures (1990 <strong>and</strong> 1996) refer to re-unified Germany; see OECD (1999), p. 163.
11<br />
Table 2: GDP per Capita Indices Us<strong>in</strong>g Current PPPs (OECD=100) for 1996<br />
As orig<strong>in</strong>ally As obta<strong>in</strong>ed from<br />
published national real Difference<br />
by <strong>the</strong> OECD* growth factors<br />
A B (B-A)<br />
Canada 110 109 -1.1<br />
Mexico 35 35 -0.1<br />
United States 135 141 5.6<br />
Japan 117 114 -2.0<br />
Australia 103 107 3.7<br />
New Zeal<strong>and</strong> 84 84 0.2<br />
Austria 108 105 -2.3<br />
Belgium 108 104 -4.3<br />
Denmark 118 114 -4.2<br />
F<strong>in</strong>l<strong>and</strong> 92 93 0.6<br />
France 100 106 6.0<br />
Germany 103 97 -6.5<br />
Greece 64 57 -7.5<br />
Icel<strong>and</strong> 114 105 -9.5<br />
Irel<strong>and</strong> 90 94 4.2<br />
Italy 100 100 0.1<br />
Luxembourg 155 165 10.4<br />
Ne<strong>the</strong>rl<strong>and</strong>s 102 103 0.8<br />
Norway 124 126 1.5<br />
Portugal 67 63 -4.0<br />
Spa<strong>in</strong> 74 75 1.1<br />
Sweden 96 100 4.2<br />
Switzerl<strong>and</strong> 122 119 -2.9<br />
Turkey 29 31 1.7<br />
United K<strong>in</strong>gdom 95 99 4.4<br />
OECD 25 100 100 0.0<br />
OECD 25 (unweighted average) 97.8 97.8 0.0<br />
*See Table 1.<br />
Source: OECD-OCDE (1999), "National Accounts: Ma<strong>in</strong> Aggregates - 1960-1997, Volume 1 -<br />
Comptes nationaux : pr<strong>in</strong>cipaux agrégats", Paris, Part Seven, Comparative Tables Based on<br />
PPPs, Table 3, pp. 162-163.<br />
To that end, Table 2 was constructed <strong>in</strong> <strong>the</strong> follow<strong>in</strong>g manner. First, a 1996/1990 "growth<br />
factor" for real per capita GDP was calculated for each country from its own national<br />
accounts (as compiled <strong>and</strong> published by <strong>the</strong> OECD). Then, this factor was applied to each<br />
country’s 1990 GDP-per-capita PPP <strong>in</strong>dex as <strong>in</strong>dicated <strong>in</strong> Table 1. In <strong>the</strong> next step, <strong>the</strong><br />
result<strong>in</strong>g 1996 <strong>in</strong>dices were re-based so as to make <strong>the</strong>ir unweighted mean equal to <strong>the</strong><br />
unweighted mean of <strong>the</strong> 1996 PPP <strong>in</strong>dices (ie. 97.8). The f<strong>in</strong>al adjusted <strong>in</strong>dices are shown <strong>in</strong><br />
column B of Table 2. 20 The third column (B-A) is <strong>the</strong> difference between <strong>the</strong> 1996 rank<strong>in</strong>gs<br />
20 / The OECD country <strong>in</strong>dices are expressed on <strong>the</strong> basis of OECD=100. S<strong>in</strong>ce <strong>the</strong> latter average does not
12<br />
obta<strong>in</strong>ed from <strong>the</strong> adjusted national real growth factors (column B), on <strong>the</strong> one h<strong>and</strong>, <strong>and</strong> <strong>the</strong><br />
1996 PPP rank<strong>in</strong>gs (column A), on <strong>the</strong> o<strong>the</strong>r h<strong>and</strong>. A positive figure <strong>in</strong> this third column<br />
means that national statistics overestimate growth relative to <strong>the</strong> PPP results, <strong>and</strong> vice-versa<br />
for a negative figure.<br />
On <strong>the</strong> face of it, national sources would thus seem to overestimate per capita real growth -<br />
as compared to what <strong>the</strong> PPP surveys <strong>in</strong>dicate - <strong>in</strong> <strong>the</strong> follow<strong>in</strong>g countries, ranked <strong>in</strong><br />
decreas<strong>in</strong>g order: Luxembourg (by 10.4 po<strong>in</strong>ts over <strong>the</strong> 1990-1996 period), France (6.0<br />
po<strong>in</strong>ts), United States (5.6), United K<strong>in</strong>gdom (4.4), Irel<strong>and</strong> <strong>and</strong> Sweden (4.2), Australia (3.7),<br />
Turkey (1.7), Norway (1.5), Spa<strong>in</strong> (1.1), Ne<strong>the</strong>rl<strong>and</strong>s (0.8), F<strong>in</strong>l<strong>and</strong> (0.6), New Zeal<strong>and</strong> (0.2)<br />
<strong>and</strong> Italy (0.1).<br />
Conversely, <strong>the</strong> figures <strong>in</strong> column 3 of Table 2 po<strong>in</strong>t to per capita real growth be<strong>in</strong>g<br />
underestimated by <strong>the</strong> national accounts of <strong>the</strong> follow<strong>in</strong>g countries: Icel<strong>and</strong> (by 9.5 po<strong>in</strong>ts),<br />
Greece (7.5), Germany (6.5), 21 Belgium (4.3), Denmark (4.2), Portugal (4.0), Switzerl<strong>and</strong><br />
(2.9), Austria (2.3), Japan (2.0), Canada (1.1) <strong>and</strong> Mexico (0.1).<br />
These over- or underestimation factors must however be taken with a goodly p<strong>in</strong>ch of salt.<br />
For one th<strong>in</strong>g, <strong>the</strong> weight<strong>in</strong>g of each country’s GDP components does not stay constant <strong>in</strong> <strong>the</strong><br />
successive PPP surveys (or <strong>the</strong>n only by accident), although <strong>the</strong> weights are not likely to have<br />
changed much over a six-year period. Nei<strong>the</strong>r are <strong>the</strong>se weights necessarily <strong>the</strong> same as those<br />
used <strong>in</strong> <strong>the</strong> national accounts, be <strong>the</strong>y constant or not. This means that <strong>the</strong> national growth<br />
calculations <strong>and</strong> <strong>the</strong> PPP results are comparable to a limited extent only; or, alternatively,<br />
that at least part of <strong>the</strong> identified discrepancies can be expla<strong>in</strong>ed on <strong>the</strong>se grounds.<br />
For ano<strong>the</strong>r th<strong>in</strong>g, <strong>the</strong> PPP results should not necessarily be taken as <strong>the</strong> "revealed (growth)<br />
truth", as it were, for <strong>the</strong>y too may suffer from problems, distortions <strong>and</strong> sundry imprecisions<br />
of <strong>the</strong>ir own. More generally, it is perfectly possible that national sources could actually<br />
underestimate (or overestimate) growth <strong>in</strong> all countries, so that <strong>the</strong> figures <strong>in</strong> <strong>the</strong> third column<br />
of Table 2 would only <strong>in</strong>dicate <strong>the</strong> relative severity of <strong>the</strong> underestimation (overestimation)<br />
problem <strong>in</strong> <strong>the</strong> various countries. 22<br />
Be that as it may, <strong>the</strong> calculated discrepancies between national estimates <strong>and</strong> PPP results,<br />
which range from -9.5 to +10.4 po<strong>in</strong>ts over six years, 23 are never<strong>the</strong>less of a magnitude which<br />
suggests that <strong>the</strong>re is <strong>in</strong>deed - that <strong>the</strong>re must be - significant problems with measur<strong>in</strong>g real<br />
growth <strong>in</strong> <strong>the</strong> <strong>in</strong>dustrialized countries, problems which are likely to have become relatively<br />
acute <strong>in</strong> recent years for <strong>the</strong> reasons discussed earlier. Incidentally, this raises <strong>the</strong> question as<br />
to how <strong>the</strong>se data problems might affect econometric model-build<strong>in</strong>g when based on national<br />
<strong>in</strong>volve any country-specific weight<strong>in</strong>g (or, if one prefers, all countries’ per capita PPP GDPs have <strong>the</strong> same<br />
weight), <strong>the</strong> growth factors can be applied straightforwardly to <strong>the</strong> 1990 PPP figures, <strong>and</strong> all that is needed is to<br />
re-base <strong>the</strong> 1996 derived <strong>in</strong>dices so as to make <strong>the</strong>ir unweighted arithmetic average equal to that of <strong>the</strong> 1996 PPP<br />
<strong>in</strong>dices.<br />
21 / This result for Germany should however be taken with caution, because <strong>the</strong> German national accounts give<br />
real GDP for re-unified Germany from 1991 on only (no figure for 1990) whereas <strong>the</strong> data for West Germany<br />
stop <strong>in</strong> 1994. Consequently, <strong>the</strong> national real growth factor for (re-unified) Germany refers to <strong>the</strong> 1991-1996<br />
period, which means that real growth has been implicitly assumed to be zero between 1990 <strong>and</strong> 1991.<br />
22 / This follows from <strong>the</strong> way <strong>the</strong> second column of Table 2 was constructed - see above.<br />
23 / It is true that <strong>the</strong>se extreme values concern two very small economies, ie. Luxembourg (+10.4) <strong>and</strong> Icel<strong>and</strong> (-<br />
9.5), for which both national account<strong>in</strong>g <strong>and</strong> PPP calculations may run <strong>in</strong>to difficult specific problems l<strong>in</strong>ked to<br />
<strong>the</strong>ir size. (For example, it is known that <strong>the</strong> residents of Luxembourg do a lot of direct shopp<strong>in</strong>g across <strong>the</strong><br />
border; <strong>the</strong> question can be raised as to how this is h<strong>and</strong>led <strong>in</strong> both <strong>the</strong> Luxembourg national accounts <strong>and</strong> its<br />
PPP coverage). Exclud<strong>in</strong>g <strong>the</strong>se two very small economies, <strong>the</strong> largest discrepancies concern, on <strong>the</strong> one h<strong>and</strong>,<br />
France (+6.0), <strong>the</strong> United States (+5.6) <strong>and</strong> <strong>the</strong> United K<strong>in</strong>gdom (+4.4); <strong>and</strong> on <strong>the</strong> o<strong>the</strong>r h<strong>and</strong>, Greece (-7.5),<br />
Germany (-6.5) <strong>and</strong> Belgium (-4.3).
13<br />
time-series often cover<strong>in</strong>g several decades (ie. not just <strong>the</strong> <strong>1990s</strong>), no matter what form <strong>the</strong><br />
model-build<strong>in</strong>g efforts take (conventional structural models, VAR <strong>and</strong> o<strong>the</strong>r time-series<br />
models, computable-general-equilibrium models, etc.). 24<br />
1.5 An alternative approach ?<br />
Table 3: GDP per Capita Indices Us<strong>in</strong>g Current PPPs (OECD=100) for 1996<br />
As orig<strong>in</strong>ally As obta<strong>in</strong>ed from As obta<strong>in</strong>ed from As obta<strong>in</strong>ed from<br />
published national real national real national nom<strong>in</strong>al<br />
by <strong>the</strong> OECD* growth factors growth factors growth factors<br />
(rebased)<br />
A B C D<br />
Canada 110 109 109 104<br />
Mexico - - - -<br />
United States 135 141 140 140<br />
Japan 117 114 114 102<br />
Australia 103 107 106 102<br />
New Zeal<strong>and</strong> 84 84 84 80<br />
Austria 108 105 104 108<br />
Belgium 108 104 103 104<br />
Denmark 118 114 113 109<br />
F<strong>in</strong>l<strong>and</strong> 92 93 92 88<br />
France 100 106 105 103<br />
Germany - - - -<br />
Greece - - - -<br />
Icel<strong>and</strong> 114 105 104 110<br />
Irel<strong>and</strong> 90 94 93 91<br />
Italy 100 100 100 116<br />
Luxembourg 155 165 164 160<br />
Ne<strong>the</strong>rl<strong>and</strong>s 102 103 102 100<br />
Norway 124 126 125 120<br />
Portugal - - - -<br />
Spa<strong>in</strong> 74 75 74 86<br />
Sweden 96 100 99 103<br />
Switzerl<strong>and</strong> 122 119 118 117<br />
Turkey - - - -<br />
United K<strong>in</strong>gdom 95 99 98 105<br />
OECD 20 100 100 100 100<br />
OECD 20 (unweighted average) 107.4 108.2 107.4 107.4<br />
*See Table 1.<br />
Source: OECD-OCDE (1999), "National Accounts: Ma<strong>in</strong> Aggregates - 1960-1997, Volume 1 -<br />
Comptes nationaux : pr<strong>in</strong>cipaux agrégats", Paris, Part Seven, Comparative Tables Based on<br />
PPPs, Table 3, pp. 162-163, <strong>and</strong> Part Three, Ma<strong>in</strong> Aggregates: Countries, pp. 31-91.<br />
24 / To illustrate from our <strong>Swiss</strong> forecast<strong>in</strong>g experience: s<strong>in</strong>ce <strong>the</strong> early <strong>1990s</strong>, Créa's various econometric models<br />
have consistently tended to overestimate real growth as <strong>in</strong>dicated by <strong>the</strong> national accounts. The operators <strong>in</strong><br />
charge of <strong>the</strong>se models (<strong>the</strong> first author be<strong>in</strong>g one of <strong>the</strong>m) have often had <strong>the</strong> feel<strong>in</strong>g that <strong>the</strong>ir models' ex ante<br />
results were more realistic than <strong>the</strong> ex post official data. Maybe it was more than a feel<strong>in</strong>g.
14<br />
In view of all this, an alternative approach comes to m<strong>in</strong>d. Let us assume that all or at least<br />
most <strong>in</strong>dustrialized countries actually experienced approximately <strong>the</strong> same degree of <strong>in</strong>flation<br />
<strong>in</strong> <strong>the</strong> <strong>1990s</strong> because <strong>the</strong>y shared more or less <strong>the</strong> same macroeconomic environment <strong>and</strong> <strong>the</strong><br />
same policy objectives, particularly <strong>in</strong> Europe. Consider<strong>in</strong>g all <strong>the</strong> problems <strong>in</strong>volved <strong>in</strong><br />
estimat<strong>in</strong>g real variables such as per capita real GDP (see above), us<strong>in</strong>g nom<strong>in</strong>al variables -<br />
eg. per capita nom<strong>in</strong>al GDP - might conceivably yield a better <strong>in</strong>dication about <strong>the</strong> various<br />
countries’ relative growth performance. In o<strong>the</strong>r words, ignor<strong>in</strong>g <strong>the</strong> (presumably small)<br />
differences <strong>in</strong> underly<strong>in</strong>g <strong>in</strong>flation may conceivably mean smaller distortions than those<br />
aris<strong>in</strong>g from <strong>the</strong> various national practices <strong>in</strong> matters such as deflation <strong>and</strong> real productivity<br />
estimates.<br />
To verify this hypo<strong>the</strong>sis, we have elim<strong>in</strong>ated four OECD countries (Mexico, Greece,<br />
Portugal, Turkey) <strong>in</strong> which <strong>in</strong>flation dur<strong>in</strong>g <strong>the</strong> 1990-1996 period was clearly completely out<br />
of step with rest of <strong>the</strong> OECD. On top of that, we also had to discard Germany because no<br />
consistent official figures are available for nom<strong>in</strong>al per capita GDP <strong>in</strong> <strong>the</strong> 1990-1996 period. 25<br />
Apply<strong>in</strong>g <strong>the</strong> various national nom<strong>in</strong>al 1996/1990 growth factors to <strong>the</strong> 1990 PPP <strong>in</strong>dices<br />
for <strong>the</strong> rema<strong>in</strong><strong>in</strong>g 20 countries <strong>and</strong> re-bas<strong>in</strong>g <strong>the</strong> result<strong>in</strong>g <strong>in</strong>dices (just as has been done when<br />
us<strong>in</strong>g real growth factors) yields <strong>the</strong> figures <strong>in</strong> column D of Table 3.<br />
Compar<strong>in</strong>g columns C <strong>and</strong> D with column A, it is seen that for <strong>the</strong> follow<strong>in</strong>g seven<br />
countries <strong>the</strong> nom<strong>in</strong>al <strong>in</strong>dices (column D) are closer to <strong>the</strong> PPP results (column A) than <strong>the</strong><br />
real <strong>in</strong>dices (column C): Australia, Austria, Belgium, France, Icel<strong>and</strong>, Irel<strong>and</strong> <strong>and</strong><br />
Luxembourg. The opposite is however true for twelve of <strong>the</strong> rema<strong>in</strong><strong>in</strong>g countries while <strong>the</strong><br />
nom<strong>in</strong>al <strong>and</strong> <strong>the</strong> real approaches give exactly <strong>the</strong> same value for <strong>the</strong> United States.<br />
Generaliz<strong>in</strong>g, <strong>the</strong> simple correlation coefficient between column C <strong>and</strong> A is .975 while it is<br />
only .916 between column D <strong>and</strong> A. This means that <strong>the</strong> real approach yields results which<br />
are significantly closer to <strong>the</strong> PPP figures than is <strong>the</strong> case for <strong>the</strong> nom<strong>in</strong>al approach. In o<strong>the</strong>r<br />
words, all <strong>the</strong> national-level efforts that go <strong>in</strong>to calculat<strong>in</strong>g real variables such as real per<br />
capita GDP do not appear to be <strong>in</strong> va<strong>in</strong> (<strong>in</strong> <strong>the</strong> <strong>1990s</strong>) <strong>in</strong> spite of all <strong>the</strong> difficulties <strong>in</strong>volved.<br />
Had we found o<strong>the</strong>rwise, that would have been revolutionary <strong>in</strong>deed.<br />
1.6 Back to Switzerl<strong>and</strong><br />
But let us return to <strong>the</strong> case of Switzerl<strong>and</strong> <strong>and</strong> let it be assumed that <strong>the</strong> PPP results for that<br />
country are more reliable than <strong>the</strong> national real growth estimates, an assumption which at least<br />
<strong>the</strong> authors have no trouble accept<strong>in</strong>g. This would mean that real per capita growth has been<br />
underestimated by a total of about 3 <strong>in</strong>dex percentage po<strong>in</strong>ts over <strong>the</strong> 1990-1996 years,<br />
which translates <strong>in</strong>to an average annual growth rate of per capita GDP underestimated by<br />
somewhat less than 0.4 percentage po<strong>in</strong>ts. The correspond<strong>in</strong>g putative underestimation of <strong>the</strong><br />
average annual growth for total real GDP amounts to 0.1 percentage po<strong>in</strong>t. 26<br />
If this is correct, as we believe it is, <strong>the</strong> conclusion <strong>the</strong>n is that <strong>the</strong> <strong>Swiss</strong> economy has<br />
<strong>in</strong>deed been characterized by relatively slow growth <strong>in</strong> <strong>the</strong> <strong>1990s</strong> (ie. up to 1998 at least),<br />
although not as slow as <strong>in</strong>dicated by national data. In o<strong>the</strong>r words, "weak real growth" ra<strong>the</strong>r<br />
than outright "stagnation" is likely to have characterized <strong>the</strong> <strong>Swiss</strong> economy <strong>in</strong> <strong>the</strong> <strong>1990s</strong>.<br />
25 / See note 21 above.<br />
26 / It is noteworthy that this estimate (ie. an underestimation by 0.1 percentage po<strong>in</strong>t p.a.) is exactly <strong>the</strong> same as<br />
that found by Kohli, on average, for <strong>the</strong> years 1994-1996.
15<br />
1.7 Why this weak growth ? A few hypo<strong>the</strong>ses<br />
A first hypo<strong>the</strong>sis is <strong>the</strong> general convergence proposition: <strong>in</strong> a world that enjoys overall<br />
peace <strong>and</strong> where technological know-how <strong>and</strong> capital circulate fairly freely, it is to be expected<br />
that richer countries will tend to grow more slowly than poorer countries, <strong>and</strong> viceversa.<br />
This is of course a medium- to long-term proposition, but it is <strong>in</strong>terest<strong>in</strong>g that <strong>the</strong>re is<br />
some prima facie evidence <strong>in</strong> its favor even <strong>in</strong> <strong>the</strong> comparatively short 1990-1996 period. 27<br />
Therefore, weak(er) growth <strong>in</strong> Switzerl<strong>and</strong> could possibly be due, at least <strong>in</strong> part, to this<br />
general proposition. 28<br />
130<br />
Figure 5: <strong>Swiss</strong> Franc Real Effective Exchange Rate<br />
(weighted <strong>in</strong>dex for 15 major trade partners,<br />
November 1977=100, semi-log scale)<br />
120<br />
110<br />
100<br />
90<br />
80<br />
74 76 78 80 82 84 86 88 90 92 94 96 98<br />
Source: SNB.<br />
A second hypo<strong>the</strong>sis relates to <strong>Swiss</strong> monetary policy <strong>and</strong> its effect on <strong>the</strong> real exchange<br />
rate of <strong>the</strong> franc. As Figure 5 shows, Switzerl<strong>and</strong>’s currency went through a phase of very<br />
27 / Let X i be <strong>the</strong> ith country’s rank<strong>in</strong>g <strong>in</strong> 1990 <strong>and</strong> let Y i be its 1996 rank<strong>in</strong>g (see Table 1). Then, <strong>the</strong><br />
convergence proposition can be tested by means of <strong>the</strong> follow<strong>in</strong>g equation<br />
Y i = a + b*X i + e i ,<br />
with convergence correspond<strong>in</strong>g to E(a)>0 <strong>and</strong> E(b)
16<br />
strong real appreciation <strong>in</strong> 1993, 1994 <strong>and</strong> 1995, which <strong>in</strong> turn was surely due to a monetary<br />
policy stance that was overly restrictive. Whereas <strong>the</strong> Federal Reserve under Alan Greenspan<br />
knew or sensed that underly<strong>in</strong>g domestic economic conditions made it possible to pursue an<br />
expansive monetary policy <strong>in</strong> <strong>the</strong>se years without risk<strong>in</strong>g to rek<strong>in</strong>dle <strong>in</strong>flation, <strong>the</strong> <strong>Swiss</strong><br />
National Bank cont<strong>in</strong>ued s<strong>in</strong>gle-m<strong>in</strong>dedly to give exclusive priority to price stability. In h<strong>in</strong>dsight,<br />
this "overkill" feature of <strong>the</strong>ir policy is freely acknowledged today by <strong>the</strong> <strong>Swiss</strong><br />
monetary authorities. 29 It is recalled from Table 1 that Switzerl<strong>and</strong> managed to "hold its (PPP-<br />
GDP) rank" between 1990 <strong>and</strong> 1993, <strong>and</strong> that its fairly precipitous decl<strong>in</strong>e occurred between<br />
1993 <strong>and</strong> 1996. In our op<strong>in</strong>ion, that is a strong clue <strong>in</strong> favor of this second hypo<strong>the</strong>sis. Should<br />
<strong>the</strong> next OECD PPP survey, scheduled for 1999 (with results available around 2001), show an<br />
improvement <strong>in</strong> Switzerl<strong>and</strong>’s rank<strong>in</strong>g, with e.g. a climb-back to, say, around 128 (from 122<br />
<strong>in</strong> 1996), <strong>the</strong>n <strong>the</strong> case will become very strong that monetary policy was <strong>in</strong>deed <strong>the</strong> key<br />
element <strong>in</strong> <strong>the</strong> country’s 1993-1996 relative economic decl<strong>in</strong>e.<br />
A third hypo<strong>the</strong>sis, for which <strong>the</strong>re is some (<strong>in</strong> our view, fairly strong) evidence, 30 has to do<br />
with <strong>Swiss</strong> consumers’ dem<strong>and</strong>: for various reasons, <strong>the</strong> consumers’ "animal spirits" rema<strong>in</strong>ed<br />
<strong>in</strong>ord<strong>in</strong>ately depressed <strong>in</strong> those years, for an <strong>in</strong>ord<strong>in</strong>ately long time - mean<strong>in</strong>g that <strong>the</strong><br />
economy may have suffered from <strong>in</strong>sufficient aggregate dem<strong>and</strong> <strong>in</strong> <strong>the</strong> Keynesian sense. 31<br />
A fourth <strong>and</strong> f<strong>in</strong>al hypo<strong>the</strong>sis, stressed by <strong>the</strong> IMF among many o<strong>the</strong>rs, 32 refers to an<br />
<strong>in</strong>creas<strong>in</strong>g burden due to various structural rigidities, of which <strong>the</strong>re is surely no dearth <strong>in</strong><br />
<strong>the</strong> <strong>Swiss</strong> economy. It is however not clear that <strong>the</strong>se rigidities are - or have become - more<br />
pervasive <strong>and</strong>/or more weighty <strong>in</strong> Switzerl<strong>and</strong> than <strong>in</strong> (most of) <strong>the</strong> o<strong>the</strong>r <strong>in</strong>dustrialized countries.<br />
These four hypo<strong>the</strong>ses are not mutually exclusive. Probably all of <strong>the</strong>m played a part <strong>in</strong><br />
Switzerl<strong>and</strong>’s weak growth performance. What we do not know - what no one seems to know<br />
so far - is <strong>the</strong>ir relative importance <strong>in</strong> expla<strong>in</strong><strong>in</strong>g <strong>the</strong> slowdown of <strong>the</strong> <strong>Swiss</strong> economy <strong>in</strong> <strong>the</strong><br />
<strong>1990s</strong>. Although this is surely a crucial issue for <strong>Swiss</strong> economic policy <strong>and</strong> for <strong>the</strong> country at<br />
large, <strong>the</strong> only possible conclusion is <strong>the</strong>refore: more research is (urgently) needed...<br />
29 / Twice a year, <strong>the</strong> Créa Institute produces <strong>and</strong> publishes economic forecasts for Switzerl<strong>and</strong>, mean<strong>in</strong>g that<br />
<strong>the</strong>re were six forecast<strong>in</strong>g exercises <strong>in</strong> <strong>the</strong>se 1993-1995 years. For forecast<strong>in</strong>g purposes, <strong>the</strong> franc exchange rate<br />
is projected exogenously. It turned out subsequently that <strong>in</strong> each of <strong>the</strong>se six forecast<strong>in</strong>g exercises, <strong>the</strong> franc's<br />
appreciation had been underestimated, sometimes by a wide marg<strong>in</strong>. This was because <strong>the</strong> operators could not<br />
br<strong>in</strong>g <strong>the</strong>mselves to believe that <strong>the</strong> <strong>Swiss</strong> National Bank would allow <strong>the</strong> country's currency to go on<br />
appreciat<strong>in</strong>g <strong>in</strong> real terms so steadily <strong>and</strong> so strongly. Of course, this was ano<strong>the</strong>r reason why our forecasts<br />
turned out to have been systematically too "optimistic" <strong>in</strong> <strong>the</strong>se years.<br />
30 / See <strong>the</strong> follow<strong>in</strong>g sources: Manifesto by <strong>Swiss</strong> Economists, Lausanne, Créa Institute, January 1997; J.C.<br />
Lambelet, "Private Consumption: The New 'Animal Spirits'?", Analyses & Prévisions, Institut Créa, Fall 1996<br />
edition; J.M. Natal, "Switzerl<strong>and</strong>'s <strong>Economy</strong>: Why <strong>the</strong> 'Six-Year Stagnation'? Us<strong>in</strong>g a VAR Model as a<br />
Simulation <strong>and</strong> Forecast<strong>in</strong>g Tool", Analyses & Prévisions, Institut Créa, Fall 1997 edition. In a recent sem<strong>in</strong>al<br />
paper, J.P. Danth<strong>in</strong>e, J.B. Donaldson <strong>and</strong> T. Johnsen have shown, on a <strong>the</strong>oretical level, that a negative shock<br />
affect<strong>in</strong>g consumers' confidence could <strong>in</strong>stead result <strong>in</strong> stronger real growth, essentially because higher sav<strong>in</strong>g<br />
by consumers translates <strong>in</strong>to higher <strong>in</strong>vestment (see: "Productivity Growth, Consumer Confidence <strong>and</strong> <strong>the</strong><br />
Bus<strong>in</strong>ess Cycle", European Economic Review, 1998/42, 1113-1140); <strong>the</strong>ir model however concerns a closed<br />
economy; <strong>in</strong> a small open economy like Switzerl<strong>and</strong>'s, higher sav<strong>in</strong>g by consumers may largely take <strong>the</strong> form of<br />
<strong>in</strong>creased <strong>in</strong>vestment abroad, with no or little effect on domestic <strong>in</strong>vestment.<br />
31 / On top of this, it is possible <strong>and</strong> even likely that <strong>Swiss</strong> fiscal policy (or ra<strong>the</strong>r policies) also tended to be too<br />
restrictive <strong>in</strong> those years.<br />
32 / See for example: Ketil Hvid<strong>in</strong>g, Switzerl<strong>and</strong>’s Long-Run Growth Slowdown, Wash<strong>in</strong>gton, IMF, n.d.
17<br />
2. Fabulously rich Switzerl<strong>and</strong>...<br />
It was noted above that, <strong>in</strong> spite of <strong>the</strong> 1993-1996 slowdown, Switzerl<strong>and</strong>’s 1996 per capita<br />
GDP rema<strong>in</strong>ed on <strong>the</strong> high side <strong>in</strong> <strong>in</strong>ternational (PPP) comparison, <strong>the</strong> country rank<strong>in</strong>g fourth<br />
among 25 OECD member countries.<br />
2.1 Why so rich ?<br />
This of course raises <strong>the</strong> question as to why Switzerl<strong>and</strong> is or appears to be relatively rich.<br />
<strong>Is</strong> this due to consistently low <strong>in</strong>terest rates, a high overall sav<strong>in</strong>g rate, a surfeit of capital <strong>and</strong><br />
hence a fairly high <strong>in</strong>vestment level? And/or to a set of very efficient export <strong>in</strong>dustries<br />
(<strong>in</strong>clud<strong>in</strong>g services such as bank<strong>in</strong>g <strong>and</strong> <strong>in</strong>surance)? And/or to <strong>the</strong> <strong>Swiss</strong> economy be<strong>in</strong>g very<br />
much an open one, at least <strong>in</strong>sofar as trade is concerned? And/or, possibly, to <strong>the</strong> virtues of a<br />
(hypo<strong>the</strong>tical) "<strong>Swiss</strong> model", mean<strong>in</strong>g th<strong>in</strong>gs such as political stability; strong work ethics;<br />
private <strong>and</strong> corporate <strong>in</strong>come tax rates (both average <strong>and</strong> marg<strong>in</strong>al) which rema<strong>in</strong> on <strong>the</strong> low<br />
side <strong>in</strong> <strong>in</strong>ternational comparison; a sizable stock of high-quality human capital, particularly<br />
because of an apprenticeship system emphasiz<strong>in</strong>g on-<strong>the</strong>-job tra<strong>in</strong><strong>in</strong>g; fairly efficient public<br />
adm<strong>in</strong>istrations; comparatively little corruption; a relatively flexible labor market<br />
characterized by decentralized wage-barga<strong>in</strong><strong>in</strong>g, general labor-management cooperation <strong>and</strong><br />
very little strike activity? Etc.<br />
In <strong>the</strong> follow<strong>in</strong>g, it will be argued that <strong>the</strong> ma<strong>in</strong> explanation could very well be ra<strong>the</strong>r more<br />
down-to-earth. Putt<strong>in</strong>g it <strong>in</strong> a nutshell <strong>and</strong> somewhat bluntly: it appears that <strong>the</strong> ma<strong>in</strong> reason<br />
why <strong>the</strong> country seems to be relatively rich <strong>in</strong> <strong>in</strong>ternational comparison - ie. why it has a high<br />
per capita GDP - is that many people work <strong>in</strong> Switzerl<strong>and</strong>, <strong>and</strong> those who do tend to work a<br />
lot (ceteris paribus).<br />
2.2 Participation rates<br />
Look<strong>in</strong>g at <strong>the</strong> first column of Table 4, it is seen that Switzerl<strong>and</strong> had, <strong>in</strong> 1996, <strong>the</strong> highest<br />
overall labor force participation rate (55.4%) among 25 OECD countries, followed by<br />
Icel<strong>and</strong> (54.8%), Denmark (53.6%), Japan (53.3%) <strong>and</strong> Luxembourg (52.9%). It should be<br />
noted that <strong>the</strong>se percentages are calculated as <strong>the</strong> total number of employed <strong>and</strong> unemployed<br />
divided by total resident population, where each person employed is counted as one unit no<br />
matter whe<strong>the</strong>r she/he has a full-time job or a part-time one.<br />
Calculat<strong>in</strong>g <strong>the</strong> participation rate as <strong>the</strong> ratio of persons employed - def<strong>in</strong>ed as above - <strong>and</strong><br />
unemployed to <strong>the</strong> population of work<strong>in</strong>g age (second column of Table 4), <strong>the</strong> 1996 <strong>Swiss</strong><br />
participation rate rema<strong>in</strong>s high (76.4% vs. an EU average of 67.6%), but not as high as that of<br />
Icel<strong>and</strong> (83.5%), Denmark (79.5%), Norway (79.2%), Sweden (77.8%) <strong>and</strong> <strong>the</strong> United States<br />
(77.1%). The difference is largely due to <strong>the</strong> age structure of <strong>the</strong> population, <strong>the</strong>re be<strong>in</strong>g<br />
comparatively fewer young people <strong>in</strong> Switzerl<strong>and</strong>. Fur<strong>the</strong>rmore, <strong>the</strong> first column is <strong>the</strong> more<br />
relevant one <strong>in</strong> <strong>the</strong> present context because GDP per capita is <strong>the</strong> "affluence <strong>in</strong>dicator"<br />
generally used, ie. GDP divided by total population.<br />
2.3 Hours worked "normally"<br />
Regard<strong>in</strong>g <strong>the</strong> second proposition (<strong>Swiss</strong> residents who work tend to work a lot), <strong>the</strong> third<br />
column of Table 4 shows that among <strong>the</strong> 16 countries for which such data exist, <strong>the</strong> number<br />
of "hours normally worked per week by a full-time employee" is <strong>the</strong> second highest <strong>in</strong><br />
Switzerl<strong>and</strong> (42.1 hours per week), after <strong>the</strong> United K<strong>in</strong>gdom (43.9 hours).
18<br />
Table 4: Labour Force Participation <strong>and</strong> Normal Weekly Hours - International Comparison, 1996<br />
Labour force participation rate<br />
Hours normally<br />
% of total % of work<strong>in</strong>g-age worked per week<br />
population population by full-time employees<br />
Canada 50.8 74.8 n.a.<br />
Mexico* 36.2 61.9 n.a.<br />
United States 50.9 77.1 n.a.<br />
Japan 53.3 72.0 n.a.<br />
Australia 50.2 73.7 n.a.<br />
New Zeal<strong>and</strong> 49.4 75.7 n.a.<br />
Austria** 48.3 71.1 40.0<br />
Belgium*** 42.4 62.2 38.3<br />
Denmark 53.6 79.5 38.7<br />
F<strong>in</strong>l<strong>and</strong> 49.4 73.7 38.7<br />
France 43.9 67.4 39.8<br />
Germany 48.0 70.8 40.0<br />
Greece* 40.6 61.0 40.4<br />
Icel<strong>and</strong> 54.8 83.5 n.a.<br />
Irel<strong>and</strong> 41.3 62.3 40.4<br />
Italy** 40.6 57.7 38.6<br />
Luxembourg* 52.9 61.1 39.5<br />
Ne<strong>the</strong>rl<strong>and</strong>s 48.5 69.9 39.4<br />
Norway 51.4 79.2 n.a.<br />
Portugal 49.2 67.5 41.2<br />
Spa<strong>in</strong> 41.1 61.3 40.6<br />
Sweden 48.4 77.8 40.0<br />
Switzerl<strong>and</strong>* 55.4 76.4 42.1<br />
Turkey 36.3 56.0 n.a.<br />
United K<strong>in</strong>gdom 48.6 76.1 43.9<br />
EU 15 41.9 67.6 40.4<br />
* Data for 1995 <strong>in</strong> <strong>the</strong> first column.<br />
** Data for 1994 <strong>in</strong> <strong>the</strong> first column.<br />
*** Data for 1993 <strong>in</strong> <strong>the</strong> first column.<br />
Sources: OECD-OCDE (1997), "Labour Force Statistics - 1976-1996 - Statistiques de la population<br />
active", Paris, Table 3.0, pp. 24-25, for <strong>the</strong> first column; OCDE (1998), "Perspectives de l’emploi,<br />
ju<strong>in</strong> 1998", Paris, Tableau B <strong>in</strong> "Annexe statistique", p. 209, for <strong>the</strong> second column; OFS (1999),<br />
"Annuaire statistique de la Suisse", Zürich, Table 3.12, p. 115, for <strong>the</strong> third column.<br />
These data are however not sufficient to answer <strong>the</strong> question as to what extent Switzerl<strong>and</strong><br />
owes its fabled affluence to <strong>the</strong> amount of work put <strong>in</strong> by its people (or possibly to o<strong>the</strong>r factors).<br />
In particular, what about <strong>the</strong> hours worked by <strong>the</strong> self-employed <strong>and</strong> by people with<br />
part-time jobs? All <strong>the</strong> more so than <strong>the</strong> relative importance of both categories, <strong>and</strong> especially<br />
<strong>the</strong> second one, varies quite substantially across countries. For example, it is known that <strong>the</strong><br />
proportion of part-time jobs is or has become unusually high <strong>in</strong> several countries, Switzerl<strong>and</strong><br />
be<strong>in</strong>g one of <strong>the</strong>m. Incidentally, this does not necessarily mean that <strong>the</strong> labor market is<br />
malfunction<strong>in</strong>g, <strong>in</strong> <strong>the</strong> sense that all part-time jobs should be considered as second-class<br />
precarious occupations; for <strong>the</strong>re is good evidence to <strong>the</strong> effect that <strong>the</strong>se jobs are <strong>in</strong> fact often<br />
much sought-after, especially by (married) women.
19<br />
2.4 The gr<strong>and</strong> total of hours worked per year<br />
All this suggests that a better <strong>in</strong>dicator would be, quite simply, GDP per hour worked;<br />
mean<strong>in</strong>g each country’s GDP - put on a comparable basis with <strong>the</strong> help of PPP exchange rates<br />
- divided by <strong>the</strong> gr<strong>and</strong> total of hours worked per year. Note that this will also make<br />
allowance for vacations <strong>and</strong> official holidays, s<strong>in</strong>ce vacation length <strong>and</strong> <strong>the</strong> number of official<br />
holidays per year vary significantly across countries. (For example, vacations tend to be<br />
especially long <strong>in</strong> France <strong>and</strong> short <strong>in</strong> <strong>the</strong> USA while <strong>the</strong> number of official holidays is<br />
especially small <strong>in</strong> Switzerl<strong>and</strong>).<br />
The idea is simple, but its implementation turns out to be ra<strong>the</strong>r arduous on account of <strong>the</strong><br />
available data. The follow<strong>in</strong>g results should <strong>the</strong>refore be taken with great caution <strong>and</strong> as a first<br />
approximation only.<br />
A direct estimation of <strong>the</strong> gr<strong>and</strong> total of hours worked <strong>in</strong> 1996 is available - so far as we<br />
have been able to determ<strong>in</strong>e - for four countries only: F<strong>in</strong>l<strong>and</strong>, Germany, Norway <strong>and</strong><br />
Switzerl<strong>and</strong>. In <strong>the</strong> latter case, this gr<strong>and</strong> number (ie. 6’555 million hours) is an extrapolation<br />
based on a sample survey ("micro-census"). 33 Given that <strong>the</strong> sample is made up of no less<br />
than 16’200 persons, 34 this extrapolation would appear fairly reliable.<br />
As to <strong>the</strong> o<strong>the</strong>r countries for which usable data exist (ie. 12 o<strong>the</strong>r OECD countries, <strong>the</strong>re<br />
be<strong>in</strong>g no usable data for 9 countries), <strong>the</strong> gr<strong>and</strong> total of hours worked <strong>in</strong> 1996 was obta<strong>in</strong>ed<br />
<strong>in</strong>directly by multiply<strong>in</strong>g average annual hours worked by <strong>the</strong> average annual number of<br />
persons employed, where care was taken to select consistent series, or as consistent as<br />
possible. This <strong>in</strong>direct approach is however fraught with statistical difficulties of all sorts <strong>and</strong><br />
<strong>the</strong> result<strong>in</strong>g gr<strong>and</strong> totals should be taken with caution, about which more <strong>in</strong> a moment. 35<br />
2.5 GDP per capita, per person employed <strong>and</strong> per hour worked<br />
Column 6 <strong>in</strong> Table 5 <strong>in</strong>dicates <strong>the</strong> <strong>in</strong>dices for GDP at PPP per hour worked for <strong>the</strong> 16<br />
countries concerned whereas column 4 gives <strong>the</strong> <strong>in</strong>dices for GDP at PPP per person<br />
employed, both series hav<strong>in</strong>g been re-based <strong>in</strong> <strong>the</strong> same manner as previously. These two<br />
columns may <strong>the</strong>n be compared with column 2, ie. <strong>the</strong> <strong>in</strong>dices for GDP at PPP per capita as<br />
discussed earlier. 36<br />
33 / See: Enquête suisse sur la population active (ESPA), Office fédéral de la statistique, Berne.<br />
34 / Out of a labor force of somewhat less than 4 million. Data for 1998.<br />
35 / The ILO is currently engaged <strong>in</strong> an effort to ga<strong>the</strong>r data on total hours worked per year, <strong>the</strong> results of which<br />
should become available (for a limited number of countries) <strong>in</strong> <strong>the</strong> course of <strong>the</strong> current year. - This ILO study<br />
has <strong>in</strong>deed been published - <strong>in</strong> early September - s<strong>in</strong>ce this paper was written (Key Indicators of <strong>the</strong> Labour<br />
Market, ILO, Geneva). Although it was ordered at <strong>the</strong> time of publication, we were still wait<strong>in</strong>g for it <strong>in</strong> late<br />
October...<br />
36 / As far as we know, <strong>the</strong> first time anyone tried to compute GDP at PPP per person employed <strong>and</strong> per hour<br />
worked was <strong>in</strong> an OECD work<strong>in</strong>g paper by Dirk Pilat (Labour Productivity Levels <strong>in</strong> OECD: Estimates for<br />
Manufactur<strong>in</strong>g <strong>and</strong> Selected Service Sectors, September 1996). His relevant table is reproduced <strong>in</strong> an APPEN-<br />
DIX to <strong>the</strong> present paper, toge<strong>the</strong>r with <strong>the</strong> raw data underly<strong>in</strong>g Table 5. There are significant discrepancies (ie.<br />
by more than 5 po<strong>in</strong>ts) between his 1994 GDP-per-person-employed <strong>in</strong>dices <strong>and</strong> our 1996 <strong>in</strong>dices for <strong>the</strong><br />
follow<strong>in</strong>g four countries (out of 25): Japan, Greece, Irel<strong>and</strong> <strong>and</strong> <strong>the</strong> Ne<strong>the</strong>rl<strong>and</strong>s; <strong>the</strong> simple correlation<br />
coefficient between <strong>the</strong> two series is 0.982 (n=25). In <strong>the</strong> case of GDP-per-hour-worked, as <strong>the</strong> reader may<br />
check, significant discrepancies are present for <strong>the</strong> follow<strong>in</strong>g seven countries (out of 16): USA, Japan, New<br />
Zeal<strong>and</strong>, Germany, Norway, Spa<strong>in</strong> <strong>and</strong> Sweden; <strong>the</strong> correspond<strong>in</strong>g simple correlation coefficient is 0.938<br />
(n=16). It may be, given <strong>the</strong> sources used by Dirk Pilat for total hours worked (see bottom of his table), that our<br />
<strong>in</strong>dices are more precise <strong>and</strong> up-to-date.
20<br />
Table 5: Real GDP per Capita <strong>and</strong> Labour Productivity Measures - International Comparison, 1996*<br />
GDP at PPP GDP at PPP GDP at PPP GDP at PPP GDP at PPP GDP at PPP<br />
per capita per capita per person per person per hour per hour<br />
employed employed worked worked<br />
USD OECD=100 USD OECD=100 USD OECD=100<br />
(1) (2) (3) (4) (5) (6)<br />
Canada 22735 110 49585 106 28.6 109<br />
Mexico 7181 35 20401 44 10.4 40<br />
United States 27831 135 57741 124 29.6 113<br />
Japan 23980 117 46534 100 24.6 94<br />
Australia 21223 103 46256 99 24.8 94<br />
New Zeal<strong>and</strong> 17345 84 37972 81 20.7 79<br />
F<strong>in</strong>l<strong>and</strong> 19030 92 45926 98 27.2 104<br />
France 20520 100 53352 114 32.0 122<br />
Germany 21221 103 48595 104 32.0 122<br />
Icel<strong>and</strong> 23533 114 44366 95 23.9 91<br />
Norway 25547 124 52363 112 36.8 140<br />
Portugal 13816 67 30252 65 15.1 57<br />
Spa<strong>in</strong> 15183 74 47254 101 26.1 99<br />
Sweden 19730 96 44007 94 28.3 108<br />
Switzerl<strong>and</strong> 25015 122 46899 100 27.1 103<br />
United K<strong>in</strong>gdom 19521 95 43783 94 25.3 96<br />
OECD 25 20576 100 47337 100 - -<br />
OECD 25 (unweighted avg) 20134 97.8 45700 97.8 - -<br />
OECD 16 (unweighted avg) 20213 98.2 44705 95.7 25.8 98.2<br />
*Raw data on total GDP at PPP, population, employment <strong>and</strong> total hours worked are provided <strong>in</strong> Table A1 <strong>in</strong> <strong>the</strong> Appendix.<br />
Sources: OECD-OCDE (1999), "National Accounts: Ma<strong>in</strong> Aggregates - 1960-1997, Volume 1 -<br />
Comptes nationaux : pr<strong>in</strong>cipaux agrégats", Paris; OECD-OCDE (1997), "Labour Force Statistics -<br />
1976-1996 - statistiques de la population active", Paris; OCDE (1998), "Perspectives de l'emploi,<br />
ju<strong>in</strong> 1998", Paris; OFS (1999), "Annuaire statistique de la Suisse", Zürich; direct <strong>in</strong>formation from<br />
<strong>the</strong> statistical offices of F<strong>in</strong>l<strong>and</strong>, Germany, Norway <strong>and</strong> Switzerl<strong>and</strong> on total hours worked. Authors'<br />
calculations <strong>in</strong> <strong>the</strong> last four columns.<br />
For most countries, <strong>the</strong> three rank<strong>in</strong>g <strong>in</strong>dices differ considerably, <strong>the</strong> United K<strong>in</strong>gdom be<strong>in</strong>g<br />
one exception (with 95 for GDP per capita, 94 for GDP per person employed <strong>and</strong> 96 for GDP<br />
per hour worked) toge<strong>the</strong>r with Canada (110, 106, 109). Several countries experience a steady<br />
fall <strong>in</strong> rank<strong>in</strong>g as one moves from GDP per capita to GDP per person employed to GDP per<br />
hour worked - thus <strong>the</strong> United States (135, 124, 113), Japan (117, 100, 94), Australia (103, 99,<br />
94), New Zeal<strong>and</strong> (84, 81, 79), Icel<strong>and</strong> (114, 95, 91) <strong>and</strong> Portugal (67, 65, 57).<br />
The reverse, ie. an <strong>in</strong>crease <strong>in</strong> rank<strong>in</strong>g, obta<strong>in</strong>s for F<strong>in</strong>l<strong>and</strong> (92, 98, 104), France (100, 114,<br />
122) <strong>and</strong> Germany (103, 104, 122). F<strong>in</strong>ally, <strong>the</strong> results are mixed for Mexico (35, 44, 40),<br />
Norway (124, 112, 140), Sweden (96, 94, 108) <strong>and</strong> Switzerl<strong>and</strong> (122, 100, 103).<br />
The cases of France <strong>and</strong> Germany are particularly strik<strong>in</strong>g. Whereas <strong>the</strong>ir 1996 per capita<br />
GDP is about average (100 <strong>and</strong> 103), <strong>the</strong>y have <strong>the</strong> highest GDP per hour worked among <strong>the</strong><br />
16 OECD countries considered (122 <strong>in</strong> both cases, ie. more than <strong>the</strong> US which comes <strong>in</strong> at<br />
113), if one excepts <strong>the</strong> special case of Norway (140). 37 One possible explanation is that high<br />
37 / To put it ra<strong>the</strong>r sweep<strong>in</strong>gly: if an hour worked means turn<strong>in</strong>g an oil well’s tap on <strong>and</strong> off, that hour of work
21<br />
labor costs <strong>in</strong> France <strong>and</strong> Germany (<strong>in</strong>clud<strong>in</strong>g all social levies as well as <strong>in</strong>direct costs such as<br />
those connected with hir<strong>in</strong>g <strong>and</strong> fir<strong>in</strong>g) have resulted <strong>in</strong> capital be<strong>in</strong>g substituted for labor on a<br />
massive scale. It is possible that <strong>the</strong>se high labor costs have also brought about a high<br />
"<strong>in</strong>tensity level" of <strong>the</strong> work effort.<br />
If this is so, it would mean - somewhat ironically or sadly - that once a resident has<br />
managed to break <strong>in</strong>to France’s or Germany’s "magical circle" made up of those who have a<br />
job (<strong>the</strong> "<strong>in</strong>siders"), that person will f<strong>in</strong>d herself/himself not only surrounded (burdened?) by a<br />
lot of productive equipment, but she/he may also have to work very hard. As a result, that person<br />
may <strong>the</strong>n - underst<strong>and</strong>ably - start yearn<strong>in</strong>g for as short a work-week <strong>and</strong> as long an annual<br />
vacation period as possible, while also - just as underst<strong>and</strong>ably - long<strong>in</strong>g for (early) retirement...<br />
2.6 Back to Switzerl<strong>and</strong><br />
Table 5 confirms <strong>the</strong> hypo<strong>the</strong>sis or suspicion that Switzerl<strong>and</strong>’s high per capita GDP is<br />
largely <strong>the</strong> result of a high <strong>in</strong>put of labor: per person employed, <strong>the</strong> <strong>Swiss</strong> <strong>in</strong>dex is exactly<br />
equal to <strong>the</strong> OECD average (100) <strong>and</strong> <strong>the</strong> country ranks hardly higher on <strong>the</strong> output-per-hourworked<br />
scale (103).<br />
Before draw<strong>in</strong>g some conclusions from <strong>the</strong>se f<strong>in</strong>d<strong>in</strong>gs, a fur<strong>the</strong>r word of caution is<br />
necessary. The <strong>in</strong>dices for GDP per person employed <strong>and</strong> per hour worked rest on ra<strong>the</strong>r<br />
shaky statistical foundations <strong>and</strong> <strong>the</strong>y are <strong>the</strong>refore ra<strong>the</strong>r fragile. To illustrate just how<br />
fragile, here are <strong>the</strong> GDP-per-hour-worked <strong>in</strong>dices for <strong>the</strong> four countries for which <strong>the</strong>re are<br />
direct estimates for <strong>the</strong> gr<strong>and</strong> total of hours worked, but for which this gr<strong>and</strong> total can also be<br />
calculated <strong>in</strong>directly <strong>in</strong> <strong>the</strong> same manner as for <strong>the</strong> o<strong>the</strong>r 12 countries:<br />
___________________________________________________________________________<br />
1996 GDP at PPP per hour worked (OECD=100) us<strong>in</strong>g<br />
Direct estimates Indirect estimates<br />
F<strong>in</strong>l<strong>and</strong> 103 97<br />
Germany 122 117<br />
Norway 140 141<br />
Switzerl<strong>and</strong> 103 112<br />
___________________________________________________________________________<br />
As it happens, <strong>the</strong> difference is largest <strong>in</strong> <strong>the</strong> case of Switzerl<strong>and</strong>. This is probably because<br />
<strong>the</strong> direct estimate of total hours worked is more encompass<strong>in</strong>g, <strong>in</strong> <strong>the</strong> case of Switzerl<strong>and</strong>,<br />
than <strong>the</strong> data underly<strong>in</strong>g <strong>the</strong> <strong>in</strong>direct estimate.<br />
Our own feel<strong>in</strong>g - for what it’s worth - is that Switzerl<strong>and</strong> will probably come <strong>in</strong> at a level<br />
higher than 103 (but not necessarily as high as 112) if <strong>and</strong> when comparable figures for total<br />
hours works become available for a larger number of countries.<br />
Be that as it may, one f<strong>in</strong>d<strong>in</strong>g about Switzerl<strong>and</strong> seems quite robust. Ie. its oh-so-high<br />
<strong>in</strong>come or, if one prefers, its fabled affluence is noth<strong>in</strong>g but a myth if due account is taken of<br />
<strong>the</strong> amount of work put <strong>in</strong> by its people. In o<strong>the</strong>r words, <strong>the</strong>re is wealth <strong>and</strong> wealth: a high<br />
will of course be highly "productive", given <strong>the</strong> way productivity is def<strong>in</strong>ed here (ie. real value added divided by<br />
work hours).
22<br />
<strong>in</strong>come due to effort <strong>and</strong> diligence is one th<strong>in</strong>g; a high <strong>in</strong>come due to nature’s bounty - be it<br />
oil, o<strong>the</strong>r natural resources, climate or whatever - is quite ano<strong>the</strong>r th<strong>in</strong>g.<br />
2.7 The lessons<br />
Widely-believed <strong>and</strong> firmly-entrenched myths generally carry a price. Here are three<br />
examples of what its reputation as a wealthy country has (or might still) cost Switzerl<strong>and</strong>.<br />
x The global settlement extracted last summer from <strong>the</strong> <strong>Swiss</strong> banks <strong>in</strong> <strong>the</strong> dormant accounts’<br />
affair. As one knows, <strong>the</strong> price tag for that settlement amounts to 1.25 billion dollars, not<br />
count<strong>in</strong>g <strong>the</strong> very high costs of various search efforts or <strong>the</strong> "voluntary" contributions to<br />
sundry funds. There are many reasons why <strong>the</strong> <strong>Swiss</strong> banks f<strong>in</strong>ally caved <strong>in</strong>: 38 above all, <strong>the</strong><br />
fact that <strong>the</strong>ir important, nay, vital stake <strong>in</strong> <strong>the</strong> American bank<strong>in</strong>g-f<strong>in</strong>ancial bus<strong>in</strong>ess meant<br />
that <strong>the</strong>y were highly vulnerable <strong>the</strong>re (threatened boycotts, etc.) <strong>and</strong> could be made hostage<br />
to <strong>the</strong> U.S. legal system; <strong>the</strong> possibility - however far from certa<strong>in</strong> - that <strong>the</strong>ir past search<br />
efforts were not as thorough as <strong>the</strong>y should have been; a weak "<strong>in</strong>ternal front" <strong>in</strong> Switzerl<strong>and</strong><br />
itself on account of <strong>the</strong> authorities’ timidity - to call it that - <strong>in</strong> fend<strong>in</strong>g off <strong>the</strong> assault as well<br />
as <strong>the</strong> <strong>in</strong>security created by a large fraction of <strong>the</strong> national media <strong>and</strong> by left-lean<strong>in</strong>g<br />
revisionist historians; a wide-spread propensity to guilt feel<strong>in</strong>gs; etc. However, ano<strong>the</strong>r factor<br />
surely expla<strong>in</strong>s why Switzerl<strong>and</strong> <strong>and</strong> <strong>the</strong> <strong>Swiss</strong> banks were s<strong>in</strong>gled out as <strong>the</strong> first target <strong>in</strong><br />
what looks more <strong>and</strong> more like a general campaign aga<strong>in</strong>st European <strong>in</strong>terests, ie. precisely<br />
<strong>the</strong> country’s reputed affluence.<br />
x As was recently publicized, membership <strong>in</strong> <strong>the</strong> EU would cost Switzerl<strong>and</strong> someth<strong>in</strong>g like<br />
3 billion francs per year on a net basis. This high figure is partly due to <strong>the</strong> fact that <strong>the</strong><br />
contributions to <strong>the</strong> EU budget depend on <strong>the</strong> level of per capita GDP at PPP, without any<br />
consideration given to per capita labor <strong>in</strong>put.<br />
x Expressed per 1’000 residents, Switzerl<strong>and</strong> gave shelter to 5.75 asylum seekers <strong>in</strong> 1998, <strong>the</strong><br />
highest figure by far <strong>in</strong> all of Europe (<strong>the</strong> average for Europe 39 comes <strong>in</strong> at 0.91). In absolute<br />
numbers, <strong>the</strong>re were 41’200 asylum seekers <strong>in</strong> Switzerl<strong>and</strong> <strong>in</strong> 1998 as aga<strong>in</strong>st 98’700 <strong>in</strong><br />
Germany whose population is more than ten times larger. 40 The <strong>Swiss</strong> national media have<br />
seen to it that <strong>the</strong>se facts are largely unknown to <strong>the</strong> <strong>Swiss</strong> public <strong>and</strong> <strong>the</strong> myth has been<br />
implanted <strong>in</strong>stead that Switzerl<strong>and</strong> is quite niggardly <strong>and</strong> unsympa<strong>the</strong>tic when it comes to<br />
accept<strong>in</strong>g asylum seekers. When <strong>the</strong> facts are never<strong>the</strong>less po<strong>in</strong>ted out, eg. on <strong>the</strong> occasion of<br />
a public debate, <strong>the</strong> parry is apt to be that "Oh yes, this is true, but <strong>the</strong>n Switzerl<strong>and</strong> is so<br />
much richer than <strong>the</strong> o<strong>the</strong>r European countries..."<br />
Under <strong>the</strong>se circumstances, every effort should be undertaken to uproot <strong>the</strong> myth of<br />
Switzerl<strong>and</strong>’s fabulous wealth - abroad <strong>and</strong>, just as much, at home. In o<strong>the</strong>r words, every<br />
occasion, rang<strong>in</strong>g from public utterances by <strong>the</strong> authorities to private conversations, should be<br />
used to set <strong>the</strong> record straight <strong>and</strong> drive <strong>the</strong> po<strong>in</strong>t home.<br />
____________________________<br />
38 / See: J.C. Lambelet, Le mobb<strong>in</strong>g d’un petit pays - Onze thèses sur la Suisse pendant la Deuxième Guerre<br />
mondiale, Lausanne, éditions L'Age d'Homme, 1999, especially chapter 8.<br />
39 / Ie. for <strong>the</strong> EU countries, Norway <strong>and</strong> Switzerl<strong>and</strong>.<br />
40 / See a table <strong>in</strong> The Economist, Feb. 20, 1999; it should be added that <strong>the</strong> relative orders of magnitude are <strong>the</strong><br />
same for duly accepted refugees.
23<br />
A P P E N D I X<br />
Table A1: Basic Labour Productivity Related Statistics - International Comparison, 1996<br />
Total GDP Population Total employment Total annual<br />
at 1996 prices mid-year estimate hours worked<br />
<strong>and</strong> 1996 PPPs<br />
(billions of USD) (thous<strong>and</strong>s) (thous<strong>and</strong>s) (millions)<br />
Canada 681.3 29969 13740 23798<br />
Mexico* 660.7 92007 32385 63313<br />
United States 7390.6 265557 127996 249720<br />
Japan 3018.2 125864 64860 122521<br />
Australia 388.6 18311 8401 15685<br />
New Zeal<strong>and</strong> 64.4 3714 1696 3117<br />
Austria** 178.3 8059 3737 n.a.<br />
Belgium*** 225.5 10157 3761 n.a.<br />
Denmark 128.1 5262 2627 n.a.<br />
F<strong>in</strong>l<strong>and</strong> 97.5 5125 2123 3586<br />
France 1197.8 58372 22451 37403<br />
Germany 1737.9 81896 35763 54260<br />
Greece* 138.8 10476 3824 n.a.<br />
Icel<strong>and</strong> 6.3 269 142 264<br />
Irel<strong>and</strong> 66.9 3621 1316 n.a.<br />
Italy 1183.0 57380 20571 n.a.<br />
Luxembourg* 13.2 416 213 n.a.<br />
Ne<strong>the</strong>rl<strong>and</strong>s 327.4 15523 7028 n.a.<br />
Norway 111.9 4381 2137 3037<br />
Portugal 137.1 9927 4532 9105<br />
Spa<strong>in</strong> 596.2 39270 12617 22837<br />
Sweden 174.4 8841 3963 6159<br />
Switzerl<strong>and</strong> 177.7 7105 3789 6555<br />
Turkey 376.1 62695 21395 n.a.<br />
United K<strong>in</strong>gdom 1147.9 58801 26218 45410<br />
OECD 25 20226.3 982998 427285 -<br />
* Data for 1995 <strong>in</strong> <strong>the</strong> third column.<br />
** Data for 1994 <strong>in</strong> <strong>the</strong> third column.<br />
*** Data for 1993 <strong>in</strong> <strong>the</strong> third column.<br />
Sources: OECD-OCDE (1999), "National Accounts: Ma<strong>in</strong> Aggregates - 1960-1997 - Volume 1 - Comptes nationaux :<br />
pr<strong>in</strong>cipaux agrégats", Paris, Part Seven, Table 1, p. 163 for <strong>the</strong> first column <strong>and</strong> Part Eight, Table 1, p. 175 for <strong>the</strong><br />
second column; OECD-OCDE (1997), "Labour Force Statistics - 1976-1996 - Statistiques de la population active",<br />
Paris, Part I, Table 4.0, p. 27 for <strong>the</strong> third column; national accounts statistical sources for F<strong>in</strong>l<strong>and</strong>, Germany, Norway<br />
<strong>and</strong> Switzrel<strong>and</strong> as well as authors' calculations based on OCDE (1998), "Perspectives de l'emploi, ju<strong>in</strong> 1998", Paris,<br />
Tableau F <strong>in</strong> "Annexe statistique", p. 225 for <strong>the</strong> fourth column.