Did the Swiss Economy Really Stagnate in the 1990s, and Is ...
Did the Swiss Economy Really Stagnate in the 1990s, and Is ...
Did the Swiss Economy Really Stagnate in the 1990s, and Is ...

Create successful ePaper yourself
Turn your PDF publications into a flip-book with our unique Google optimized e-Paper software.
18<br />
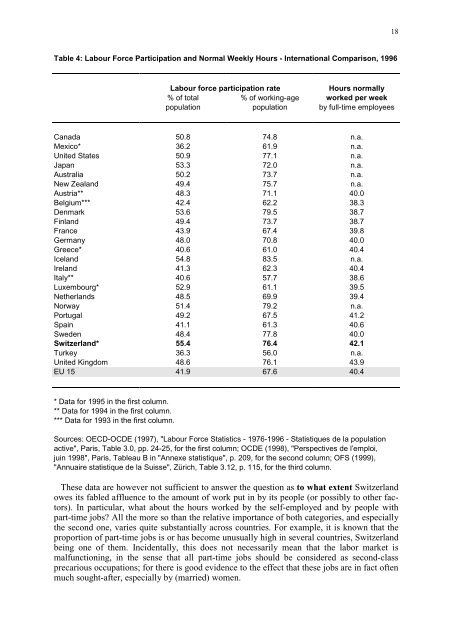
Table 4: Labour Force Participation <strong>and</strong> Normal Weekly Hours - International Comparison, 1996<br />
Labour force participation rate<br />
Hours normally<br />
% of total % of work<strong>in</strong>g-age worked per week<br />
population population by full-time employees<br />
Canada 50.8 74.8 n.a.<br />
Mexico* 36.2 61.9 n.a.<br />
United States 50.9 77.1 n.a.<br />
Japan 53.3 72.0 n.a.<br />
Australia 50.2 73.7 n.a.<br />
New Zeal<strong>and</strong> 49.4 75.7 n.a.<br />
Austria** 48.3 71.1 40.0<br />
Belgium*** 42.4 62.2 38.3<br />
Denmark 53.6 79.5 38.7<br />
F<strong>in</strong>l<strong>and</strong> 49.4 73.7 38.7<br />
France 43.9 67.4 39.8<br />
Germany 48.0 70.8 40.0<br />
Greece* 40.6 61.0 40.4<br />
Icel<strong>and</strong> 54.8 83.5 n.a.<br />
Irel<strong>and</strong> 41.3 62.3 40.4<br />
Italy** 40.6 57.7 38.6<br />
Luxembourg* 52.9 61.1 39.5<br />
Ne<strong>the</strong>rl<strong>and</strong>s 48.5 69.9 39.4<br />
Norway 51.4 79.2 n.a.<br />
Portugal 49.2 67.5 41.2<br />
Spa<strong>in</strong> 41.1 61.3 40.6<br />
Sweden 48.4 77.8 40.0<br />
Switzerl<strong>and</strong>* 55.4 76.4 42.1<br />
Turkey 36.3 56.0 n.a.<br />
United K<strong>in</strong>gdom 48.6 76.1 43.9<br />
EU 15 41.9 67.6 40.4<br />
* Data for 1995 <strong>in</strong> <strong>the</strong> first column.<br />
** Data for 1994 <strong>in</strong> <strong>the</strong> first column.<br />
*** Data for 1993 <strong>in</strong> <strong>the</strong> first column.<br />
Sources: OECD-OCDE (1997), "Labour Force Statistics - 1976-1996 - Statistiques de la population<br />
active", Paris, Table 3.0, pp. 24-25, for <strong>the</strong> first column; OCDE (1998), "Perspectives de l’emploi,<br />
ju<strong>in</strong> 1998", Paris, Tableau B <strong>in</strong> "Annexe statistique", p. 209, for <strong>the</strong> second column; OFS (1999),<br />
"Annuaire statistique de la Suisse", Zürich, Table 3.12, p. 115, for <strong>the</strong> third column.<br />
These data are however not sufficient to answer <strong>the</strong> question as to what extent Switzerl<strong>and</strong><br />
owes its fabled affluence to <strong>the</strong> amount of work put <strong>in</strong> by its people (or possibly to o<strong>the</strong>r factors).<br />
In particular, what about <strong>the</strong> hours worked by <strong>the</strong> self-employed <strong>and</strong> by people with<br />
part-time jobs? All <strong>the</strong> more so than <strong>the</strong> relative importance of both categories, <strong>and</strong> especially<br />
<strong>the</strong> second one, varies quite substantially across countries. For example, it is known that <strong>the</strong><br />
proportion of part-time jobs is or has become unusually high <strong>in</strong> several countries, Switzerl<strong>and</strong><br />
be<strong>in</strong>g one of <strong>the</strong>m. Incidentally, this does not necessarily mean that <strong>the</strong> labor market is<br />
malfunction<strong>in</strong>g, <strong>in</strong> <strong>the</strong> sense that all part-time jobs should be considered as second-class<br />
precarious occupations; for <strong>the</strong>re is good evidence to <strong>the</strong> effect that <strong>the</strong>se jobs are <strong>in</strong> fact often<br />
much sought-after, especially by (married) women.