Did the Swiss Economy Really Stagnate in the 1990s, and Is ...
Did the Swiss Economy Really Stagnate in the 1990s, and Is ...
Did the Swiss Economy Really Stagnate in the 1990s, and Is ...

Create successful ePaper yourself
Turn your PDF publications into a flip-book with our unique Google optimized e-Paper software.
13<br />
time-series often cover<strong>in</strong>g several decades (ie. not just <strong>the</strong> <strong>1990s</strong>), no matter what form <strong>the</strong><br />
model-build<strong>in</strong>g efforts take (conventional structural models, VAR <strong>and</strong> o<strong>the</strong>r time-series<br />
models, computable-general-equilibrium models, etc.). 24<br />
1.5 An alternative approach ?<br />
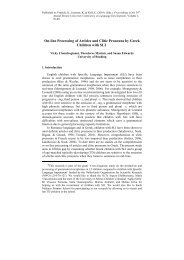
Table 3: GDP per Capita Indices Us<strong>in</strong>g Current PPPs (OECD=100) for 1996<br />
As orig<strong>in</strong>ally As obta<strong>in</strong>ed from As obta<strong>in</strong>ed from As obta<strong>in</strong>ed from<br />
published national real national real national nom<strong>in</strong>al<br />
by <strong>the</strong> OECD* growth factors growth factors growth factors<br />
(rebased)<br />
A B C D<br />
Canada 110 109 109 104<br />
Mexico - - - -<br />
United States 135 141 140 140<br />
Japan 117 114 114 102<br />
Australia 103 107 106 102<br />
New Zeal<strong>and</strong> 84 84 84 80<br />
Austria 108 105 104 108<br />
Belgium 108 104 103 104<br />
Denmark 118 114 113 109<br />
F<strong>in</strong>l<strong>and</strong> 92 93 92 88<br />
France 100 106 105 103<br />
Germany - - - -<br />
Greece - - - -<br />
Icel<strong>and</strong> 114 105 104 110<br />
Irel<strong>and</strong> 90 94 93 91<br />
Italy 100 100 100 116<br />
Luxembourg 155 165 164 160<br />
Ne<strong>the</strong>rl<strong>and</strong>s 102 103 102 100<br />
Norway 124 126 125 120<br />
Portugal - - - -<br />
Spa<strong>in</strong> 74 75 74 86<br />
Sweden 96 100 99 103<br />
Switzerl<strong>and</strong> 122 119 118 117<br />
Turkey - - - -<br />
United K<strong>in</strong>gdom 95 99 98 105<br />
OECD 20 100 100 100 100<br />
OECD 20 (unweighted average) 107.4 108.2 107.4 107.4<br />
*See Table 1.<br />
Source: OECD-OCDE (1999), "National Accounts: Ma<strong>in</strong> Aggregates - 1960-1997, Volume 1 -<br />
Comptes nationaux : pr<strong>in</strong>cipaux agrégats", Paris, Part Seven, Comparative Tables Based on<br />
PPPs, Table 3, pp. 162-163, <strong>and</strong> Part Three, Ma<strong>in</strong> Aggregates: Countries, pp. 31-91.<br />
24 / To illustrate from our <strong>Swiss</strong> forecast<strong>in</strong>g experience: s<strong>in</strong>ce <strong>the</strong> early <strong>1990s</strong>, Créa's various econometric models<br />
have consistently tended to overestimate real growth as <strong>in</strong>dicated by <strong>the</strong> national accounts. The operators <strong>in</strong><br />
charge of <strong>the</strong>se models (<strong>the</strong> first author be<strong>in</strong>g one of <strong>the</strong>m) have often had <strong>the</strong> feel<strong>in</strong>g that <strong>the</strong>ir models' ex ante<br />
results were more realistic than <strong>the</strong> ex post official data. Maybe it was more than a feel<strong>in</strong>g.