Did the Swiss Economy Really Stagnate in the 1990s, and Is ...
Did the Swiss Economy Really Stagnate in the 1990s, and Is ...
Did the Swiss Economy Really Stagnate in the 1990s, and Is ...

You also want an ePaper? Increase the reach of your titles
YUMPU automatically turns print PDFs into web optimized ePapers that Google loves.
20<br />
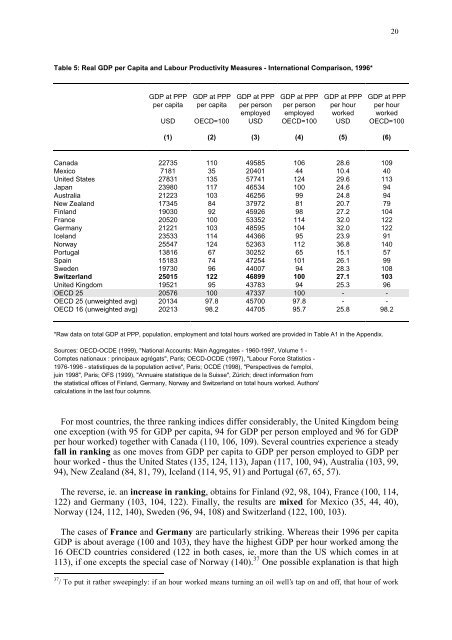
Table 5: Real GDP per Capita <strong>and</strong> Labour Productivity Measures - International Comparison, 1996*<br />
GDP at PPP GDP at PPP GDP at PPP GDP at PPP GDP at PPP GDP at PPP<br />
per capita per capita per person per person per hour per hour<br />
employed employed worked worked<br />
USD OECD=100 USD OECD=100 USD OECD=100<br />
(1) (2) (3) (4) (5) (6)<br />
Canada 22735 110 49585 106 28.6 109<br />
Mexico 7181 35 20401 44 10.4 40<br />
United States 27831 135 57741 124 29.6 113<br />
Japan 23980 117 46534 100 24.6 94<br />
Australia 21223 103 46256 99 24.8 94<br />
New Zeal<strong>and</strong> 17345 84 37972 81 20.7 79<br />
F<strong>in</strong>l<strong>and</strong> 19030 92 45926 98 27.2 104<br />
France 20520 100 53352 114 32.0 122<br />
Germany 21221 103 48595 104 32.0 122<br />
Icel<strong>and</strong> 23533 114 44366 95 23.9 91<br />
Norway 25547 124 52363 112 36.8 140<br />
Portugal 13816 67 30252 65 15.1 57<br />
Spa<strong>in</strong> 15183 74 47254 101 26.1 99<br />
Sweden 19730 96 44007 94 28.3 108<br />
Switzerl<strong>and</strong> 25015 122 46899 100 27.1 103<br />
United K<strong>in</strong>gdom 19521 95 43783 94 25.3 96<br />
OECD 25 20576 100 47337 100 - -<br />
OECD 25 (unweighted avg) 20134 97.8 45700 97.8 - -<br />
OECD 16 (unweighted avg) 20213 98.2 44705 95.7 25.8 98.2<br />
*Raw data on total GDP at PPP, population, employment <strong>and</strong> total hours worked are provided <strong>in</strong> Table A1 <strong>in</strong> <strong>the</strong> Appendix.<br />
Sources: OECD-OCDE (1999), "National Accounts: Ma<strong>in</strong> Aggregates - 1960-1997, Volume 1 -<br />
Comptes nationaux : pr<strong>in</strong>cipaux agrégats", Paris; OECD-OCDE (1997), "Labour Force Statistics -<br />
1976-1996 - statistiques de la population active", Paris; OCDE (1998), "Perspectives de l'emploi,<br />
ju<strong>in</strong> 1998", Paris; OFS (1999), "Annuaire statistique de la Suisse", Zürich; direct <strong>in</strong>formation from<br />
<strong>the</strong> statistical offices of F<strong>in</strong>l<strong>and</strong>, Germany, Norway <strong>and</strong> Switzerl<strong>and</strong> on total hours worked. Authors'<br />
calculations <strong>in</strong> <strong>the</strong> last four columns.<br />
For most countries, <strong>the</strong> three rank<strong>in</strong>g <strong>in</strong>dices differ considerably, <strong>the</strong> United K<strong>in</strong>gdom be<strong>in</strong>g<br />
one exception (with 95 for GDP per capita, 94 for GDP per person employed <strong>and</strong> 96 for GDP<br />
per hour worked) toge<strong>the</strong>r with Canada (110, 106, 109). Several countries experience a steady<br />
fall <strong>in</strong> rank<strong>in</strong>g as one moves from GDP per capita to GDP per person employed to GDP per<br />
hour worked - thus <strong>the</strong> United States (135, 124, 113), Japan (117, 100, 94), Australia (103, 99,<br />
94), New Zeal<strong>and</strong> (84, 81, 79), Icel<strong>and</strong> (114, 95, 91) <strong>and</strong> Portugal (67, 65, 57).<br />
The reverse, ie. an <strong>in</strong>crease <strong>in</strong> rank<strong>in</strong>g, obta<strong>in</strong>s for F<strong>in</strong>l<strong>and</strong> (92, 98, 104), France (100, 114,<br />
122) <strong>and</strong> Germany (103, 104, 122). F<strong>in</strong>ally, <strong>the</strong> results are mixed for Mexico (35, 44, 40),<br />
Norway (124, 112, 140), Sweden (96, 94, 108) <strong>and</strong> Switzerl<strong>and</strong> (122, 100, 103).<br />
The cases of France <strong>and</strong> Germany are particularly strik<strong>in</strong>g. Whereas <strong>the</strong>ir 1996 per capita<br />
GDP is about average (100 <strong>and</strong> 103), <strong>the</strong>y have <strong>the</strong> highest GDP per hour worked among <strong>the</strong><br />
16 OECD countries considered (122 <strong>in</strong> both cases, ie. more than <strong>the</strong> US which comes <strong>in</strong> at<br />
113), if one excepts <strong>the</strong> special case of Norway (140). 37 One possible explanation is that high<br />
37 / To put it ra<strong>the</strong>r sweep<strong>in</strong>gly: if an hour worked means turn<strong>in</strong>g an oil well’s tap on <strong>and</strong> off, that hour of work