Did the Swiss Economy Really Stagnate in the 1990s, and Is ...
Did the Swiss Economy Really Stagnate in the 1990s, and Is ...
Did the Swiss Economy Really Stagnate in the 1990s, and Is ...

You also want an ePaper? Increase the reach of your titles
YUMPU automatically turns print PDFs into web optimized ePapers that Google loves.
11<br />
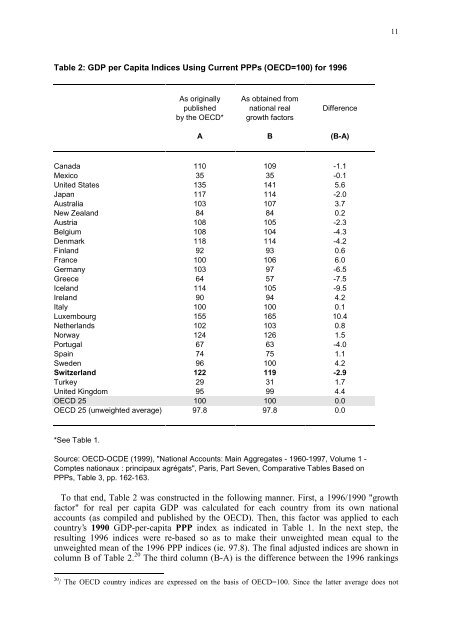
Table 2: GDP per Capita Indices Us<strong>in</strong>g Current PPPs (OECD=100) for 1996<br />
As orig<strong>in</strong>ally As obta<strong>in</strong>ed from<br />
published national real Difference<br />
by <strong>the</strong> OECD* growth factors<br />
A B (B-A)<br />
Canada 110 109 -1.1<br />
Mexico 35 35 -0.1<br />
United States 135 141 5.6<br />
Japan 117 114 -2.0<br />
Australia 103 107 3.7<br />
New Zeal<strong>and</strong> 84 84 0.2<br />
Austria 108 105 -2.3<br />
Belgium 108 104 -4.3<br />
Denmark 118 114 -4.2<br />
F<strong>in</strong>l<strong>and</strong> 92 93 0.6<br />
France 100 106 6.0<br />
Germany 103 97 -6.5<br />
Greece 64 57 -7.5<br />
Icel<strong>and</strong> 114 105 -9.5<br />
Irel<strong>and</strong> 90 94 4.2<br />
Italy 100 100 0.1<br />
Luxembourg 155 165 10.4<br />
Ne<strong>the</strong>rl<strong>and</strong>s 102 103 0.8<br />
Norway 124 126 1.5<br />
Portugal 67 63 -4.0<br />
Spa<strong>in</strong> 74 75 1.1<br />
Sweden 96 100 4.2<br />
Switzerl<strong>and</strong> 122 119 -2.9<br />
Turkey 29 31 1.7<br />
United K<strong>in</strong>gdom 95 99 4.4<br />
OECD 25 100 100 0.0<br />
OECD 25 (unweighted average) 97.8 97.8 0.0<br />
*See Table 1.<br />
Source: OECD-OCDE (1999), "National Accounts: Ma<strong>in</strong> Aggregates - 1960-1997, Volume 1 -<br />
Comptes nationaux : pr<strong>in</strong>cipaux agrégats", Paris, Part Seven, Comparative Tables Based on<br />
PPPs, Table 3, pp. 162-163.<br />
To that end, Table 2 was constructed <strong>in</strong> <strong>the</strong> follow<strong>in</strong>g manner. First, a 1996/1990 "growth<br />
factor" for real per capita GDP was calculated for each country from its own national<br />
accounts (as compiled <strong>and</strong> published by <strong>the</strong> OECD). Then, this factor was applied to each<br />
country’s 1990 GDP-per-capita PPP <strong>in</strong>dex as <strong>in</strong>dicated <strong>in</strong> Table 1. In <strong>the</strong> next step, <strong>the</strong><br />
result<strong>in</strong>g 1996 <strong>in</strong>dices were re-based so as to make <strong>the</strong>ir unweighted mean equal to <strong>the</strong><br />
unweighted mean of <strong>the</strong> 1996 PPP <strong>in</strong>dices (ie. 97.8). The f<strong>in</strong>al adjusted <strong>in</strong>dices are shown <strong>in</strong><br />
column B of Table 2. 20 The third column (B-A) is <strong>the</strong> difference between <strong>the</strong> 1996 rank<strong>in</strong>gs<br />
20 / The OECD country <strong>in</strong>dices are expressed on <strong>the</strong> basis of OECD=100. S<strong>in</strong>ce <strong>the</strong> latter average does not