Thin film microcalorimeter for heat capacity measurements ... - Physics
Thin film microcalorimeter for heat capacity measurements ... - Physics
Thin film microcalorimeter for heat capacity measurements ... - Physics

Create successful ePaper yourself
Turn your PDF publications into a flip-book with our unique Google optimized e-Paper software.
Rev. Sci. Instrum., Vol. 73, No. 4, April 2002<br />
Microcalorimetry in high magnetic fields<br />
1843<br />
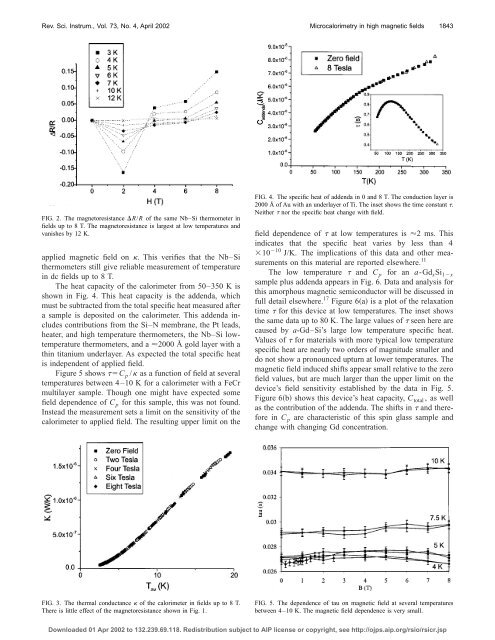
FIG. 2. The magnetoresistance R/R of the same Nb–Si thermometer in<br />
fields up to 8 T. The magnetoresistance is largest at low temperatures and<br />
vanishes by 12 K.<br />
applied magnetic field on . This verifies that the Nb–Si<br />
thermometers still give reliable measurement of temperature<br />
in dc fields up to 8 T.<br />
The <strong>heat</strong> <strong>capacity</strong> of the calorimeter from 50–350 K is<br />
shown in Fig. 4. This <strong>heat</strong> <strong>capacity</strong> is the addenda, which<br />
must be subtracted from the total specific <strong>heat</strong> measured after<br />
a sample is deposited on the calorimeter. This addenda includes<br />
contributions from the Si–N membrane, the Pt leads,<br />
<strong>heat</strong>er, and high temperature thermometers, the Nb–Si lowtemperature<br />
thermometers, and a 2000 Å gold layer with a<br />
thin titanium underlayer. As expected the total specific <strong>heat</strong><br />
is independent of applied field.<br />
Figure 5 shows C p / as a function of field at several<br />
temperatures between 4–10 K <strong>for</strong> a calorimeter with a FeCr<br />
multilayer sample. Though one might have expected some<br />
field dependence of C p <strong>for</strong> this sample, this was not found.<br />
Instead the measurement sets a limit on the sensitivity of the<br />
calorimeter to applied field. The resulting upper limit on the<br />
FIG. 4. The specific <strong>heat</strong> of addenda in 0 and 8 T. The conduction layer is<br />
2000 Å of Au with an underlayer of Ti. The inset shows the time constant .<br />
Neither nor the specific <strong>heat</strong> change with field.<br />
field dependence of at low temperatures is 2 ms. This<br />
indicates that the specific <strong>heat</strong> varies by less than 4<br />
10 10 J/K. The implications of this data and other <strong>measurements</strong><br />
on this material are reported elsewhere. 11<br />
The low temperature and C p <strong>for</strong> an a-Gd x Si 1x<br />
sample plus addenda appears in Fig. 6. Data and analysis <strong>for</strong><br />
this amorphous magnetic semiconductor will be discussed in<br />
full detail elsewhere. 17 Figure 6a is a plot of the relaxation<br />
time <strong>for</strong> this device at low temperatures. The inset shows<br />
the same data up to 80 K. The large values of seen here are<br />
caused by a-Gd–Si’s large low temperature specific <strong>heat</strong>.<br />
Values of <strong>for</strong> materials with more typical low temperature<br />
specific <strong>heat</strong> are nearly two orders of magnitude smaller and<br />
do not show a pronounced upturn at lower temperatures. The<br />
magnetic field induced shifts appear small relative to the zero<br />
field values, but are much larger than the upper limit on the<br />
device’s field sensitivity established by the data in Fig. 5.<br />
Figure 6b shows this device’s <strong>heat</strong> <strong>capacity</strong>, C total , as well<br />
as the contribution of the addenda. The shifts in and there<strong>for</strong>e<br />
in C p are characteristic of this spin glass sample and<br />
change with changing Gd concentration.<br />
FIG. 3. The thermal conductance of the calorimeter in fields up to 8 T.<br />
There is little effect of the magnetoresistance shown in Fig. 1.<br />
FIG. 5. The dependence of tau on magnetic field at several temperatures<br />
between 4–10 K. The magnetic field dependence is very small.<br />
Downloaded 01 Apr 2002 to 132.239.69.118. Redistribution subject to AIP license or copyright, see http://ojps.aip.org/rsio/rsicr.jsp