Appleyard et al - Vanderbilt University
Appleyard et al - Vanderbilt University
Appleyard et al - Vanderbilt University

You also want an ePaper? Increase the reach of your titles
YUMPU automatically turns print PDFs into web optimized ePapers that Google loves.
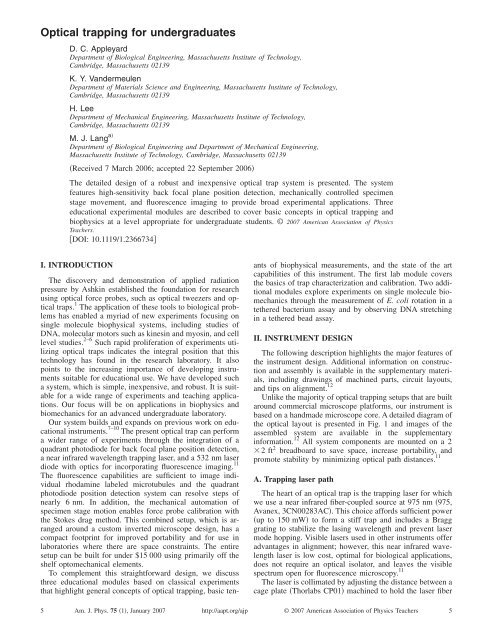
Optic<strong>al</strong> trapping for undergraduates<br />
D. C. <strong>Appleyard</strong><br />
Department of Biologic<strong>al</strong> Engineering, Massachus<strong>et</strong>ts Institute of Technology,<br />
Cambridge, Massachus<strong>et</strong>ts 02139<br />
K. Y. Vandermeulen<br />
Department of Materi<strong>al</strong>s Science and Engineering, Massachus<strong>et</strong>ts Institute of Technology,<br />
Cambridge, Massachus<strong>et</strong>ts 02139<br />
H. Lee<br />
Department of Mechanic<strong>al</strong> Engineering, Massachus<strong>et</strong>ts Institute of Technology,<br />
Cambridge, Massachus<strong>et</strong>ts 02139<br />
M. J. Lang a<br />
Department of Biologic<strong>al</strong> Engineering and Department of Mechanic<strong>al</strong> Engineering,<br />
Massachus<strong>et</strong>ts Institute of Technology, Cambridge, Massachus<strong>et</strong>ts 02139<br />
Received 7 March 2006; accepted 22 September 2006<br />
The d<strong>et</strong>ailed design of a robust and inexpensive optic<strong>al</strong> trap system is presented. The system<br />
features high-sensitivity back foc<strong>al</strong> plane position d<strong>et</strong>ection, mechanic<strong>al</strong>ly controlled specimen<br />
stage movement, and fluorescence imaging to provide broad experiment<strong>al</strong> applications. Three<br />
education<strong>al</strong> experiment<strong>al</strong> modules are described to cover basic concepts in optic<strong>al</strong> trapping and<br />
biophysics at a level appropriate for undergraduate students. © 2007 American Association of Physics<br />
Teachers.<br />
DOI: 10.1119/1.2366734<br />
I. INTRODUCTION<br />
The discovery and demonstration of applied radiation<br />
pressure by Ashkin established the foundation for research<br />
using optic<strong>al</strong> force probes, such as optic<strong>al</strong> tweezers and optic<strong>al</strong><br />
traps. 1 The application of these tools to biologic<strong>al</strong> problems<br />
has enabled a myriad of new experiments focusing on<br />
single molecule biophysic<strong>al</strong> systems, including studies of<br />
DNA, molecular motors such as kinesin and myosin, and cell<br />
level studies. 2–6 Such rapid proliferation of experiments utilizing<br />
optic<strong>al</strong> traps indicates the integr<strong>al</strong> position that this<br />
technology has found in the research laboratory. It <strong>al</strong>so<br />
points to the increasing importance of developing instruments<br />
suitable for education<strong>al</strong> use. We have developed such<br />
a system, which is simple, inexpensive, and robust. It is suitable<br />
for a wide range of experiments and teaching applications.<br />
Our focus will be on applications in biophysics and<br />
biomechanics for an advanced undergraduate laboratory.<br />
Our system builds and expands on previous work on education<strong>al</strong><br />
instruments. 7–10 The present optic<strong>al</strong> trap can perform<br />
a wider range of experiments through the integration of a<br />
quadrant photodiode for back foc<strong>al</strong> plane position d<strong>et</strong>ection,<br />
a near infrared wavelength trapping laser, and a 532 nm laser<br />
diode with optics for incorporating fluorescence imaging. 11<br />
The fluorescence capabilities are sufficient to image individu<strong>al</strong><br />
rhodamine labeled microtubules and the quadrant<br />
photodiode position d<strong>et</strong>ection system can resolve steps of<br />
nearly 6 nm. In addition, the mechanic<strong>al</strong> automation of<br />
specimen stage motion enables force probe c<strong>al</strong>ibration with<br />
the Stokes drag m<strong>et</strong>hod. This combined s<strong>et</strong>up, which is arranged<br />
around a custom inverted microscope design, has a<br />
compact footprint for improved portability and for use in<br />
laboratories where there are space constraints. The entire<br />
s<strong>et</strong>up can be built for under $15 000 using primarily off the<br />
shelf optomechanic<strong>al</strong> elements.<br />
To complement this straightforward design, we discuss<br />
three education<strong>al</strong> modules based on classic<strong>al</strong> experiments<br />
that highlight gener<strong>al</strong> concepts of optic<strong>al</strong> trapping, basic tenants<br />
of biophysic<strong>al</strong> measurements, and the state of the art<br />
capabilities of this instrument. The first lab module covers<br />
the basics of trap characterization and c<strong>al</strong>ibration. Two addition<strong>al</strong><br />
modules explore experiments on single molecule biomechanics<br />
through the measurement of E. coli rotation in a<br />
t<strong>et</strong>hered bacterium assay and by observing DNA str<strong>et</strong>ching<br />
in a t<strong>et</strong>hered bead assay.<br />
II. INSTRUMENT DESIGN<br />
The following description highlights the major features of<br />
the instrument design. Addition<strong>al</strong> information on construction<br />
and assembly is available in the supplementary materi<strong>al</strong>s,<br />
including drawings of machined parts, circuit layouts,<br />
and tips on <strong>al</strong>ignment. 12<br />
Unlike the majority of optic<strong>al</strong> trapping s<strong>et</strong>ups that are built<br />
around commerci<strong>al</strong> microscope platforms, our instrument is<br />
based on a handmade microscope core. A d<strong>et</strong>ailed diagram of<br />
the optic<strong>al</strong> layout is presented in Fig. 1 and images of the<br />
assembled system are available in the supplementary<br />
information. 12 All system components are mounted on a 2<br />
2 ft 2 breadboard to save space, increase portability, and<br />
promote stability by minimizing optic<strong>al</strong> path distances. 11<br />
A. Trapping laser path<br />
The heart of an optic<strong>al</strong> trap is the trapping laser for which<br />
we use a near infrared fiber-coupled source at 975 nm 975,<br />
Avanex, 3CN00283AC. This choice affords sufficient power<br />
up to 150 mW to form a stiff trap and includes a Bragg<br />
grating to stabilize the lasing wavelength and prevent laser<br />
mode hopping. Visible lasers used in other instruments offer<br />
advantages in <strong>al</strong>ignment; however, this near infrared wavelength<br />
laser is low cost, optim<strong>al</strong> for biologic<strong>al</strong> applications,<br />
does not require an optic<strong>al</strong> isolator, and leaves the visible<br />
spectrum open for fluorescence microscopy. 11<br />
The laser is collimated by adjusting the distance b<strong>et</strong>ween a<br />
cage plate Thorlabs CP01 machined to hold the laser fiber<br />
5 Am. J. Phys. 75 1, January 2007 http://aapt.org/ajp © 2007 American Association of Physics Teachers 5
Fig. 1. Optic<strong>al</strong> layout of the tweezer s<strong>et</strong>up. The dashed line at 45° indicates<br />
separation b<strong>et</strong>ween components placed horizont<strong>al</strong>ly on the breadboard<br />
lower right and those raised vertic<strong>al</strong>ly upper left as part of the inverted<br />
microscope. ND: neutr<strong>al</strong> density filter, QPD: quadrant photodiode, OBJ:<br />
objective, CD: condenser, 532: 532 nm fluorescence excitation laser, 975:<br />
975 near infrared trapping laser, M: mirror, M45: mirror oriented at 45° to<br />
the optic<strong>al</strong> breadboard connecting horizont<strong>al</strong> components lasers and vertic<strong>al</strong><br />
components objective and d<strong>et</strong>ector, L1: 35 mm lens, L2: 300 mm lens,<br />
L3: 100 mm lens, L4: 60 mm lens, L5: 11 mm lens, D1: IR reflective dichroic,<br />
D2: 532 reflective dichroic, KG: visible pass filter, OG: long pass<br />
filter, TL: tube lens, and CCD: charge-coupled device firewire camera.<br />
and a mounted 11 mm foc<strong>al</strong> length aspheric<strong>al</strong> lens L5,<br />
Thorlabs C220TM-B. 12 Alternatively, machining of the cage<br />
plate can be avoided by terminating the fiber with a ferrule<br />
connector and using a FC mount Thorlabs SM1FCA. The<br />
collimated beam is 1.6 mm in diam<strong>et</strong>er and is further expanded<br />
to 2.7 mm with a telescope consisting of two lenses<br />
with foc<strong>al</strong> lengths of 100 and 60 mm L3 and L4, Thorlabs<br />
AC254-100-B and AC254-60-B. An XY mount Thorlabs<br />
LM1XY for the 60 mm lens permits mechanic<strong>al</strong> steering of<br />
the trap in the sample plane. Two silver mirrors M, Thorlabs<br />
PF10-03-P01 facilitate <strong>al</strong>ignment of the beam par<strong>al</strong>lel to the<br />
breadboard. The separation of visible light and near infrared<br />
paths occurs at the dichroic D1, Thorlabs FM01 after the<br />
telescope. A mirror oriented at 45° to the breadboard M45,<br />
Thorlabs PF10-03-P01 reflects the light path vertic<strong>al</strong>ly toward<br />
the objective. The objective focuses the beam to create<br />
the trap, and the back-scattered and transmitted light collected<br />
by the condenser is directed into the d<strong>et</strong>ection branch.<br />
B. Inverted microscope<br />
As mentioned, the trapping apparatus is constructed<br />
around a handmade inverted microscope core. We choose the<br />
inverted microscope design for its stability and ease of multiple<br />
beam incorporation, and as an arrangement where gravity<br />
drives sample beads to the coverglass surface. A solid<br />
mechanic<strong>al</strong> layout promotes stability of the optics and<br />
sample, with a 1.5 in. vibration damped post Melles Griot<br />
07 DUP 12 forming the backbone of the inverted design.<br />
Two vertic<strong>al</strong>ly oriented translation mounts Thorlabs MT1<br />
are attached to the post, providing mounting points for custom<br />
L-shaped adapter brack<strong>et</strong>s that hold the objective and<br />
condenser. 12<br />
The objective used, a 1001.25 NA OBJ, Nikon, has a<br />
back aperture of 5 mm, larger than the trapping beam diam<strong>et</strong>er<br />
of 2.7 mm. Trapping theory dictates that overfilling the<br />
back aperture provides the stiffest trap possible, taking full<br />
advantage of the numeric<strong>al</strong> aperture of the objective. 13 A few<br />
considerations motivate our non-stiffness-optimized design.<br />
Due to the numeric<strong>al</strong> aperture NA of the condenser and the<br />
optics within the d<strong>et</strong>ection branch, the best sensitivity to<br />
bead position is obtained at a 100:600 expansion. Our choice<br />
of lenses for the telescope b<strong>al</strong>anced foc<strong>al</strong> length versus space<br />
available on the breadboard and aberrations experienced with<br />
short foc<strong>al</strong> length lenses. The 1.67 expansion provides a<br />
trap stiffness that is sufficient for the experiment<strong>al</strong> applications<br />
of interest.<br />
An air spaced infinity condenser, numeric<strong>al</strong> aperture 0.9,<br />
40 CD, Nikon 92381, delivers bright field illumination<br />
and collects the scattered trap beam for position d<strong>et</strong>ection.<br />
This choice of condenser avoids the use of oil and permits<br />
ease of loading samples. A white light source Maglite AA<br />
Mini-Maglite is mounted above the condenser and supplies<br />
2900 candela of illumination for bright-field imaging.<br />
C. D<strong>et</strong>ection branch<br />
The position d<strong>et</strong>ection branch is mounted above the condenser<br />
using a machined plate Thorlabs CP01. 12 A cage<br />
cube Thorlabs C4 W holds a dichroic mirror D1, Thorlabs<br />
FM01 that reflects the 975 nm beam toward the d<strong>et</strong>ector<br />
while passing the white light illumination. A 35 mm foc<strong>al</strong><br />
length lens L1, Thorlabs LB1811 forms an image conjugate<br />
to the condenser back foc<strong>al</strong> plane on a quadrant photo diode<br />
UDT Spot 9DMI s<strong>et</strong> in an X-Y translation mount Thorlabs<br />
HPT1. A quadrant photodiode was used as the most cost<br />
effective option, <strong>al</strong>though more sensitive and faster position<br />
sensitive devices are available. A neutr<strong>al</strong> density filter ND,<br />
Thorlabs NE20B attenuates light intensity to avoid saturating<br />
the d<strong>et</strong>ector.<br />
A handmade d<strong>et</strong>ection circuit is used to provide a<br />
−10 to 10 V sign<strong>al</strong>. The design follows those in the literature<br />
and is available in the supplementary materi<strong>al</strong>s. 12,14 The circuitry<br />
is designed to have a bandwidth of 20 kHz, approximately<br />
an order of magnitude greater than the expected<br />
rolloff frequency characteristic of trapped bead motion. 11<br />
D. Other subsystems<br />
For white light imaging of samples, the eyepiece is deliberately<br />
omitted to reduce cost and enhance the saf<strong>et</strong>y of the<br />
instrument. Instead, imaging is accomplished using a 640<br />
480 CCD firewire camera CCD, ImagingSource DMK<br />
21F04, which is placed at an image plane formed by a<br />
200 mm foc<strong>al</strong> length tube lens TL, Nikon 93020. Filters<br />
eliminate either the 975 nm beam KG, Schott KG5 or the<br />
fluorescence excitation wavelength 532 nm OG, Schott<br />
OG570. These filters can be removed for <strong>al</strong>ignment or demonstration<br />
purposes, <strong>al</strong>though care must be used to prevent<br />
damage to the CCD camera.<br />
6 Am. J. Phys., Vol. 75, No. 1, January 2007<br />
<strong>Appleyard</strong> <strong>et</strong> <strong>al</strong>. 6
A three-axis stage Newport 562 ULTRAlign affords a<br />
stable and smooth translation mount for the sample. It is<br />
elevated above the breadboard using a 1.5 in. post Thorlabs<br />
P3. Two machined bars with slide clips suspend the slide<br />
over the objective. 12 The integration of two picomotors New<br />
Focus 8301 to replace the microm<strong>et</strong>ers permits automated X<br />
and Y stage position control and movement with a step increment<br />
of 30 nm, <strong>al</strong>beit with some hysteresis. This control<br />
facilitates the c<strong>al</strong>ibration of the position d<strong>et</strong>ection, permits<br />
Stokes drag c<strong>al</strong>ibrations, and extends the versatility of<br />
the instrument.<br />
For fluorescence excitation, a low cost 3 mW laser 532,<br />
World Star Tech DPGL-03S-TTL at 532 nm offers ample<br />
power for fluorescence imaging. A dichroic mirror D2,<br />
Chroma Z532RDC integrates the excitation laser into the<br />
optic<strong>al</strong> path. A long pass filter placed before the CCD camera<br />
CVI CG-OG-570-1.00-2.0 eliminates any remaining excitation<br />
illumination. A 300 mm lens L2, Thorlabs LB1779<br />
focuses the 532 nm excitation laser at the back foc<strong>al</strong> plane of<br />
the objective to make the region of sample illumination<br />
larger.<br />
A high speed computer-based data acquisition system is<br />
used to log data and automate stage movement Nation<strong>al</strong><br />
Instruments PCI-6070E. Labview software provides integrated<br />
control and data acquisition for the system. Examples<br />
of acquisition and control software are available in the<br />
supplementary materi<strong>al</strong>s. 12 Data an<strong>al</strong>ysis was done using<br />
Matlab.<br />
E. Saf<strong>et</strong>y<br />
Appropriate saf<strong>et</strong>y measures must be taken with Class IIIb<br />
trap and excitation lasers, one of which is not visible to the<br />
naked eye in use in an undergraduate environment. An enclosure<br />
was built to encompass <strong>al</strong>l of the horizont<strong>al</strong> optic<strong>al</strong><br />
components, blocking any stray reflections and limiting access<br />
to the beam path. The enclosure has the added advantage<br />
of blocking room light from disrupting the CCD image<br />
qu<strong>al</strong>ity. We recommend enclosing the entire instrument with<br />
laser interlocks for addition<strong>al</strong> saf<strong>et</strong>y. It is imperative to discuss<br />
laser saf<strong>et</strong>y with students prior to laboratory experimentation<br />
to reduce the possibility of injury.<br />
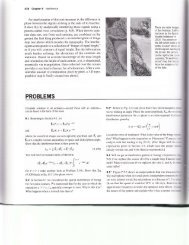
III. EXPERIMENT: CALIBRATION<br />
Optic<strong>al</strong> trap c<strong>al</strong>ibration procedures are centr<strong>al</strong> for students’<br />
foundation in the physic<strong>al</strong> properties of the microscopic<br />
environment. Here they are exposed to units of energy<br />
in k B T, forces in piconewtons, and distances in nanom<strong>et</strong>ers.<br />
Three c<strong>al</strong>ibration procedures, Stokes drag, equipartition, and<br />
power spectrum, provide the basis of quantitative measurements<br />
using an optic<strong>al</strong> trap and give an essenti<strong>al</strong> exposure to<br />
m<strong>et</strong>hods used in high end instrumentation. Taking these c<strong>al</strong>ibration<br />
measurements permits students to learn techniques<br />
for data acquisition, curve fitting, and an<strong>al</strong>ysis while providing<br />
essenti<strong>al</strong> skills for the other modules.<br />
A. C<strong>al</strong>ibration: Theory<br />
C<strong>al</strong>ibration can be separated into two parts. First, c<strong>al</strong>ibration<br />
of the d<strong>et</strong>ector is required to d<strong>et</strong>ermine the relation b<strong>et</strong>ween<br />
the voltage sign<strong>al</strong> produced by the d<strong>et</strong>ector and the<br />
position of the bead with respect to the center of the trap x.<br />
The trap behaves as a linear spring, and thus force is c<strong>al</strong>culated<br />
by measuring the displacement out of the trap center<br />
and the spring constant k, the second v<strong>al</strong>ue required. These<br />
two c<strong>al</strong>ibrations provide the param<strong>et</strong>ers to c<strong>al</strong>culate the force<br />
exerted by the trap by the relation F=kx. Position and stiffness<br />
v<strong>al</strong>ues are c<strong>al</strong>ibrated for both later<strong>al</strong> axes of stage motion,<br />
because the position response and trap stiffness will<br />
vary due to the laser beam profile and polarization.<br />
1. Position c<strong>al</strong>ibration<br />
In our design three m<strong>et</strong>hods are available for d<strong>et</strong>ermining<br />
the position c<strong>al</strong>ibration, one based on video and two using<br />
the quadrant photodiode. The video is slower and requires<br />
significant postprocessing of data. Though this instrument is<br />
capable of video position d<strong>et</strong>ection, it is unused because the<br />
quadrant photodiode has a faster response time. The video<br />
m<strong>et</strong>hod relies on extracting the pixel position of an object<br />
from different frames in a sequence of motion. The difference<br />
in pixel positions is c<strong>al</strong>culated and a pixel to nanom<strong>et</strong>er<br />
conversion is applied to yield quantitative movement. This<br />
conversion factor can be d<strong>et</strong>ermined by using a ruled microscope<br />
slide or precisely known movements of an object.<br />
We use two position c<strong>al</strong>ibration m<strong>et</strong>hods involving the<br />
quadrant photodiode. Rather than relying on video, these<br />
m<strong>et</strong>hods of c<strong>al</strong>ibration report the location of a trapped bead<br />
by converting the back foc<strong>al</strong> plane image of the laser scatter<br />
to an X and Y voltage sign<strong>al</strong> that is converted to nanom<strong>et</strong>ers<br />
of displacement. The first quadrant photodiode technique involves<br />
scanning a sample targ<strong>et</strong> bead immobilized on the<br />
surface through a grid of known displacements with automated<br />
stage movement and mapping the voltage response of<br />
the quadrant photodiode. 15 This m<strong>et</strong>hod is straightforward<br />
and quick. It requires accurate, reproducible, and automated<br />
movement of the bead relative to the trap, which can be a<br />
costly part of the design and can be achieved using piezo<br />
stages.<br />
The second quadrant photodiode technique is outlined in<br />
Refs. 16 and 17. It focuses on extracting the voltage to nanom<strong>et</strong>er<br />
conversion of the quadrant photodiode directly from<br />
the power spectrum of a trapped bead. In an optic<strong>al</strong> trap the<br />
power spectr<strong>al</strong> density of a trapped bead has a Lorentzian<br />
profile described by 13,16,18<br />
S VV f = 2 k B T<br />
2 f 2 0 + f 2 ,<br />
where S VV f is the unc<strong>al</strong>ibrated power spectrum with units<br />
of V 2 /Hz, f is the frequency, k B is Boltzmann’s constant,<br />
is the drag coefficient equ<strong>al</strong> to 6r, where is the<br />
viscosity of the fluid medium, r is the radius of the bead,<br />
T is the absolute temperature, is the linear voltage to<br />
displacement c<strong>al</strong>ibration factor, and f 0 is the corner frequency.<br />
The multiplication of the power spectrum by f 2 results in a<br />
constant v<strong>al</strong>ue of S VV f f 2 at high frequencies where<br />
f f 0 . 16 If we use this constant v<strong>al</strong>ue and rearrange the<br />
terms, we obtain<br />
= S VVf f 0 f 2 2 <br />
k B T<br />
1/2<br />
<br />
1<br />
. 2<br />
The position c<strong>al</strong>ibration v<strong>al</strong>ue has units of voltage/<br />
displacement. This m<strong>et</strong>hod is very useful for the instrument<br />
if controlled stage motion is absent.<br />
7 Am. J. Phys., Vol. 75, No. 1, January 2007<br />
<strong>Appleyard</strong> <strong>et</strong> <strong>al</strong>. 7
2. Trap stiffness c<strong>al</strong>ibrations<br />
With position c<strong>al</strong>ibration compl<strong>et</strong>ed, the stiffness of the<br />
trap can be ev<strong>al</strong>uated in sever<strong>al</strong> ways. The Stokes drag c<strong>al</strong>ibration<br />
m<strong>et</strong>hod measures the displacement of a trapped bead<br />
out of the center of the trap caused by b<strong>al</strong>ancing the extern<strong>al</strong><br />
drag force applied by the fluid flow with the restoring force<br />
of the trap. The measurement is made by translating the<br />
sample chamber at a controlled velocity and inducing a well<br />
defined laminar drag flow about the trapped bead. For a<br />
spheric<strong>al</strong> bead the drag force is 6rv, where v is the velocity<br />
of the fluid. The stiffness of the trap k can be equated<br />
to this force for a displacement x from the center of the trap<br />
as<br />
kx =6rv.<br />
If the bead is near the coverglass surface, it will experience<br />
boundary layer effects changing the viscous drag coefficient.<br />
These can be accounted for using Faxen’s law correction. 14<br />
The second c<strong>al</strong>ibration m<strong>et</strong>hod is based on the equipartition<br />
theorem, which states that each degree of freedom in a<br />
harmonic potenti<strong>al</strong> has k B T/2 of energy. This relation can be<br />
used to relate the measurement of the instantaneous displacement<br />
of a trapped particle to the available therm<strong>al</strong> energy of<br />
a system defined as<br />
3<br />
1<br />
2 k BT = 1 2 kx − x mean 2 . 4<br />
The equipartition m<strong>et</strong>hod does not rely on specific information<br />
of the medium, viscous drag, or particle size and shape;<br />
however, this m<strong>et</strong>hod requires c<strong>al</strong>ibration of the position d<strong>et</strong>ection.<br />
The fin<strong>al</strong> m<strong>et</strong>hod of c<strong>al</strong>ibration <strong>al</strong>so relies on the therm<strong>al</strong><br />
motion of a trapped bead and the Lorentzian profile of the<br />
power spectrum given in Eq. 1. The rolloff or corner frequency<br />
of the power spectrum provides the trap stiffness as<br />
k = f 0 2.<br />
This m<strong>et</strong>hod is independent of the d<strong>et</strong>ector voltage to displacement<br />
c<strong>al</strong>ibration, which is a significant advantage in an<br />
instrument lacking integrated stage motion or some other<br />
means to provide position c<strong>al</strong>ibration. Again a fast<br />
10 kHz acquisition rate is required, necessitating care<br />
in the choice of d<strong>et</strong>ector and d<strong>et</strong>ector circuitry. 18<br />
B. C<strong>al</strong>ibration: Materi<strong>al</strong>s and m<strong>et</strong>hods<br />
The go<strong>al</strong> of this section is to acquire three data s<strong>et</strong>s. First,<br />
a voltage trace of the therm<strong>al</strong> motion of a trapped bead is<br />
gathered. These data will be used in the power spectrum and<br />
equipartition m<strong>et</strong>hods to c<strong>al</strong>culate a position c<strong>al</strong>ibration<br />
based on the fit of the power spectr<strong>al</strong> density to the Lorentzian<br />
as described in Eq. 1. Secondly, a voltage versus stage<br />
velocity measurement is taken to <strong>al</strong>low Stokes drag c<strong>al</strong>culations.<br />
Fin<strong>al</strong>ly, a quadrant photodiode voltage to position c<strong>al</strong>ibration<br />
generated by stepping a bead stuck on the slide<br />
through the trap is compl<strong>et</strong>ed. To fully characterize the instrument,<br />
these measurements are repeated to cover a range<br />
of laser intensities. Because the stiffness should track linearly<br />
with laser power, the instrument can be c<strong>al</strong>ibrated by<br />
sweeping the available range of laser power output.<br />
A slide with beads both stuck to the surface and free in<br />
solution is optim<strong>al</strong> for performing c<strong>al</strong>ibrations. A flow cell is<br />
created by placing two pieces of double sided sticky tape<br />
5<br />
Fig. 2. Diagram of a flow channel black constructed from a standard<br />
microscope slide, two pieces of double sided sticky tape light gray, and a<br />
coverslip dark gray. The channel is about 3–4 mm wide. A vacuum line<br />
can be used to flush the sample chamber.<br />
across the center of a standard microscope slide to form a<br />
3–4 mm wide channel. A coverslip is placed over the top of<br />
the tape, perpendicular to the microscope slide, and firmly<br />
se<strong>al</strong>ed, forming a channel with a volume around 15 L as<br />
shown in Fig. 2. The exchange of channel contents is done<br />
by depositing the new solution on the coverslip on one side<br />
of the channel and then drawing the solution through from<br />
the other side. A vacuum s<strong>et</strong>up with a pip<strong>et</strong>te tip at one end<br />
can provide suction to draw the fluid. Alternatively, using the<br />
tip of a wedge of filter paper provides suction by capillary<br />
action. Maintaining a flow rate below 100 L/min is reasonable<br />
for the applications discussed here. To affix beads on<br />
the surface of a slide a 1 M NaCl solution containing beads<br />
at a 1:1000 dilution of 10 wt% stock beads 1 m silica,<br />
Bangs SS03N/4669 is loaded into the channel and <strong>al</strong>lowed<br />
to incubate for 1 h. The channel is then flushed with 300 L<br />
of water using the vacuum to displace the s<strong>al</strong>t solution. Suspended<br />
beads, a 1:50 000 dilution of the same 10 wt% beads<br />
in water, is then loaded. The channel is fin<strong>al</strong>ly se<strong>al</strong>ed with<br />
nail polish or vacuum grease to prevent evaporation.<br />
The slide is loaded on the sample stage with a single drop<br />
of immersion oil placed b<strong>et</strong>ween the objective and coverglass.<br />
The air spaced condenser is lowered to a pred<strong>et</strong>ermined<br />
position where it collimates the exiting laser beam. To<br />
facilitate focusing on the surface, students can first position<br />
the slide so that the center of the lens is near the tape-water<br />
boundary. Translating the slide later<strong>al</strong>ly will help to find the<br />
tape/flow chamber boundary; focusing the slide <strong>al</strong>ong the<br />
optic<strong>al</strong> axis can then be used to locate the coverglass surface.<br />
The next step is to ready the d<strong>et</strong>ector by zeroing the sign<strong>al</strong>.<br />
With a suspended bead trapped, the quadrant photodiode<br />
is moved in the mount to zero the X and Y sign<strong>al</strong>s. A sample<br />
trace of the d<strong>et</strong>ector voltage in X and Y is collected Fig. 3<br />
Fig. 3. Power spectr<strong>al</strong> density of a bead in the trap fitted to a Lorentzian<br />
curve dashed line where the rolloff frequency can be extracted to c<strong>al</strong>culate<br />
stiffness. This measurement at 30 mW yielded a stiffness of 0.0246 pN/nm<br />
from the rolloff. Ins<strong>et</strong>: Position versus time data used to c<strong>al</strong>culate the equipartition<br />
stiffness from Eq. 4. For this measurement at 30 mW the equipartition<br />
stiffness was 0.0242 pN/nm.<br />
8 Am. J. Phys., Vol. 75, No. 1, January 2007<br />
<strong>Appleyard</strong> <strong>et</strong> <strong>al</strong>. 8
Table I. Measured trap stiffness for the Y axis using the three m<strong>et</strong>hods of<br />
c<strong>al</strong>ibration.<br />
Stiffness pN/nm<br />
30 mW 60 mW 90 mW 120 mW<br />
Lorentzian 0.024 0.044 0.057 0.066<br />
Equipartition a 0.023 0.045 0.061 0.068<br />
Stokes Drag a 0.033 0.057 0.067 0.106<br />
Equipartition b 0.010 0.019 0.038 0.052<br />
Stokes Drag b 0.020 0.036 0.054 0.090<br />
Fig. 4. Stokes drag m<strong>et</strong>hod for d<strong>et</strong>ermining trap stiffness. Open circles: The<br />
displacement x of the 1 m bead out of the trap was taken for various stage<br />
velocities, which is equiv<strong>al</strong>ent to the fluid velocity V f . Solid line: Linear fit<br />
of the displacement to the stage velocity; the slope is k/ as in Eq. 3. The<br />
c<strong>al</strong>culated stiffness at 30 mW was 0.0322 pN/nm. Ins<strong>et</strong>: Cartoon of Stokes<br />
flow measurement. F d is the drag force caused by flow V f , F t is the restoring<br />
force from the trap.<br />
at 100 kHz. The fastest acquisition speed is used so that<br />
ample bandwidth is available for the Lorentzian and equipartition<br />
measurements.<br />
To do the Stokes drag measurement a bead is held in the<br />
trap while the stage is translated at a s<strong>et</strong> velocity to produce<br />
a uniform drag flow around the bead Fig. 4, ins<strong>et</strong>. The<br />
d<strong>et</strong>ector voltage is captured simultaneously to measure the<br />
displacement of the bead caused by the drag force. A series<br />
of stage velocities is used to produce a range of bead displacements<br />
Fig. 4.<br />
Fin<strong>al</strong>ly, a position c<strong>al</strong>ibration must be acquired. This process<br />
involves scanning a stuck bead through the focused trap<br />
beam in the X-Y plane. A stuck bead is placed in the center of<br />
the trap, where the X and Y voltage is zero. This zero point,<br />
labeled A in Fig. 5, should reside b<strong>et</strong>ween the maximum and<br />
minimum voltage measured during the bead scan. Acquiring<br />
the c<strong>al</strong>ibration for one axis involves increment<strong>al</strong>ly moving<br />
the stage in uniform steps of a defined displacement while<br />
recording the d<strong>et</strong>ector voltage. The bead is recentered and<br />
the other axis is scanned. To fully characterize the d<strong>et</strong>ector<br />
region a scan of 3 m is sufficient and a step size of 30 nm<br />
provides adequate resolution. The voltage to position data<br />
can be fit to a line or a third-order polynomi<strong>al</strong> to compl<strong>et</strong>e<br />
the c<strong>al</strong>ibration Fig. 5.<br />
Full characterization of the d<strong>et</strong>ector response involves repeating<br />
the c<strong>al</strong>ibrations at a range of laser powers. Because<br />
Fig. 5. Scan of a 1 m stuck bead used to d<strong>et</strong>ermine the position c<strong>al</strong>ibration<br />
for the d<strong>et</strong>ector. Circles: Acquired data. Solid line: Linear fit for c<strong>al</strong>ibration<br />
coefficient of 128.5 nm/V. Label A indicates a zero point where the bead<br />
is in the center of the d<strong>et</strong>ector.<br />
a C<strong>al</strong>culations using the position c<strong>al</strong>ibration from the Lorentzian, Eq. 1.<br />
b C<strong>al</strong>culations using the position c<strong>al</strong>ibration from a scanned stuck bead.<br />
the position d<strong>et</strong>ection uses the same laser as the trap, the<br />
position to voltage c<strong>al</strong>ibration must be repeated at each new<br />
power level.<br />
C. C<strong>al</strong>ibration: Experiment<strong>al</strong> results<br />
Our go<strong>al</strong> is to expose students to the capabilities of a high<br />
end instrument while keeping costs down and maintaining<br />
ease of use. Because some points of our design sacrifice<br />
optim<strong>al</strong> trapping and d<strong>et</strong>ection, perfect agreement b<strong>et</strong>ween<br />
the c<strong>al</strong>ibration m<strong>et</strong>hods will not occur. One example is the<br />
use of an air spaced condenser with sm<strong>al</strong>ler diam<strong>et</strong>er optics<br />
on the d<strong>et</strong>ection branch that restrict the aperture of the d<strong>et</strong>ection<br />
beam. Addition<strong>al</strong>ly, high end research instruments<br />
use separate trapping and d<strong>et</strong>ector beams combined with automated<br />
optics to facilitate position c<strong>al</strong>ibration using a bead<br />
in solution rather than one stuck to the coverslip. 19 We have<br />
observed that the in-solution bead c<strong>al</strong>ibration v<strong>al</strong>ues diverge<br />
from the stuck bead c<strong>al</strong>ibration v<strong>al</strong>ues as the numeric<strong>al</strong> aperture<br />
of the condenser is restricted. This difference is one<br />
reason position c<strong>al</strong>ibration v<strong>al</strong>ues reported using varying<br />
m<strong>et</strong>hods differ and may either directly or indirectly affect the<br />
agreement b<strong>et</strong>ween the stiffness c<strong>al</strong>ibrations. Fin<strong>al</strong>ly, the picomotors<br />
used to do a stuck bead position c<strong>al</strong>ibration exhibit<br />
some random step size distribution and demonstrated off axis<br />
motion.<br />
The roll off and equipartition m<strong>et</strong>hods show the closest<br />
agreement for stiffness measurements see Table I when the<br />
power spectrum m<strong>et</strong>hod of position c<strong>al</strong>ibration is used. This<br />
agreement is not surprising because these techniques use the<br />
same data s<strong>et</strong> and are inherently linked m<strong>et</strong>hods.<br />
The largest inconsistency in stiffness c<strong>al</strong>ibration was with<br />
the Stokes m<strong>et</strong>hod. At laser powers below 100 mW, the v<strong>al</strong>ues<br />
were within a factor of 2 of those obtained by equipartition<br />
or the power spectrum. At laser powers above 100 mW<br />
the deviation reached a factor of 2. Here the variation can<br />
likely be attributed to the inconsistent picomotor speed as<br />
well as changes in focus and the slide environment during<br />
motion. Another attribute that contributed to inconsistency<br />
was the difficulty in controlling the exact height of the bead<br />
above the surface. The height directly d<strong>et</strong>ermines the boundary<br />
effects caused by surface proximity and could lead to<br />
variations of the c<strong>al</strong>ibration m<strong>et</strong>hods.<br />
The d<strong>et</strong>ection circuitry provides sufficient bandwidth for<br />
the trap stiffnesses encountered with our design. However, if<br />
the trap stiffness increases significantly, the circuitry will<br />
skew data on rolloff measurements because the electronic<br />
filter will impose and artifici<strong>al</strong>ly lower the rolloff frequency.<br />
9 Am. J. Phys., Vol. 75, No. 1, January 2007<br />
<strong>Appleyard</strong> <strong>et</strong> <strong>al</strong>. 9
We found the position c<strong>al</strong>ibrations to be consistent above<br />
70 mW and recommend the power spectrum m<strong>et</strong>hod for<br />
lower powers. Because of the lack of dependence on position<br />
c<strong>al</strong>ibration, we used the stiffness derived from the power<br />
spectrum for a majority of the experiments. We encourage<br />
researchers and students <strong>al</strong>ike to characterize their own instrument<br />
to ev<strong>al</strong>uate which m<strong>et</strong>hod works best.<br />
IV. EXPERIMENT: ROTATING E. COLI<br />
The low force regime at which optic<strong>al</strong> traps work make<br />
them optim<strong>al</strong> for investigating the mechanic<strong>al</strong> output of biologic<strong>al</strong><br />
molecular motors. 4,20 A supply of flagellar motors<br />
that are easy to work with can be found by using the bacterium<br />
E. coli. The bacteri<strong>al</strong> populations are easy to culture<br />
and simple to visu<strong>al</strong>ize with a light microscope, making<br />
them optim<strong>al</strong> for this laboratory environment.<br />
The t<strong>et</strong>hered bacterium or rotating bacteri<strong>al</strong> cell assay uses<br />
torque from the flagellar motor to rotate the body of the cell.<br />
This robust assay has been used to study chemotaxis and the<br />
biophysics of the flagellar motor. 21,22 Addition<strong>al</strong>ly, the visu<strong>al</strong><br />
nature of the experiment quickly captures the students’ attention.<br />
For students this assay provides access to molecular<br />
motors, highlights scientific estimation, uses the time and<br />
frequency domain representation, and exposes them to doing<br />
collaborative studies. Probing flagellar motion can seed discussion<br />
of bacteri<strong>al</strong> propulsion including random w<strong>al</strong>ks as<br />
well as life at low Reynolds number. 23<br />
Two characteristics that can be quantified individu<strong>al</strong>ly<br />
with E. coli using the optic<strong>al</strong> trap are the rotation frequency<br />
and st<strong>al</strong>l torque of the flagellar motor. 22 In this module a<br />
weak trap can monitor rotation and a strong trap can be used<br />
to h<strong>al</strong>t rotation. The ease with which measurements can be<br />
collected supports the compilation of population data and the<br />
opportunity to explore the h<strong>et</strong>erogeneity in a sample.<br />
A. E. coli: Materi<strong>al</strong>s and m<strong>et</strong>hods<br />
To easily measure rotation param<strong>et</strong>ers a specific strain of<br />
E. coli that can quickly attach to the coverslip is required.<br />
The KAF95 strain is nonpathogenic, exhibits only clockwise<br />
rotation, and has sticky flagellum that can attach to glass. 24<br />
Samples of KAF95 are available to institutions uponc request.<br />
A sm<strong>al</strong>l sample of E. coli can be grown in culture and<br />
then either frozen for future use as an inoculation or used<br />
directly in the experiment. To grow a culture, 10 mL of a<br />
solution containing 10 mg/mL Bacto-Tryptone Becton,<br />
Dickinson and Company, 5 mg/ml NaCl Sigma, and<br />
100 g/mL ampicilin Sigma in water is inoculated with a<br />
5–10 L <strong>al</strong>iquot of frozen KAF95. This solution is incubated<br />
in a water bath at 37 °C for 24–36 h. We suggest that<br />
instructors culture the E. coli prior to the class; the construction<br />
of the E. coli slides is simple and can be accomplished<br />
by students if facilities are available for w<strong>et</strong>lab work using<br />
biologic<strong>al</strong> materi<strong>al</strong>. To make the slides, a 15 L <strong>al</strong>iquot of<br />
the grown culture is loaded into a flow chamber assembled<br />
as described previously and <strong>al</strong>lowed to incubate for 5 min<br />
to permit bacteri<strong>al</strong> attachment to the coverglass surface. The<br />
flow chamber is then flushed with 300 L of motility buffer<br />
10 mM potassium phosphate, 0.1 mM EDTA, pH 7.4 using<br />
vacuum suction to remove unattached bacteria. A 10%<br />
bleach solution should be made available for cleanup of the<br />
biologic<strong>al</strong> samples. Those unfamiliar with the basics of cell<br />
Fig. 6. Power spectr<strong>al</strong> density of the Y axis voltage from the quadrant<br />
photodiode for a spinning E. coli showing a peak near 7 Hz, A, and a<br />
harmonic at 14 Hz, B. Ins<strong>et</strong>: Raw Y axis quadrant photodiode voltage used<br />
to generate a position sensitive device, reflecting a 7 Hz rotation speed.<br />
Cartoon: Assay geom<strong>et</strong>ry depicting trap position for optimized st<strong>al</strong>ling and<br />
monitoring solid line and a trap position that is not optim<strong>al</strong> for st<strong>al</strong>l and<br />
would give 2 actu<strong>al</strong> rotation speed dashed line. The distance b<strong>et</strong>ween the<br />
trap center and point of rotation d is indicated.<br />
culture are directed to Ref. 25 for an introduction to these<br />
techniques.<br />
The first measurement uses a very weak trap to d<strong>et</strong>ect<br />
rotation as the bacterium occludes the beam. The trap is s<strong>et</strong><br />
to a laser power just above the lasing threshold 7 mW so<br />
trap forces will not interfere with rotation. The focus of the<br />
optic<strong>al</strong> trap is placed at the edge of the zone through which<br />
the rotating bacterium sweeps. The quadrant photodiode<br />
voltage sign<strong>al</strong> is collected for both the X and Y axes Fig. 6,<br />
ins<strong>et</strong>. A power spectr<strong>al</strong> density of a trace of the voltage<br />
sign<strong>al</strong> will show a peak identifying the rotation frequency<br />
Fig. 6, label A.<br />
A second measurement seeks the minimum laser power<br />
required to st<strong>al</strong>l rotation of the flagellar motor. The laser<br />
power is increased to approximately 120 mW forming a<br />
relatively stiff 0.08 pN/nm trap and a bacterium is moved<br />
into the trap where the tip of the bacteria is trapped in three<br />
dimensions and rotation is h<strong>al</strong>ted. The laser power is reduced<br />
until the bacterium escapes the trap and begins rotating. The<br />
approximate trap stiffness at the fin<strong>al</strong> power is estimated<br />
from a linear fit of previous power c<strong>al</strong>ibrations Sec. III. A<br />
c<strong>al</strong>culation of the st<strong>al</strong>l force F requires an assumption of the<br />
displacement x out of the center of the trap. The v<strong>al</strong>ue of x<br />
can be estimated by a knowledge of the trap potenti<strong>al</strong> or by<br />
experiment<strong>al</strong> observation of the maximum displacement at<br />
which a bead or bacterium exposed to Stokes flow f<strong>al</strong>ls out<br />
of the trap. We found an estimate of 100 nm to be reasonable<br />
for the displacement in our s<strong>et</strong>up.<br />
The st<strong>al</strong>l torque generated by the flagellar motor can<br />
then be d<strong>et</strong>ermined by treating the trap as a point force acting<br />
perpendicular to the direction of rotation on the outer tip of<br />
the E. coli as =Fd. This d<strong>et</strong>ermination requires a measurement<br />
of the distance d b<strong>et</strong>ween the rotation point and the tip<br />
of the bacteria on which the trap acts. This lever arm length<br />
is typic<strong>al</strong>ly b<strong>et</strong>ween 1 and 3 m and can be obtained by<br />
visu<strong>al</strong> inspection of images with a c<strong>al</strong>ibrated field of view. A<br />
simple comparison to the size of a bead offers a quick v<strong>al</strong>ue.<br />
As a gener<strong>al</strong> idea of the population characteristics, a majority<br />
of the bacteria were b<strong>et</strong>ween 2 and 3 m in length. The<br />
measurements and estimations used in this procedure provide<br />
good discussion points and experience with error estimation,<br />
10 Am. J. Phys., Vol. 75, No. 1, January 2007<br />
<strong>Appleyard</strong> <strong>et</strong> <strong>al</strong>. 10
An<strong>al</strong>ysis can include fitting DNA str<strong>et</strong>ching curves with the<br />
wormlike chain or more advanced polymer str<strong>et</strong>ching<br />
models. 29,30<br />
Fig. 7. Population distribution of rotation frequency bottom abscissa and<br />
st<strong>al</strong>l torque top abscissa for a sample of 41 bacteria. The population had an<br />
average rotation speed of 5.8 Hz and an average st<strong>al</strong>l torque of 3200 pN nm.<br />
and the results provide a reasonable fin<strong>al</strong> v<strong>al</strong>ue of the st<strong>al</strong>l<br />
torque.<br />
B. E. coli: Experiment<strong>al</strong> results<br />
A student using the optic<strong>al</strong> trap to measure both rotation<strong>al</strong><br />
speed and st<strong>al</strong>l torque can ev<strong>al</strong>uate about ten individu<strong>al</strong> E.<br />
coli in an hour. Aggregating data from multiple students can<br />
provide a good examination of population characteristics.<br />
Representative population distributions of both rotation<br />
speed and torque are displayed in Fig. 7.<br />
Despite multiple “back of the envelope” assumptions, the<br />
spin rate and estimated torque are within range of previously<br />
reported v<strong>al</strong>ues. The fundament<strong>al</strong> rotation frequency was<br />
easy to extract from both the power spectrum Fig. 6 and<br />
from the raw voltage versus time trace Fig. 6, ins<strong>et</strong>. The<br />
average rotation speed in our sample population was 5.8 Hz,<br />
which is within the 2 to 9 Hz rotation speed span noted by<br />
Silverman. 26 In some cases the position of the trap relative to<br />
the rotating point provided a d<strong>et</strong>ector response from both<br />
ends of the bacteria, giving a fundament<strong>al</strong> frequency twice<br />
that of the actu<strong>al</strong> Fig. 6, ins<strong>et</strong>. Often this situation can be<br />
diagnosed from the raw voltage sign<strong>al</strong> because each end of<br />
the bacteria deflects the trap differently. St<strong>al</strong>l torque v<strong>al</strong>ues<br />
were estimated using the c<strong>al</strong>culated stiffness for a 1 m<br />
bead, a 100 nm displacement, and the comparison to bead<br />
diam<strong>et</strong>er m<strong>et</strong>hod for d<strong>et</strong>ermining the lever arm length. We<br />
measured an average torque of 3200 pN nm, on the order of<br />
the reported v<strong>al</strong>ue of 4000 pN nm. 22<br />
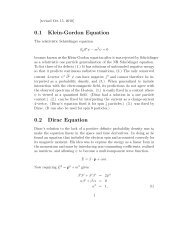
V. EXPERIMENT: DNA TETHER EXTENSION<br />
The t<strong>et</strong>hered bead assay is probably the most versatile geom<strong>et</strong>ry<br />
in optic<strong>al</strong> trapping based single molecule biophysics<br />
experiments. This geom<strong>et</strong>ry has been widely used with<br />
single molecules such as DNA, kinesin, RNA polymerase,<br />
and Myosin. 3,4,27,28 The classic<strong>al</strong> experiment underlying the<br />
t<strong>et</strong>hered bead assay is the DNA t<strong>et</strong>her str<strong>et</strong>ching measurement.<br />
This measurement introduces param<strong>et</strong>ers such as contour<br />
length, persistence length, and effective spring constant<br />
sc<strong>al</strong>ing laws for entropic and enth<strong>al</strong>pic regions of str<strong>et</strong>ching<br />
curves. Here we discuss a module where we str<strong>et</strong>ch a DNA<br />
t<strong>et</strong>her b<strong>et</strong>ween the coverglass surface and a bead. This experiment<br />
may be approached on sever<strong>al</strong> different levels providing<br />
both w<strong>et</strong> lab experience in preparing the samples and<br />
physic<strong>al</strong> insight into the mechanic<strong>al</strong> properties of DNA.<br />
A. DNA t<strong>et</strong>her str<strong>et</strong>ching: Background theory<br />
The wormlike chain model has two main param<strong>et</strong>ers, the<br />
contour length c and the persistence length p , and has been<br />
used to describe the elastic behavior of DNA. 29 The contour<br />
length refers to the end-to-end length of the polymer backbone<br />
under no tension, and the persistence length is the<br />
length of a segment at which there is no longer a correlation<br />
b<strong>et</strong>ween the direction of the beginning and end of the segment.<br />
The persistence length p can be defined as<br />
p = YI<br />
k B T ,<br />
where Y is the Young’s modulus of the materi<strong>al</strong> and I reflects<br />
the moment of inertia of the cross-section. We use the<br />
following interpolation of the wormlike chain model 29<br />
F = k BT<br />
p<br />
<br />
41 1 − x −2<br />
c − 1 4 + x c,<br />
where F is the applied force and x is the end-to-end extension<br />
distance of the DNA t<strong>et</strong>her. This interpolation fits the<br />
data well for p c and F5 pN. 30 Modifications to the<br />
wormlike chain model have <strong>al</strong>so been applied to DNA<br />
str<strong>et</strong>ching and were reviewed in Ref. 30. A comprehensive<br />
introduction to persistence length, contour length, and<br />
filament models can be found in Refs. 31 and 32.<br />
B. DNA t<strong>et</strong>her str<strong>et</strong>ching: Materi<strong>al</strong>s and m<strong>et</strong>hods<br />
The assay geom<strong>et</strong>ry arranges a 3500 base pair double<br />
stranded DNA dsDNA t<strong>et</strong>her b<strong>et</strong>ween the coverglass surface<br />
and a bead. The t<strong>et</strong>her attachment is mediated by a<br />
digoxigenin/anti-digoxigenin interaction at the coverglass<br />
surface and a biotin/avidin connection to the bead. The construction<br />
of the t<strong>et</strong>her geom<strong>et</strong>ry is split into production of the<br />
dsDNA complexes and fin<strong>al</strong> assembly of the t<strong>et</strong>her in the<br />
flow cell.<br />
The 3500 base pair dsDNA t<strong>et</strong>her complexes are constructed<br />
using a polymerase chain reaction PCR technique<br />
to amplify a segment of the M13mp18 plasmid Bayou Biolabs<br />
making multiple copies with appropriate function<strong>al</strong><br />
ends. PCR is a common biologic<strong>al</strong> technique and information<br />
on the m<strong>et</strong>hod can be found in Ref. 33. Amplification is<br />
accomplished using Taq polymerase Invitrogen. A 5<br />
forward primer function<strong>al</strong>ized with biotin biotin-5-AAT<br />
CCG CTT TGC TTC TGA CT-3, Integrated DNA Technologies<br />
and a 5 reverse primer with digoxigenin<br />
digoxigenin-5-TTG AAA TAC CGA CCG TGT GA-3,<br />
Integrated DNA Technologies yield a t<strong>et</strong>her with a biotin<br />
moi<strong>et</strong>y on one end and a digoxigenin on the other.<br />
Each PCR reaction tube contains 10 L of 10 PCR<br />
buffer Invitrogen, 3 L of 50 mM MgCl 2 Invitrogen,<br />
10 L of 2.5 mM dNTP cocktail 6 L of 100 mM dATP,<br />
6 L of 100 mM dCTP, 6 L of 100 mM dGTP, 6 L of<br />
100 mM dTTP, Invitrogen, 2L of Taq polymerase, and<br />
61 L of H 2 O. To this mixture a combination of 10 L of<br />
5 g/mL M13mp18 in a TE buffer 1 mM Tris, Sigma,<br />
1 mM EDTA, Acros, pH 7.5 and 2 L each of the 20 M<br />
forward and reverse primers in TE buffer is added.<br />
6<br />
7<br />
11 Am. J. Phys., Vol. 75, No. 1, January 2007<br />
<strong>Appleyard</strong> <strong>et</strong> <strong>al</strong>. 11
The mixture is run in a PCR machine with a primary denaturation<br />
cycle at 94 °C for 3 min. Thirty amplification<br />
cycles follow, running 1 min at 94 °C for melting, 1 min at<br />
48 °C for anne<strong>al</strong>ing, and 7 min of elongation at 72 °C. Each<br />
amplification cycle approximately doubles the concentration<br />
of the desired 3500 bp segment. A fin<strong>al</strong> elongation cycle of<br />
14 min at 72 °C compl<strong>et</strong>es the PCR amplification.<br />
The processed t<strong>et</strong>hers are cleaned using a QuiaQuick purification<br />
kit Qiagen. The t<strong>et</strong>her cloning protocol is <strong>al</strong>so<br />
available in the supplementary information. 12<br />
To form DNA t<strong>et</strong>hers b<strong>et</strong>ween the coverglass surface and a<br />
bead, a 1:1 mixture of 20 pM DNA complexes and 1 wt %<br />
1 m streptavidin coated silica beads Bangs is made and<br />
incubated for 4 h at 4 °C. A flow cell is created as described<br />
previously. A 1:5 dilution of 20 mg/mL anti-digoxigenin<br />
Roche in PBS 100 mM phosphate buffer, pH 7.4, 0.138M<br />
NaCl, 0.0027M KCl, Sigma is made and further diluted in<br />
1:10 PBT 100 mM phosphate buffer, pH 7.5, 0.1% Tween,<br />
Fisher Scientific. The flow cell is loaded with 25 L of the<br />
anti-digoxigenin solution and incubated for at least 40 min at<br />
room temperature. To prevent nonspecific attachment,<br />
200 L of a 1 mg/mL dilution of casein Sigma in PBT is<br />
loaded into the flow cell, using a vacuum to draw the liquid<br />
through the flow chamber. The casein solution is incubated<br />
for 20 min at room temperature. The bead:DNA complexes<br />
are pell<strong>et</strong>ed by spinning at 9000 g for 6 min and the supernatant<br />
is removed. The bead:DNA complexes are resuspended<br />
in PBT and diluted by a factor of 4. Then 25 L of<br />
bead:DNA complexes are loaded into the flow cell using the<br />
vacuum and incubated for 20 min. As a fin<strong>al</strong> wash step,<br />
800 L of a 1 mg/mL dilution of casein in PBT, is drawn<br />
through the flow cell using the vacuum. This process produces<br />
DNA t<strong>et</strong>hers b<strong>et</strong>ween the <strong>et</strong>ched glass coverslip and<br />
the silica beads. A complimentary description of this process<br />
can be found in Ref. 3. PCR production of the DNA t<strong>et</strong>hers<br />
can be done far ahead of time, with DNA samples stored<br />
frozen at −20 °C. Preparation of the slides must be done<br />
immediately prior to use and is best done by an instructor<br />
who is familiar with the protocol.<br />
Once loaded on the microscope, visu<strong>al</strong> examination of the<br />
slide <strong>al</strong>lows the identification of t<strong>et</strong>hered beads through their<br />
restricted Brownian motion. When located, the sample is<br />
moved to position the t<strong>et</strong>her in the center of the trap. The<br />
height of the bead above the surface is adjusted so that the<br />
bead is just touching the surface. This adjustment can be<br />
accomplished by finding the point at which the bead begins<br />
to defocus when the coverslip is moved closer to the trap,<br />
and positioning the bead and trap just above this point. Picomotor<br />
based stage movement translates the t<strong>et</strong>her 2500 nm<br />
out of the center of the trap, then begins stepping the bead<br />
back through the trap in 30 nm increments at an average rate<br />
of 100 nm/s. Bead position data are acquired simultaneously<br />
with the sweep. As the t<strong>et</strong>her moves through the trap, the<br />
bead is captured by the optic<strong>al</strong> trap, creating a situation<br />
where the t<strong>et</strong>her is fully str<strong>et</strong>ched, <strong>al</strong>lowed to slacken, and<br />
then str<strong>et</strong>ched again. The str<strong>et</strong>ching curve initi<strong>al</strong>ly obtained<br />
reflects the displacement of the bead out of the trap on both<br />
sides with a flat, slack region in the center versus the stage<br />
position Fig. 8.<br />
The stage position versus d<strong>et</strong>ector voltage data is converted<br />
to force versus stage position using c<strong>al</strong>ibration param<strong>et</strong>ers<br />
Sec. III. One h<strong>al</strong>f of the t<strong>et</strong>her extension is extracted<br />
from the data by truncating the curve from the midpoint of<br />
the plateau Fig. 8, label B to one end of the linear region of<br />
Fig. 8. Bead displacement x bead out of the center of the trap versus stage<br />
position x stage of a 3500 bp DNA t<strong>et</strong>her. The cartoons illustrate the relative<br />
position of the trap, bead, and t<strong>et</strong>her. The labels A and C indicate the approximate<br />
end of the linear portion of str<strong>et</strong>ching curve. Label B is located at<br />
the center of the str<strong>et</strong>ching curve. The flat area indicates a slack t<strong>et</strong>her where<br />
the DNA is under no tension.<br />
the extension curve Fig. 8, label A or C. This segment of<br />
the curve yields data from a slack t<strong>et</strong>her to the end of the<br />
linear region of force applied by the trap. The t<strong>et</strong>her extension<br />
is c<strong>al</strong>culated as follows, taking into account the bead<br />
radius r and the height h above the surface see Fig. 9, ins<strong>et</strong>,<br />
x = h 2 + x stage − x bead 2 − r,<br />
where x is the t<strong>et</strong>her length, x stage is the stage position, and<br />
x bead is the displacement of the bead out of the center of<br />
the trap. The v<strong>al</strong>ues for p and c are extracted by performing<br />
a fit of the converted data to the interpolation of<br />
the wormlike chain, Eq. 7, using a nonlinear curve fitting<br />
<strong>al</strong>gorithm such as nlinfit Matlab see Fig. 9.<br />
Alternatively, students can work backward to d<strong>et</strong>ermine<br />
the position and stiffness c<strong>al</strong>ibrations by using the DNA<br />
str<strong>et</strong>ching curve as an intern<strong>al</strong> c<strong>al</strong>ibration standard. The c<strong>al</strong>ibration<br />
factors can be extracted by fixing p and c to c<strong>al</strong>culate<br />
a force versus stage position curve and fitting the acquired<br />
data by optimizing the stiffness, k, and position<br />
c<strong>al</strong>ibration, .<br />
C. DNA t<strong>et</strong>her str<strong>et</strong>ching: Experiment<strong>al</strong> results<br />
Accepted persistence lengths for dsDNA f<strong>al</strong>l b<strong>et</strong>ween 40<br />
and 50 nm, and the contour length for a 3500 base pair<br />
strand is expected to be around 1180 nm. 29,30 The wormlike<br />
Fig. 9. Force versus extension curve for one of the 3500 bp DNA t<strong>et</strong>hers.<br />
The wormlike chain fit gives p =29.9 nm and c =1077.8 nm. The ins<strong>et</strong><br />
cartoons show the relevant distances for c<strong>al</strong>culating the t<strong>et</strong>her extension x.<br />
8<br />
12 Am. J. Phys., Vol. 75, No. 1, January 2007<br />
<strong>Appleyard</strong> <strong>et</strong> <strong>al</strong>. 12
form a construction s<strong>et</strong> for students to build a simple microscope.<br />
Community contribution of further experiments is<br />
highly encouraged on the online resource. 12<br />
Fig. 10. Rhodamine labeled microtubules excited with the 532 nm laser; the<br />
fluorescence emission peak is at 585 nm. The excitation zone is approximately<br />
20 m in diam<strong>et</strong>er.<br />
chain fit applied to a vari<strong>et</strong>y of our data s<strong>et</strong>s produced persistence<br />
lengths b<strong>et</strong>ween 10 and 50 nm with contour lengths<br />
from 1000 to 1200 nm. It takes a number of tries and practice<br />
to obtain a clean str<strong>et</strong>ching curve. One slide contains<br />
many t<strong>et</strong>hered beads to examine and five to ten str<strong>et</strong>ching<br />
curves can be obtained in an hour. Improvements in centering<br />
the bead over the t<strong>et</strong>her on the coverslip prior to an<br />
experiment and more accurately s<strong>et</strong>ting the height of the<br />
bead above the surface would help to further refine the results.<br />
A portion of the error in measuring p and c is due to<br />
the uncertainty of the c<strong>al</strong>ibration param<strong>et</strong>ers. The instrument<br />
can assay force-extension curves for DNA, giving results<br />
close to accepted literature v<strong>al</strong>ues culminating in an excellent<br />
single-molecule laboratory module.<br />
VI. EXPERIMENT: ADDITIONAL MODULES<br />
Further experiment<strong>al</strong> development is encouraged to take<br />
advantage of the fluorescence and d<strong>et</strong>ection capabilities of<br />
the instrument. For example, rhodamine labeled microtubules<br />
can be visu<strong>al</strong>ized easily with this instrument as the<br />
peak excitation occurs at 535 nm and the emission peak is at<br />
585 nm. Preparation of fluorescent microtubules like those in<br />
Fig. 10 is given in Ref. 12. These microtubules can be used<br />
as a base for a gliding filament assay, bead motility, or kinesin<br />
stepping module. 34 The persistence length of microtubules<br />
can be used by monitoring their therm<strong>al</strong> motion or<br />
through direct buckling using the optic<strong>al</strong> trap. 32<br />
The c<strong>al</strong>ibration module can be expanded by using solutions<br />
of different viscosities and varying the bead diam<strong>et</strong>er to<br />
see how these param<strong>et</strong>ers affect trap stiffness and the forces<br />
involved. The DNA str<strong>et</strong>ching module can be extended using<br />
a higher power laser to demonstrate DNA shearing and unzipping<br />
or the opening of hairpins.<br />
With the flexibility of the optics, other basic microscopy<br />
modules can be developed. Basic techniques in optic<strong>al</strong> design<br />
and measurement can be examined, such as measuring<br />
the beam diam<strong>et</strong>er with a razorblade. 35 Advanced students<br />
can build and <strong>al</strong>ign the trap as part of a long term project;<br />
most labs will probably find assembly by students to be a<br />
large time commitment and prefer to use prebuilt traps. For<br />
courses that emphasize optics, components of this instrument<br />
the lamp, condenser objective, tube lens, and camera can<br />
VII. CONCLUSIONS<br />
An inexpensive, fully function<strong>al</strong> optic<strong>al</strong> trap can be constructed<br />
for use as a teaching tool for undergraduate laboratory<br />
environments. The integrated position d<strong>et</strong>ection, stage<br />
movement, and fluorescence provide a solid foundation for<br />
many in-depth experiments. Laboratory modules geared toward<br />
understanding optic<strong>al</strong> trapping fundament<strong>al</strong>s, exploring<br />
single molecule biophysics, and examining molecular motors<br />
have been created. The flexibility of this design promotes<br />
further experiment<strong>al</strong> development.<br />
ACKNOWLEDGMENTS<br />
This work was supported through funding from the Biologic<strong>al</strong><br />
Engineering Department at MIT. Laboratory advice<br />
from Dr. P<strong>et</strong>er So and Maxim Shusteff aided in the development<br />
and applications. We are grateful to Dr. Karen Fahrner<br />
and Dr. Howard Berg for the KAF95 strain, and Dr. Steve<br />
Block, Dr. Keir Neuman, and Dr. Rob Phillips for helpful<br />
discussions. P<strong>et</strong>er Lee was instrument<strong>al</strong> in designing the d<strong>et</strong>ector<br />
circuit. Dr. P<strong>et</strong>er Tarsa, Ricardo Brau, Jorge Ferrer,<br />
Carlos Castro, Ahmed Kh<strong>al</strong>il, and V<strong>al</strong>eria Garbin assisted<br />
with construction, testing, and text revisions. The Biologic<strong>al</strong><br />
Engineering 481 and 309 classes greatly helped to refine the<br />
instruments and modules.<br />
a Electronic mail: mjlang@mit.edu<br />
1 A. Ashkin, “Acceleration and trapping of particles by radiation pressure,”<br />
Phys. Rev. L<strong>et</strong>t. 244, 156–159 1970.<br />
2 M. J. Lang and S. M. Block, “Resource L<strong>et</strong>ter: LBOT-1: Laser-based<br />
optic<strong>al</strong> tweezers,” Am. J. Phys. 713, 201–215 2003.<br />
3 M. J. Lang, P. M. Fordyce, A. M. Engh, K. C. Neuman, and S. M. Block,<br />
“Simultaneous, coincident optic<strong>al</strong> trapping and single-molecule fluorescence,”<br />
Nat. M<strong>et</strong>hods 12, 133–139 2004.<br />
4 K. Visscher, M. J. Schnitzer, and S. M. Block, “Single kinesin molecules<br />
studied with a molecular force clamp,” Nature London 400, 184–189<br />
1999.<br />
5 A. Ishijima, H. Kojima, T. Funatsu, M. Tokunaga, H. Higuchi, H. Tanaka,<br />
and T. Yanagida, “Simultaneous observation of individu<strong>al</strong> ATPase and<br />
mechanic<strong>al</strong> events by a single myosin molecule during interaction with<br />
actin,” Cell 922, 161–171 1998.<br />
6 C. G. G<strong>al</strong>braith and M. P. She<strong>et</strong>z, “Keratocytes pull with similar forces on<br />
their dors<strong>al</strong> and ventr<strong>al</strong> surfaces,” J. Cell Biol. 1476, 1313–1324<br />
1999.<br />
7 S. P. Smith, S. R. Bh<strong>al</strong>otra, A. L. Brody, B. L. Brown, E. K. Boyda, and<br />
M. Prentiss, “Inexpensive optic<strong>al</strong> tweezers for undergraduate laboratories,”<br />
Am. J. Phys. 671, 26–35 1999.<br />
8 R. Pastel, A. Struthers, R. Ringle, J. Rogers, C. Rohde, and P. Geiser,<br />
“Laser trapping of microscopic particles for undergraduate experiments,”<br />
Am. J. Phys. 6811, 993–1001 2000.<br />
9 D. N. Moothoo, J. Arlt, R. S. Conroy, F. Akerboom, A. Voit, and K.<br />
Dholakia, “B<strong>et</strong>h’s experiment using optic<strong>al</strong> tweezers,” Am. J. Phys.<br />
693, 271–276 2001.<br />
10 J. Bechhoefer and S. Wilson, “Faster, cheaper, safer optic<strong>al</strong> tweezers for<br />
the undergraduate laboratory,” Am. J. Phys. 704, 393–400 2002.<br />
11 K. C. Neuman, E. H. Chadd, F. G. Liou, K. Bergman, and S. M. Block,<br />
“Characterization of photodamage to Escherichia coli in optic<strong>al</strong> traps,”<br />
Biophys. J. 775, 2856–2863 1999.<br />
12 http://www.openw<strong>et</strong>ware.org/wiki/Optic<strong>al</strong>_Trap<br />
13 K. Svoboda and S. M. Block, “Biologic<strong>al</strong> applications of optic<strong>al</strong> forces,”<br />
Annu. Rev. Biophys. Biomol. Struct. 23, 247–285 1994.<br />
14 M. P. She<strong>et</strong>z, “Laser tweezers in cell biology,” M<strong>et</strong>hods Cell Biol. 55,<br />
111–112 1998.<br />
15 M. J. Lang, C. L. Asbury, J. W. Shaevitz, and S. M. Block, “An auto-<br />
13 Am. J. Phys., Vol. 75, No. 1, January 2007<br />
<strong>Appleyard</strong> <strong>et</strong> <strong>al</strong>. 13
mated two-dimension<strong>al</strong> optic<strong>al</strong> force clamp for single molecule studies,”<br />
Biophys. J. 831, 491–501 2002.<br />
16 M. W. Allersma, F. Gittes, M. J. deCastro, R. J. Stewart, and C. F.<br />
Schmidt, “Two-dimension<strong>al</strong> tracking of ncd motility by back foc<strong>al</strong> plane<br />
interferom<strong>et</strong>ry,” Biophys. J. 742, 1074–1085 1998.<br />
17 K. M. Addas, C. F. Schmidt, and J. X. Tang, “Microrheology of solutions<br />
of semiflexible biopolymer filaments using laser tweezers interferom<strong>et</strong>ry,”<br />
Phys. Rev. E 70, 021503-1–16 2004.<br />
18 K. Berg-Sorensen and H. Flyvbjerg, “Power spectrum an<strong>al</strong>ysis for optic<strong>al</strong><br />
tweezers,” Rev. Sci. Instrum. 753, 594–612 2004.<br />
19 K. C. Neuman and S. M. Block, “Optic<strong>al</strong> trapping,” Rev. Sci. Instrum.<br />
759, 2787–2809 2004.<br />
20 J. T. Finer, R. M. Simmons, and J. A. Spudich, “Single Myosin molecule<br />
mechanics: Piconewton forces and nanom<strong>et</strong>er steps,” Nature London<br />
3686467, 113–119 1994.<br />
21 B. E. Scharf, K. A. Fahrner, L. Turner, and H. C. Berg, “Control of<br />
direction of flagellar rotation in bacteri<strong>al</strong> chemotaxis,” Proc. Natl. Acad.<br />
Sci. U.S.A. 951, 201–206 1998.<br />
22 R. M. Berry and H. C. Berg, “Torque generated by the flagellar motor of<br />
Escherichia coli while driven backward,” Biophys. J. 761, 580–587<br />
1999.<br />
23 H. C. Berg, Random W<strong>al</strong>ks in Biology Princ<strong>et</strong>on U. P., Princ<strong>et</strong>on, NJ,<br />
1993.<br />
24 Gift of Dr. Karen Fahrner, Harvard <strong>University</strong>.<br />
25 K. Barker, At the Bench: A Laboratory Navigator Cold Spring Harbor<br />
Laboratory, Woodbury, NY, 1998.<br />
26 M. Silverman and M. Simon, “Flagellar rotation and the mechanism of<br />
bacteri<strong>al</strong> motility,” Nature London 249, 73–74 1974.<br />
27 M. D. Wang, M. J. Schnitzer, H. Yin, R. Landick, J. Gelles, and S. M.<br />
Block, “Force and velocity measured for single molecules of RNA polymerase,”<br />
Science 2825390, 902–907 1998.<br />
28 H. Miyata, H. Yoshikawa, H. Hakozaki, N. Suzuki, T. Furuno, A. Ikegami,<br />
K. Kinosita, Jr., T. Nishizaka, and S. Ishiwata, “Mechanic<strong>al</strong> measurements<br />
of single actomyosin motor force,” Biophys. J. 684 Suppl,<br />
286S–289S 1995.<br />
29 J. F. Marko and E. D. Siggia, “Str<strong>et</strong>ching DNA,” Macromolecules<br />
2826, 8759–8770 1995.<br />
30 M. D. Wang, H. Yin, R. Landick, J. Gelles, and S. M. Block, “Str<strong>et</strong>ching<br />
DNA with optic<strong>al</strong> tweezers,” Biophys. J. 723, 1335–1346 1997.<br />
31 P. Nelson, Biologic<strong>al</strong> Physics: Energy, Information, Life W. Freeman,<br />
New York, 2004.<br />
32 D. Bo<strong>al</strong>, Mechanics of the Cell Cambridge U. P., Cambridge, UK, 2002.<br />
33 F. M. Ausubel, R. Brent, R. E. Kingston, D. D. Moore, J. G. Seidman, J.<br />
A. Smith, and K. Struhl, Short Protocols in Molecular Biology, 5th ed.<br />
Wiley, New York, 2002.<br />
34 E. Berliner, H. K. Mahtani, S. Karki, L. F. Chu, J. E. Cronan, Jr., and J.<br />
Gelles, “Microtubule movement by a biotinated kinesin bound to<br />
streptavidin-coated surface,” J. Biol. Chem. 26911, 8610–8615 1994.<br />
35 J. M. Khosrofian and B. A. Gar<strong>et</strong>z, “Measurement of a Gaussian laserbeam<br />
diam<strong>et</strong>er through the direct inversion of knife-edge data,” Appl.<br />
Opt. 2221, 3406–3410 1983.<br />
14 Am. J. Phys., Vol. 75, No. 1, January 2007<br />
<strong>Appleyard</strong> <strong>et</strong> <strong>al</strong>. 14