Visual Physics Analysis VISPA - RWTH Aachen University
Visual Physics Analysis VISPA - RWTH Aachen University
Visual Physics Analysis VISPA - RWTH Aachen University

Create successful ePaper yourself
Turn your PDF publications into a flip-book with our unique Google optimized e-Paper software.
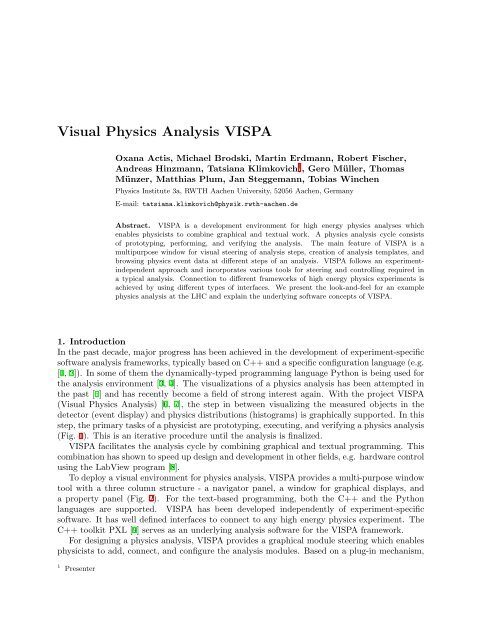
<strong>Visual</strong> <strong>Physics</strong> <strong>Analysis</strong> <strong>VISPA</strong><br />
Oxana Actis, Michael Brodski, Martin Erdmann, Robert Fischer,<br />
Andreas Hinzmann, Tatsiana Klimkovich 1 , Gero Müller, Thomas<br />
Münzer, Matthias Plum, Jan Steggemann, Tobias Winchen<br />
<strong>Physics</strong> Institute 3a, <strong>RWTH</strong> <strong>Aachen</strong> <strong>University</strong>, 52056 <strong>Aachen</strong>, Germany<br />
E-mail: tatsiana.klimkovich@physik.rwth-aachen.de<br />
Abstract. <strong>VISPA</strong> is a development environment for high energy physics analyses which<br />
enables physicists to combine graphical and textual work. A physics analysis cycle consists<br />
of prototyping, performing, and verifying the analysis. The main feature of <strong>VISPA</strong> is a<br />
multipurpose window for visual steering of analysis steps, creation of analysis templates, and<br />
browsing physics event data at different steps of an analysis. <strong>VISPA</strong> follows an experimentindependent<br />
approach and incorporates various tools for steering and controlling required in<br />
a typical analysis. Connection to different frameworks of high energy physics experiments is<br />
achieved by using different types of interfaces. We present the look-and-feel for an example<br />
physics analysis at the LHC and explain the underlying software concepts of <strong>VISPA</strong>.<br />
1. Introduction<br />
In the past decade, major progress has been achieved in the development of experiment-specific<br />
software analysis frameworks, typically based on C++ and a specific configuration language (e.g.<br />
[1, 2]). In some of them the dynamically-typed programming language Python is being used for<br />
the analysis environment [3, 4]. The visualizations of a physics analysis has been attempted in<br />
the past [5] and has recently become a field of strong interest again. With the project <strong>VISPA</strong><br />
(<strong>Visual</strong> <strong>Physics</strong> <strong>Analysis</strong>) [6, 7], the step in between visualizing the measured objects in the<br />
detector (event display) and physics distributions (histograms) is graphically supported. In this<br />
step, the primary tasks of a physicist are prototyping, executing, and verifying a physics analysis<br />
(Fig. 1). This is an iterative procedure until the analysis is finalized.<br />
<strong>VISPA</strong> facilitates the analysis cycle by combining graphical and textual programming. This<br />
combination has shown to speed up design and development in other fields, e.g. hardware control<br />
using the LabView program [8].<br />
To deploy a visual environment for physics analysis, <strong>VISPA</strong> provides a multi-purpose window<br />
tool with a three column structure - a navigator panel, a window for graphical displays, and<br />
a property panel (Fig. 2). For the text-based programming, both the C++ and the Python<br />
languages are supported. <strong>VISPA</strong> has been developed independently of experiment-specific<br />
software. It has well defined interfaces to connect to any high energy physics experiment. The<br />
C++ toolkit PXL [9] serves as an underlying analysis software for the <strong>VISPA</strong> framework.<br />
For designing a physics analysis, <strong>VISPA</strong> provides a graphical module steering which enables<br />
physicists to add, connect, and configure the analysis modules. Based on a plug-in mechanism,<br />
1 Presenter
Figure 1. <strong>Analysis</strong> steps provided by <strong>VISPA</strong>.<br />
modules are already provided for the purpose of reading/writing event data, or for individual user<br />
analysis code. The latter can be coded directly within a corresponding editor. The visualization<br />
of the module steering facilitates verification of the analysis structure and communication<br />
between physicists doing analysis (Fig. 2). For verification of the analysis, <strong>VISPA</strong> provides<br />
an event browser to inspect the overall event structure, to display particle decay cascades, and<br />
the properties of each particle (Fig. 3).<br />
This contribution is organized as follows: first, the underlying C++ toolkit PXL is described.<br />
Then, the Graphical User Interface of <strong>VISPA</strong> and the Event Browser will be discussed. After<br />
this, the design of the analysis within the <strong>VISPA</strong> framework will be explained. Finally, further<br />
developments will be mentioned and different types of interfaces exploited by <strong>VISPA</strong> will be<br />
discussed.<br />
2. The PXL Toolkit<br />
The C++ toolkit PXL (<strong>Physics</strong> eXtension Library) has been developed since 2006 [9]. It is<br />
the successor of the PAX toolkit, which was developed from 2002 to 2007 [10, 11]. In 2009 the<br />
version 2.1 of the PXL toolkit has been released.<br />
PXL provides all necessary features for an experiment-independent high level physics<br />
analysis with emphasis on user-friendly programming syntax. Particularly, PXL enables the<br />
reconstruction of decay trees and the handling of analyses with reconstruction ambiguities. PXL<br />
offers an extensible collection of physics objects, representing particles (pxl::Particle), vertices<br />
(pxl::Vertex) and collisions (pxl::Collision). In the analysis of an event containing reconstructed<br />
data, new information can be added to each object by means of user event data (pxl::UserRecord).<br />
Between all objects, relations can be established, e.g. to build up decay trees, or to associate<br />
reconstructed particles with generated particles. The class pxl::Event represents an entire<br />
physics event and pxl::EventView is a special view of this physics event. These classes act<br />
as containers for physics objects, holding the relations between them, and serve as the standard<br />
interface to algorithms. Copies of these class instances preserve all contained information such<br />
as the relations between particles. These features efficiently support the evaluation of possible<br />
reconstructed particle cascades.<br />
All objects included into the PXL I/O scheme inherit from pxl::Serializable, e.g. an event<br />
container pxl::Event with its physics objects and relations between them. The PXL I/O scheme<br />
can handle the user defined classes which are explicitly included into it. Each file is made up<br />
of isolated compressed binary data chunks which e.g. contain a certain number of events. The<br />
current I/O system is able to handle the files from a local disk. In the future handling files of<br />
the dCache system will be included.
Figure 2. <strong>Analysis</strong> design within the <strong>VISPA</strong> graphical platform.<br />
To enable the usage of all PXL objects and their methods within Python programs, a Python<br />
extension PyPXL is provided (see Section 5.4).<br />
The structure of the PXL toolkit is the following. The core packages are the base library and<br />
the io library. The base library contains classes for relation management, user data handling,<br />
basic containers, etc. The io library has classes for input/output. The hep library contains more<br />
specific classes for high energy physics analysis. For astroparticle physics experiments the astro<br />
library is provided. The packages plugins and modules are especially designed for <strong>VISPA</strong> (see<br />
Sections 3 and 5.3).<br />
3. Graphical User Interface (GUI) of <strong>VISPA</strong><br />
The <strong>VISPA</strong> multi-purpose window serves as the graphical user interface for the design and<br />
steering of analyses, and for the browsing of complete physics events. It provides a common<br />
user interface for these different tasks (Figs. 2, 3).<br />
The Graphical User Interface of <strong>VISPA</strong> is designed as a framework for the applications for<br />
graphical browsing and editing. It has been developed for maximum reusability. The browsers<br />
and editors are plug-ins of the main application which controls the main window. The main<br />
window provides icons for opening and saving data files. By using a tabbed document interface,<br />
several files can be opened in parallel.<br />
The plug-in browsers or editors define the content of the main window. Typically the main<br />
window is split into three views. The graphical compounds, such as views or widgets, are shared<br />
between different plug-ins. For example, the right view is typically a property grid which lists<br />
the properties of an object selected in the center view.<br />
The GUI framework is written in the Python programming language for fast development
Figure 3. The Event Browser within the <strong>VISPA</strong> graphical platform.<br />
turnaround due to dynamic typing and automatic memory management. It is based on Qt [12],<br />
a widely spread cross-platform application and user interface development framework. Due to<br />
its implementation in PyQt [13], <strong>VISPA</strong> has been successfully distributed on Linux, Mac OS X<br />
and Windows based systems.<br />
4. The Event Browser<br />
At the beginning of any analysis it is often useful to inspect the input data. <strong>VISPA</strong> provides<br />
such a tool not only for the input data, but also for inspecting the structure and the contents of<br />
the data at any step of the analysis. The Event Browser is designed as a plug-in of the <strong>VISPA</strong><br />
GUI (see Section 3). Browsing physics event data in <strong>VISPA</strong> allows the verification of physics<br />
analyses on an event-by-event basis (Fig. 3). In the left window a complete content of an event<br />
is represented as a tree. Each object can be explored by selecting it and inspecting its contents<br />
in the property grid on the right-hand side. The user can search or filter objects with respect<br />
to their name, any of their properties, or using a user defined Python script. In addition, the<br />
visualization of decay trees allows to check if all relations have been established correctly. In<br />
the decay tree the particle type (boson, lepton, quark) is indicated by its color and line shape.<br />
To display complex decay trees, the <strong>VISPA</strong> Event Browser incorporates an algorithm for<br />
their proper layout (pxl::AutoLayout). The algorithm is based on a model of physical forces,<br />
like spring forces, or gravity. Each starting point and end point of a particle is provided with<br />
a node subjected to these forces. Using an iterative procedure, the positions of the nodes are<br />
optimized with respect to balanced forces. This algorithm results in a well-distributed view of,<br />
e.g., asymmetric decay trees.
5. <strong>VISPA</strong> Components for Designing a <strong>Physics</strong> <strong>Analysis</strong><br />
In this section, the software tools provided by the <strong>VISPA</strong> environment for prototyping the<br />
analysis will be explained.<br />
5.1. <strong>Analysis</strong> Designer<br />
The <strong>Analysis</strong> Designer is developed as a plug-in of the <strong>VISPA</strong> GUI (see Section 3). The content<br />
of the main window is the following (Fig. 2): the frame on the left-hand side contains the list<br />
of available modules, the main window displays the analysis modules, and the frame on the<br />
right-hand side shows the properties of the item selected in the main window. All objects in<br />
the main frame can be selected and moved like in popular software (drag-and-drop). Icons for<br />
opening and saving data files as well as other analysis modules are provided. It is possible with<br />
double click on, e.g., the input file module to open the data file.<br />
5.2. Module Steering<br />
The design of a physics analysis with <strong>VISPA</strong> is based on the decomposition of an analysis into<br />
modules. Whereas a simple analysis may require only a few modules which are connected serially,<br />
a complex analysis requires more modules and more sophisticated streams of data. The <strong>VISPA</strong><br />
module steering system controls the data flow as well as the selection and settings of analysis<br />
modules. The module selection is based on a plug-in mechanism, guaranteeing extensibility and<br />
efficiency as only libraries for the analysis modules deployed in the current analysis need to be<br />
provided. The data flow is managed by connections between sinks (data input) and sources<br />
(data output) of the respective modules. This permits the usage of multiple data streams as<br />
needed in complex physics analyses.<br />
5.3. <strong>Analysis</strong> Modules<br />
A variety of analysis modules is provided for tasks of different complexity within a physics<br />
analysis. File operations are handled by input and output file modules. For user-demanded<br />
tasks within an analysis, a number of Python scriptable modules are provided, such as event<br />
generator PyGenerator, decision module PyDecide etc.<br />
One of the available modules is the C++ based analysis module AutoProcess. It is developed<br />
for the automated reconstruction of particle cascades, a task arising in the reconstruction of<br />
particles with combinatorial ambiguities [14]. Given a template of a particle decay cascade and<br />
reconstructed particle data as input, this module generates all possible reconstruction versions.<br />
For events simulated with a Monte Carlo generator it supports finding the reconstructed version<br />
corresponding to the correct decay chain. The performance of the module is optimized for low<br />
memory and CPU time consumption.<br />
Other user modules can be written in C++ and steered within <strong>VISPA</strong> module steering system.<br />
5.4. Python Interface<br />
To enable the usage of all PXL objects and their methods within Python programs, a Python<br />
extension PyPXL is provided. A fragment of Python code using PyPXL for jet selection looks<br />
as follows:<br />
for particle in eventview.getParticles():<br />
if (particle.getName() == ’Jet’ and particle.getPt() > 30.):<br />
print ’Jet with Pt > 30.’
Figure 4. Executing the analysis interactively within <strong>VISPA</strong>.<br />
6. <strong>Analysis</strong> Flow in <strong>VISPA</strong><br />
A typical analysis flow within the <strong>VISPA</strong> framework is demonstrated in Fig. 1. In a first step, a<br />
physicist performs an inspection of the input data using the Event Browser (see Section 4). After<br />
this, the design of the analysis chain using the <strong>Analysis</strong> Designer (see Section 5.1) takes place. A<br />
user develops an analysis script in the Python programming language. Any state of the analysis<br />
design can be stored and received back either in XML format or in Python. The analysis can<br />
be executed either in batch mode, or interactively from the <strong>VISPA</strong> graphical window (Fig. 4).<br />
After the execution of the analysis its results can be verified using ROOT [15, 16] histograms.<br />
The output of the analysis modules for particle reconstruction can be checked in the Event<br />
Browser. As an example, the output of the automated reconstruction of particle cascades for<br />
the case of single top production is demonstrated in Fig. 5.<br />
7. Further Developments and Use<br />
In the CMS experiment the <strong>VISPA</strong> GUI (see Section 3) is used as a platform for the Configuration<br />
Browser [17, 18]. This application allows to visually browse and edit the job configuration system<br />
of the CMS experiment.<br />
A further plug-in project which is under development using the <strong>VISPA</strong> GUI is the Edm<br />
Browser [19] - an event browser which allows to inspect the content of CMS data files, event by<br />
event.<br />
Currently the <strong>VISPA</strong> framework is used for different CMS analyses, e.g. a single top<br />
analysis [20], a model independent search, etc. Currently, an interface between the ILC format<br />
and the PXL format is being developed. The framework is also being used for student exercises<br />
within the course “Elementary particle physics” at the <strong>RWTH</strong> <strong>Aachen</strong> <strong>University</strong>.
Figure 5. Verification of analysis results within <strong>VISPA</strong>: output of the AutoProcess module.<br />
8. Connection to Experiments<br />
There are different types of interfaces exploited by <strong>VISPA</strong> to connect to any high energy physics<br />
experiment.<br />
The possibility of performing analyses in any experiment is provided by an interface based<br />
on the C++ toolkit PXL (Section 2). Any experiment specific data can be stored in the<br />
experiment independent PXL I/O format using the pxl:Event, a general container to hold all<br />
relevant information of a high energy physics event.<br />
The Python interface to the software classes from different experiments allows to use <strong>VISPA</strong><br />
graphical tools in combination with data from any experiment, by means of introspection. For<br />
instance, <strong>VISPA</strong> accesses PXL classes through PyPXL. The Edm Browser from CMS inspects<br />
in this manner the content of CMS data files using the PyEDM.<br />
The third interface to experiments provided by <strong>VISPA</strong> is the GUI framework of <strong>VISPA</strong> which<br />
allows to create graphical browsing and editing applications as plug-ins of the main application.<br />
The examples of such applications are the Event Browser and the <strong>Analysis</strong> Designer in <strong>VISPA</strong>,<br />
the Configuration Browser and the Edm Browser at CMS.<br />
9. Support<br />
All the software is continuously maintained, fully documented and available online [7, 9].<br />
Recently the version 0.1.3 of <strong>VISPA</strong> and the version 2.1.3 of PXL have been released. There are<br />
installers provided for Windows, Mac OS X and Debian/Ubuntu platforms.
10. Conclusion<br />
A physics analysis environment, <strong>VISPA</strong>, has been presented. <strong>VISPA</strong> facilitates prototyping,<br />
performing, and verifying a physics data analysis by combining graphical and textual<br />
programming. It provides the so far missing graphical support for physicists in the step between<br />
displaying events, and visualizing physics distributions.<br />
11. Acknowledgements<br />
We are very grateful for financial support of the Ministerium für Innovation,Wissenschaft,<br />
Forschung und Technologie des Landes Nordrhein-Westfalen, the Bundesministerium für Bildung<br />
und Forschung (BMBF), the Deutsche Forschungsgemeinschaft (DFG) and Helmholtz Alliance<br />
“<strong>Physics</strong> at the Terascale”.<br />
References<br />
[1] A. B. Meyer [H1 Collaboration], A new object-oriented physics analysis framework for the H1 experiment,<br />
Prepared for International Europhysics Conference on High-Energy <strong>Physics</strong> (HEP 2001), Budapest,<br />
Hungary, 12-18 Jul 2001.<br />
[2] F. Fabozzi, C. D. Jones, B. Hegner and L. Lista, <strong>Physics</strong> analysis tools for the CMS experiment at LHC,<br />
CERN-CMS-NOTE-2008-015.<br />
[3] G. Barrand, M. Frank, P. Mato, E. de Oliveira, A. Tsaregorodtsev and I. Belyaev, Python-based physics<br />
analysis environment for LHCb, In Interlaken 2004, Computing in high energy physics and nuclear physics,<br />
377-380.<br />
[4] C. D. Jones, L. Luca and B. Hegner, <strong>Analysis</strong> Environments for CMS, J. Phys. Conf. Ser. 119 (2008) 032027.<br />
[5] B. Ferrero Merlino, The LHC++ environment, CERN-OPEN-2000-191.<br />
[6] O. Actis et al., <strong>Visual</strong> <strong>Physics</strong> <strong>Analysis</strong> (<strong>VISPA</strong>) - Concepts and First Applications, arXiv:0810.3609<br />
[physics.data-an]<br />
[7] <strong>VISPA</strong> (<strong>Visual</strong> <strong>Physics</strong> <strong>Analysis</strong>), http://vispa.sourceforge.net<br />
[8] National Instruments, LabView, http://www.ni.com/labview<br />
[9] M. Erdmann, G. Mueller, J. Steggemann, <strong>Physics</strong> eXtension Library 2.0, http://pxl.sourceforge.net<br />
[10] M. Erdmann, D. Hirschbuehl, Y. Kemp, P. Schemitz and T. Walter, User oriented design in high energy<br />
physics applications: <strong>Physics</strong> analysis expert, Prepared for 14th Topical Conference on Hadron Collider<br />
<strong>Physics</strong> (HCP 2002), Karlsruhe, Germany, 29 Sep - 4 Oct 2002<br />
[11] S. Kappler et al., The PAX toolkit and its applications at Tevatron and LHC, IEEE Trans. Nucl. Sci. 53<br />
(2006) 506 [arXiv:physics/0512232]<br />
[12] Qt - A cross-platform application and UI framework, http://www.qtsoftware.com<br />
[13] PyQt, http://www.riverbankcomputing.co.uk/software/pyqt<br />
[14] O. Actis et al., Automated Reconstruction of Particle Cascades in High Energy <strong>Physics</strong> Experiments,<br />
arXiv:0801.1302 [physics.data-an]<br />
[15] R. Brun and F. Rademakers, ROOT: An object oriented data analysis framework, Nucl. Instrum. Meth. A<br />
389 (1997) 81<br />
[16] ROOT, http://root.cern.ch<br />
[17] Configuration Browser for CMS, https://twiki.cern.ch/twiki//bin/view/CMS/SWGuideConfigBrowser<br />
[18] M. Erdmann, R. Fischer, B. Hegner, A. Hinzmann, T. Klimkovich, G. Müller, J. Steggemann, <strong>Visual</strong>isation<br />
of the CMS Python Configuration System, Prepared for 17th International Conference on Computing in<br />
High Energy and Nuclear <strong>Physics</strong> (CHEP 2009), Prague, Czech Republic, 21 - 27 March 2009<br />
[19] Edm Browser for CMS, https://twiki.cern.ch/twiki//bin/view/CMS/SWGuideEdmBrowser<br />
[20] G. Müller Development and Application of a Novel Graphical Environment for <strong>Physics</strong> Data <strong>Analysis</strong> with<br />
the CMS Experiment, Diploma thesis, September 2008