

Reliability Report -- 1999 - Pennsylvania Public Utility Commission
Reliability Report -- 1999 - Pennsylvania Public Utility Commission
Reliability Report -- 1999 - Pennsylvania Public Utility Commission

You also want an ePaper? Increase the reach of your titles
YUMPU automatically turns print PDFs into web optimized ePapers that Google loves.
SECTION 3 – STATISTICAL UTILITY PERFORMANCE DATA<br />
Statewide Summary<br />
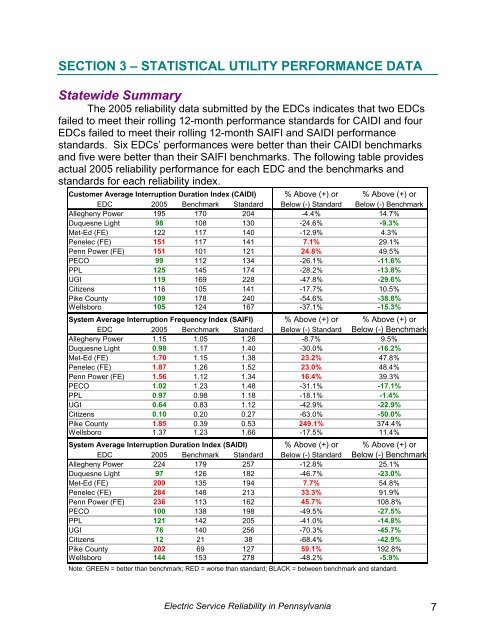
The 2005 reliability data submitted by the EDCs indicates that two EDCs<br />
failed to meet their rolling 12-month performance standards for CAIDI and four<br />
EDCs failed to meet their rolling 12-month SAIFI and SAIDI performance<br />
standards. Six EDCs’ performances were better than their CAIDI benchmarks<br />
and five were better than their SAIFI benchmarks. The following table provides<br />
actual 2005 reliability performance for each EDC and the benchmarks and<br />
standards for each reliability index.<br />
Customer Average Interruption Duration Index (CAIDI) % Above (+) or % Above (+) or<br />
EDC 2005 Benchmark Standard Below (-) Standard Below (-) Benchmark<br />
Allegheny Power 195 170 204 -4.4% 14.7%<br />
Duquesne Light 98 108 130 -24.6% -9.3%<br />
Met-Ed (FE) 122 117 140 -12.9% 4.3%<br />
Penelec (FE) 151 117 141 7.1%<br />
29.1%<br />
Penn Power (FE) 151 101 121 24.8%<br />
49.5%<br />
PECO 99 112 134 -26.1% -11.6%<br />
PPL 125 145 174 -28.2% -13.8%<br />
UGI 119 169 228 -47.8% -29.6%<br />
Citizens 116 105 141 -17.7% 10.5%<br />
Pike County 109 178 240 -54.6% -38.8%<br />
Wellsboro 105 124 167 -37.1% -15.3%<br />
System Average Interruption Frequency Index (SAIFI) % Above (+) or % Above (+) or<br />
EDC 2005 Benchmark Standard Below (-) Standard Below (-) Benchmark<br />
Allegheny Power 1.15 1.05 1.26 -8.7% 9.5%<br />
Duquesne Light 0.98 1.17 1.40 -30.0% -16.2%<br />
Met-Ed (FE) 1.70 1.15 1.38 23.2%<br />
47.8%<br />
Penelec (FE) 1.87 1.26 1.52 23.0%<br />
48.4%<br />
Penn Power (FE) 1.56 1.12 1.34 16.4%<br />
39.3%<br />
PECO 1.02 1.23 1.48 -31.1% -17.1%<br />
PPL 0.97 0.98 1.18 -18.1% -1.4%<br />
UGI 0.64 0.83 1.12 -42.9% -22.9%<br />
Citizens 0.10 0.20 0.27 -63.0% -50.0%<br />
Pike County 1.85 0.39 0.53 249.1%<br />
374.4%<br />
Wellsboro 1.37 1.23 1.66 -17.5% 11.4%<br />
System Average Interruption Duration Index (SAIDI) % Above (+) or % Above (+) or<br />
EDC 2005 Benchmark Standard Below (-) Standard Below (-) Benchmark<br />
Allegheny Power 224 179 257 -12.8% 25.1%<br />
Duquesne Light 97 126 182 -46.7% -23.0%<br />
Met-Ed (FE) 209 135 194 7.7%<br />
54.8%<br />
Penelec (FE) 284 148 213 33.3%<br />
91.9%<br />
Penn Power (FE) 236 113 162 45.7%<br />
108.8%<br />
PECO 100 138 198 -49.5% -27.5%<br />
PPL 121 142 205 -41.0% -14.8%<br />
UGI 76 140 256 -70.3% -45.7%<br />
Citizens 12 21 38 -68.4% -42.9%<br />
Pike County 202 69 127 59.1%<br />
192.8%<br />
Wellsboro 144 153 278 -48.2% -5.9%<br />
Note: GREEN = better than benchmark; RED = worse than standard; BLACK = between benchmark and standard.<br />
Electric Service <strong>Reliability</strong> in <strong>Pennsylvania</strong> 7


