

Reliability Report -- 1999 - Pennsylvania Public Utility Commission
Reliability Report -- 1999 - Pennsylvania Public Utility Commission
Reliability Report -- 1999 - Pennsylvania Public Utility Commission

Create successful ePaper yourself
Turn your PDF publications into a flip-book with our unique Google optimized e-Paper software.
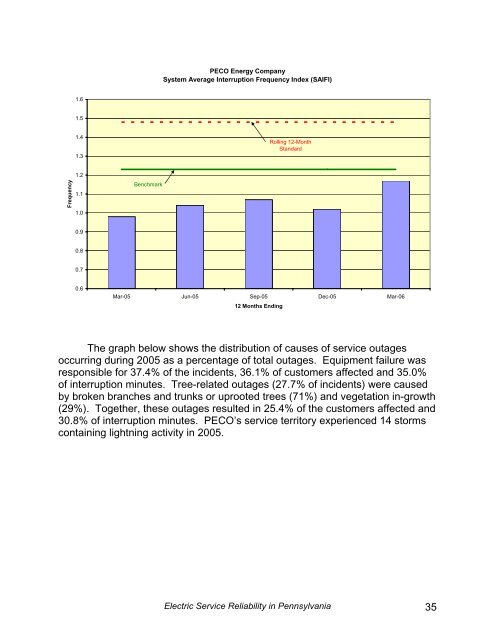
PECO Energy Company<br />
System Average Interruption Frequency Index (SAIFI)<br />
1.6<br />
1.5<br />
1.4<br />
1.3<br />
Rolling 12-Month<br />
Standard<br />
Frequency<br />
1.2<br />
1.1<br />
1.0<br />
Benchmark<br />
0.9<br />
0.8<br />
0.7<br />
0.6<br />
Mar-05 Jun-05 Sep-05 Dec-05 Mar-06<br />
12 Months Ending<br />
The graph below shows the distribution of causes of service outages<br />
occurring during 2005 as a percentage of total outages. Equipment failure was<br />
responsible for 37.4% of the incidents, 36.1% of customers affected and 35.0%<br />
of interruption minutes. Tree-related outages (27.7% of incidents) were caused<br />
by broken branches and trunks or uprooted trees (71%) and vegetation in-growth<br />
(29%). Together, these outages resulted in 25.4% of the customers affected and<br />
30.8% of interruption minutes. PECO’s service territory experienced 14 storms<br />
containing lightning activity in 2005.<br />
Electric Service <strong>Reliability</strong> in <strong>Pennsylvania</strong> 35


