QIAGEN N.V. Annual Report 2001
QIAGEN N.V. Annual Report 2001
QIAGEN N.V. Annual Report 2001

Create successful ePaper yourself
Turn your PDF publications into a flip-book with our unique Google optimized e-Paper software.
<strong>QIAGEN</strong> N.V. <strong>Annual</strong> <strong>Report</strong> <strong>2001</strong><br />
<strong>QIAGEN</strong> N.V.<br />
<strong>Annual</strong> <strong>Report</strong> <strong>2001</strong>
Contents<br />
2 <strong>Report</strong> of the Supervisory Board<br />
4 Letter from the Managing Board<br />
6 <strong>QIAGEN</strong> — Focusing the Power<br />
of Life Sciences<br />
16 Contents — Financial Data<br />
<strong>QIAGEN</strong> is the world’s leading provider of innovative<br />
technologies for purifying, separating, and<br />
handling DNA and RNA — the genetic blueprints<br />
of life. Since 1984, <strong>QIAGEN</strong> has successfully<br />
developed, produced, and marketed an everincreasing<br />
range of proprietary products for<br />
academic, industrial, and clinical research.<br />
With the sequencing of the entire human genome in<br />
2000, new applications in the life sciences are<br />
rapidly emerging. The developing genomics,<br />
proteomics, and cellomics markets are fueling<br />
applications such as real-time PCR, microarray<br />
analysis for gene and drug discovery, DNA- and<br />
RNA-based molecular diagnostics, and genetic<br />
vaccination and gene therapy. The knowledge<br />
that could result — for example, full characterization<br />
of mutations in a cancer patient’s tumor — may<br />
allow clinicians to develop drug treatments<br />
personalized for each patient. This will lead to<br />
more effective treatments, as well as reducing the<br />
time and expense of developing new drugs by<br />
improving our understanding of the mode of drug<br />
action. However, these emerging applications<br />
share crucial prerequisites — technologies that<br />
enable the handling, extraction, and purification of<br />
DNA and RNA.<br />
<strong>QIAGEN</strong> is uniquely positioned to take full<br />
advantage of the wealth of commercial opportunities<br />
presented by the life science industry. Already<br />
a leader in the life science research market, in<br />
<strong>2001</strong> <strong>QIAGEN</strong> strengthened its position in<br />
the genomics, proteomics, cellomics, molecular<br />
diagnostics, and gene therapy markets through<br />
development of innovative products, strategic<br />
alliances with key commercial players, and the<br />
acquisition of the Sawady group of companies.<br />
<strong>2001</strong> was a year of momentum for <strong>QIAGEN</strong><br />
and our traditions of innovation, quality, and service<br />
continued to be key factors for growth and success<br />
in the Company’s core business — technologies<br />
and products for the purification, separation, and<br />
handling of nucleic acids.
Financial Highlights<br />
Financial Highlights<br />
Net Sales<br />
280,000<br />
260,000<br />
Pro Forma<br />
Net Income<br />
240,000<br />
220,000<br />
38,000<br />
36,000<br />
200,000<br />
180,000<br />
US$ per share<br />
0.26<br />
Pro Forma<br />
Diluted Earnings per Share<br />
in US$ thousands<br />
34,000<br />
32,000<br />
30,000<br />
28,000<br />
26,000<br />
24,000<br />
22,000<br />
20,000<br />
18,000<br />
16,000<br />
1996 1997 1998 1999 2000 <strong>2001</strong><br />
0.24<br />
14,000<br />
0.22<br />
12,000<br />
0.20<br />
10,000<br />
0.18<br />
8,000<br />
0.16<br />
6,000<br />
0.14<br />
4,000<br />
0.12<br />
2,000<br />
0.10<br />
0<br />
0.08<br />
1996 1997 1998 1999 * 2000 ** <strong>2001</strong> ***<br />
0.06<br />
0.04<br />
0.02<br />
0.00<br />
1996 1997 1998 1999 * 2000 ** <strong>2001</strong> ***<br />
in US$ thousands<br />
160,000<br />
140,000<br />
120,000<br />
100,000<br />
80,000<br />
60,000<br />
40,000<br />
20,000<br />
0<br />
1<br />
* Excluding the effect of purchased in-process research and development related to the acquisition of Rapigene, Inc.<br />
** Excluding the effect of one-time charges related to the acquisition of Operon Technologies, Inc.<br />
*** Excluding the effect of one-time charges as well as expenses related to the acquisition of the Sawady Group
<strong>Report</strong> of the Supervisory Board<br />
<strong>QIAGEN</strong> Supervisory Board with <strong>QIAGEN</strong> Managing Board<br />
Dr. Metin Colpan Peer M. Schatz Prof. Dr. Detlev H. Riesner Dr. Heinrich Hornef Prof. Dr. jur. Carsten P. Claussen<br />
(Chief Executive (Chief Financial (Chairman) (Vice Chairman) (Special Advisor and<br />
Officer) Officer) Honorary Chairman)<br />
2<br />
Dear Fellow Shareholders,<br />
The Supervisory Board exercised supervision over the Managing Board’s policies and business conduct<br />
throughout the financial year. Acting in the best interests of the Company and its business and consistent<br />
with past practice, the Supervisory Board monitored the Company’s activities, including its strategic,<br />
economic, and market developments, R&D investments, acquisitions and alliances, and human resources<br />
management. Information on the Company’s activities was communicated by the Managing Board to the<br />
Supervisory Board through regular meetings and business reports. It was again an exciting year for<br />
<strong>QIAGEN</strong> N.V. and the Supervisory Board thanks <strong>QIAGEN</strong>'s Managing Board and employees for their<br />
contributions to <strong>QIAGEN</strong>'s success in <strong>2001</strong>.<br />
<strong>QIAGEN</strong> N.V. is a company organized under the laws of the Netherlands and has an international network<br />
of subsidiaries. The Supervisory Board follows the principle of increasing shareholder value to further the<br />
interests of all shareholders, and has endeavored since 1997 to comply with the 40 recommendations made<br />
in the report of the Netherlands Committee on Corporate Governance. It is Company policy to follow the<br />
guidelines for Good Practice of Corporate Governance as described in this report although some minor<br />
deviations may result from effects such as legal requirements. In addition, in February 2002, <strong>QIAGEN</strong>’s<br />
Supervisory Board decided to adopt the recommendations of the new German Corporate Governance<br />
Code, and intends to comply with its recommendations or explain in the <strong>QIAGEN</strong> 2002 <strong>Annual</strong> <strong>Report</strong><br />
deviations such as might be required by Dutch law, Dutch practice, incurred or intended for instance on the<br />
basis of decisions previously made by <strong>QIAGEN</strong> shareholders.<br />
<strong>QIAGEN</strong> N.V. is a limited liability company incorporated under the laws of the Netherlands. All Company<br />
operations are carried out in accordance with Dutch Corporate Law, U.S. Federal Securities Law and<br />
Regulations, and the laws of the German capital market, in particular the Börsengesetz and the<br />
Wertpapierhandelsgesetz. The common shares of the Company are registered and traded in the United<br />
States of America on the Nasdaq National Market and in Germany on the Neuer Markt division of the<br />
Frankfurt Stock Exchange. The majority of the Company’s shares are believed to be held by shareholders<br />
in the United States and in Europe, particularly Germany.
<strong>Report</strong> of the Supervisory Board<br />
Erik Hornnaess Prof. Dr. Manfred Karobath Jochen Walter Dr. Franz A. Wirtz<br />
3<br />
The Company practices non-distribution of net income, as is common among relatively young, fast-growing<br />
companies with significant future growth potential in rapidly growing fields. This policy benefits shareholders<br />
by increasing share value, and we believe it to be in line with shareholders’ taxation preferences.<br />
In this <strong>Annual</strong> <strong>Report</strong> the Financial Statements for the year <strong>2001</strong> are presented, as prepared by the<br />
Managing Board. These statements have been audited by Arthur Andersen LLP (Independent Public<br />
Accountants) and examined and approved by the Supervisory Board. We recommend that the general<br />
meeting of shareholders adopts these Financial Statements, including allocation of profits to retained<br />
earnings, at the <strong>Annual</strong> General Meeting of Shareholders.<br />
The term of office of the members of the Supervisory Board expires as of the close of the <strong>Annual</strong> General<br />
Meeting of Shareholders of <strong>QIAGEN</strong> N.V. to be held on June 14, 2002. Prof. Dr. Detlef H. Riesner,<br />
Dr. Heinrich Hornef, Erik Hornnaess, Prof. Dr. Manfred Karobath, Jochen Walter, and Dr. Franz A. Wirtz will<br />
stand for re-election. Prof. Dr. jur Carsten P. Claussen has agreed to continue to serve as Special Advisor and<br />
Honorary Chairman.<br />
The Supervisory Board proposes that the Managing Directors Dr. Metin Colpan, Chief Executive Officer,<br />
and Peer M. Schatz, Chief Financial Officer, be re-elected as members of the Managing Board at the <strong>Annual</strong><br />
General Meeting of Shareholders on June 14, 2002.<br />
Venlo, The Netherlands, April 2002<br />
Prof. Dr. Detlev H. Riesner<br />
Chairman of the Supervisory Board
Letter from the Managing Board<br />
4 Dr. Metin Colpan<br />
Chief Executive Officer<br />
Peer M. Schatz<br />
Chief Financial Officer
Letter from the Managing Board<br />
To Our Shareholders,<br />
We are pleased to inform you that <strong>2001</strong> was another successful year for <strong>QIAGEN</strong>, in which we continued<br />
our strong growth and expanded our market and technology leadership. We continued our 16-year history<br />
of ongoing growth, increasing net sales by 22% to $263.8 million in <strong>2001</strong> over 2000. In 2000 net income<br />
increased to $34.4 million, representing 64% growth over 2000. Excluding one-time charges amounting to<br />
$5.4 million related to the acquisition of Operon Technologies, Inc., now <strong>QIAGEN</strong> Operon, Inc., in 2000<br />
and one-time charges and expenses amounting to $3.0 million related to the acquisition of the Sawady group<br />
of companies in <strong>2001</strong>, and without considering any other impacts related to the Sawady acquisition, the<br />
growth in consolidated net income would have been over 37%. In <strong>2001</strong> diluted earnings per share<br />
increased 71% to $0.24.<br />
<strong>QIAGEN</strong>’s successful growth is based on the systematic development of new and innovative products, while<br />
continuing to enhance our quality, services, and support. Our broad technology platform and excellent R&D<br />
team are the key drivers of our expanding product portfolio. In <strong>2001</strong>, <strong>QIAGEN</strong> expanded its product<br />
portfolio targeting the life science market by launching 17 new innovative products focused on separation,<br />
purification, and handling of nucleic acids — including the PAXgene Blood RNA System, the first product from<br />
PreAnalytiX, <strong>QIAGEN</strong>’s joint venture with Becton, Dickinson and Company.<br />
5<br />
<strong>QIAGEN</strong> is very well positioned as a key supplier to researchers applying techniques in modern life science<br />
disciplines such as functional genomics, proteomics, and cellomics to develop new therapies and diagnostics.<br />
Our leading position in the molecular biology research market and ”gold-standard” technologies for nucleic<br />
acid separation, purification, and handling are also being successfully expanded into the rapidly growing<br />
markets of molecular diagnostics and gene therapy. The acquisition of the Sawady group of companies places<br />
<strong>QIAGEN</strong> in a strong position in the Japanese genomics market, bringing to Japan the products and<br />
services provided by <strong>QIAGEN</strong> Operon in both North America and Europe. This global network allows us to<br />
vigorously pursue the rapidly growing opportunities in the life sciences in all key geographical markets.<br />
We are proud of the entrepreneurial spirit and proven commitment of more than 1,500 <strong>QIAGEN</strong><br />
employees all over the world, which drive our penetration into our growing target markets and enable us to<br />
supply our customers with consistently high-quality products and services. In the coming year, we will continue<br />
to develop new, innovative products for collecting, purifying, handling, and analyzing nucleic acids, and<br />
successfully bring them to market. The quality of <strong>QIAGEN</strong> products and services and the efficiency of our<br />
sales channels should strengthen our strategic position as the key provider of critical tools for the life science<br />
revolution. We are looking forward to a bright and dynamic future for <strong>QIAGEN</strong>.<br />
Thank you for your interest in <strong>QIAGEN</strong>. We are looking forward to reporting our future successes.<br />
Venlo, The Netherlands, April 2002 Venlo, The Netherlands, April 2002<br />
Dr. Metin Colpan<br />
Peer M. Schatz<br />
Chief Executive Officer<br />
Chief Financial Officer
<strong>QIAGEN</strong> — Focusing the Power of Life Sciences<br />
The large and expanding market for nucleic acid purification is highly segmented. Many technologies are<br />
needed for efficient purification of different types of nucleic acids from various sample sources and for a<br />
range of applications. <strong>QIAGEN</strong> occupies a unique position in the market since it is able to apply its broad<br />
technology portfolio to create innovative products, targeted to specialized requirements in each of the<br />
market’s numerous segments.<br />
<strong>QIAGEN</strong> Product Dimensions<br />
6
<strong>QIAGEN</strong> — Focusing the Power of Life Sciences<br />
Now that the human genome has been deciphered,<br />
scientists have a new challenge — to describe the<br />
functions of the identified genes. Researchers all over<br />
the world are racing to understand how our genes<br />
influence the development of a wide range of human<br />
diseases, and are seeking to use this knowledge<br />
to develop strategies for more effective diagnostics<br />
and disease treatment, and ultimately for disease<br />
prevention.<br />
Opportunities for <strong>QIAGEN</strong> are constantly expanding<br />
as the pharmaceutical and biotechnology industries<br />
compete to make use of the wealth of genetic<br />
information now available. New applications for<br />
genetic analysis are being developed as fields<br />
of research such as genomics, proteomics, and<br />
cellomics accelerate the pace of discovery in<br />
diagnostics and therapeutics. As speed in innovation<br />
is becoming more and more critical, fast, accurate,<br />
and reliable tools for these applications are essential<br />
for success.<br />
<strong>QIAGEN</strong> is a leading provider of high-quality<br />
products and services needed to collect, purify, and<br />
handle nucleic acids for a wide range of applications.<br />
Our products allow nucleic acids to be efficiently<br />
purified for subsequent use in a wide range of<br />
applications, such as cloning, transfection, RT-PCR,<br />
sequencing, high-throughput PCR, SNP detection,<br />
and microarray analysis. Our core expertise is a<br />
requirement in almost any application involving<br />
analysis or modification of nucleic acids. In <strong>2001</strong>,<br />
<strong>QIAGEN</strong> further broadened its impressive technology<br />
portfolio and expanded its range of products for<br />
many exciting new applications and markets.<br />
in DNA and RNA. The demand for highly pure<br />
nucleic acid starting materials increases as<br />
molecular applications become more sophisticated<br />
and sensitive, using techniques such as microarrays<br />
or advanced microfluidics for quantitative and<br />
qualitative genetic analyses. Proteomic and cellomic<br />
studies, for example, heavily rely on nucleic acid<br />
purification tools to confirm their results by<br />
identification of the underlying genes. As the<br />
world’s leading supplier of products and services<br />
for purifying and handling nucleic acids, <strong>QIAGEN</strong><br />
is very well positioned to continue its major role in<br />
providing the tools for success in the life sciences.<br />
The need for <strong>QIAGEN</strong> technologies in these new<br />
markets and applications will continue to grow.<br />
<strong>QIAGEN</strong> expects to add even more strength to its<br />
core activities and expand its presence in the<br />
molecular biology research market — the birthplace<br />
of new applications — as we continue to develop<br />
and supply a wide range of new technologies for<br />
emerging applications in the exciting new fields of<br />
research in the life sciences.<br />
<strong>QIAGEN</strong>’s leading technologies<br />
provide integrated solutions<br />
7<br />
These exciting developments in the life sciences<br />
require a deep understanding of the functions and<br />
interactions of genes and proteins, and detailed<br />
knowledge about the genetic information encoded
The Life Science Research Market<br />
8<br />
Like the millions of water droplets that make up a cloud, a human<br />
chromosome is made up of millions of nucleotides, the basic units of<br />
DNA. The separation, purification, and handling of DNA and RNA are crucial<br />
for decoding their genetic information, and fundamental to life science<br />
research. <strong>QIAGEN</strong> offers a broad range of products to researchers around<br />
the world for both nucleic acid isolation and nucleic acid analysis.
<strong>QIAGEN</strong> — Focusing the Power of Life Sciences<br />
The life science research market is the birthplace<br />
of new technologies and applications for drug<br />
development, molecular diagnostics, and gene<br />
therapy that form the biotech marketplace. As such,<br />
it is <strong>QIAGEN</strong>’s most strategically important market.<br />
Academic and industrial life science researchers<br />
are <strong>QIAGEN</strong>’s core customers — it is for their<br />
applications that most of our tools and technologies<br />
are initially developed and standardized. As their<br />
applications and techniques evolve for use in<br />
the more demanding commercial biotech<br />
market, <strong>QIAGEN</strong>’s experiences from the research<br />
markets demonstrate proven technological<br />
excellence. <strong>QIAGEN</strong> has a broad portfolio of core<br />
technologies to serve this important market. We<br />
offer technologies to purify and separate nucleic<br />
acids from a wide range of starting materials —<br />
from simple bacteria to complex plants, cells,<br />
tissues, and clinical samples — and to address the<br />
many and varied throughput and purity needs of<br />
our customers. This comprehensive range of core<br />
technologies provides the high-quality building<br />
blocks needed to develop specialized <strong>QIAGEN</strong><br />
products to meet the demands of the diverse<br />
customers in the life science market.<br />
In <strong>2001</strong>, <strong>QIAGEN</strong> launched 17 new products for<br />
the life science research market, some of which<br />
are already used in drug development and<br />
molecular diagnostic applications. These include<br />
new applications of our core technologies for<br />
nucleic acid purification and handling, as well as<br />
new technologies for downstream applications for<br />
purified nucleic acids and proteins which can<br />
benefit from a direct and seamless integration into<br />
our core products. <strong>QIAGEN</strong> introduced several<br />
new products for PCR, including products and kits<br />
for quantitative real-time PCR and RT-PCR analysis.<br />
These kits are the first in a line of new products that<br />
provide the accurate quantification of DNA and<br />
RNA essential for gene expression analysis.<br />
<strong>QIAGEN</strong> also expanded its market and technology<br />
leading product portfolio in protein expression,<br />
purification, and analysis.<br />
<strong>QIAGEN</strong> will continue to develop and introduce<br />
new products for life science research, to take full<br />
advantage of the growing opportunities and<br />
expand its strong position in this strategically<br />
important market.<br />
<strong>QIAGEN</strong>’s customer base<br />
in the research market.<br />
9
10<br />
Next Generation Drug Discovery: Genomics — Proteomics
— Cellomics<br />
<strong>QIAGEN</strong> — Focusing the Power of Life Sciences<br />
Genomic studies are yielding vast amounts of<br />
information and providing insights into the<br />
functions and interactions of individual genes —<br />
knowledge essential for detailed understanding of<br />
human diseases and development of biopharmaceutical<br />
drugs. Reliable methods for purification of<br />
high-quality nucleic acids are a prerequisite for<br />
genomic analyses and studies, and <strong>QIAGEN</strong>’s<br />
core technologies are dedicated to answering this<br />
need. In <strong>2001</strong>, <strong>QIAGEN</strong> expanded its position in<br />
the genomics market by forming strategic alliances<br />
with companies such as KREATECH Biotechnology<br />
B.V. and Genicon Sciences Corporation, developing<br />
key enabling technologies for genomics to create<br />
and commercialize new multi-analyte detection<br />
technologies.<br />
Gene functions are mediated by proteins, whose<br />
properties, biological functions, and roles in<br />
disease must be characterized and understood.<br />
This understanding is being achieved through studies<br />
of protein-protein interaction and complexes to<br />
characterize entire proteomes. Accurate and<br />
complete protein characterization is based on<br />
detailed genomic information that must be verified<br />
by confirming the identity of the encoding gene<br />
sequence. Proteomic studies will be a major<br />
challenge for biomedical research in the next<br />
decade, complementing and linking with disciplines<br />
such as genetics, cell and molecular biology, protein<br />
chemistry, structural biology, and bioinformatics.<br />
<strong>QIAGEN</strong> produces a wide range of leading<br />
products for expression, purification, separation,<br />
and analysis of recombinant proteins, all of<br />
which are important tools for proteomics, and<br />
many of which are today setting the standard for<br />
research in these fields. In addition, <strong>QIAGEN</strong>’s core<br />
technologies for nucleic acid purification, separation,<br />
and handling are the basic tools for the genetic<br />
analyses that are integral to proteomic studies.<br />
Both genomics and proteomics have led to<br />
dramatic progress in our understanding of the<br />
chemistry of life and the study of disease processes<br />
to develop new drugs. They focus on studying<br />
genes and proteins in vitro, while diseases develop<br />
in living cells. Cellomics is the study of chemical<br />
and molecular interactions of cellular components,<br />
or the ”cellome”, and focuses on understanding the<br />
effect of drugs on the entire cell. This highly<br />
complex information must be verified by supporting<br />
proteomic and genomic analyses. <strong>QIAGEN</strong><br />
recently introduced its first products linking cell<br />
separation with nucleic acid purification.<br />
<strong>QIAGEN</strong>’s core technologies are essential tools for<br />
genomic, proteomic, and cellomic studies, and we<br />
look forward to continuing to provide technology<br />
leadership and the highest quality support to the<br />
life sciences in the future.<br />
<strong>QIAGEN</strong> provides<br />
high-quality products for<br />
modern drug development<br />
11
12<br />
The Molecular Diagnostics Market
<strong>QIAGEN</strong> — Focusing the Power of Life Sciences<br />
DNA- and RNA-based diagnostic testing has<br />
revolutionized the detection and analysis of many<br />
common disorders, including infectious diseases,<br />
genetic diseases, and cancer. These molecular<br />
diagnostic testing methods are believed to represent<br />
the next generation of diagnostic products since<br />
they are highly sensitive and specific and generally<br />
yield results more rapidly than conventional<br />
techniques. Increased sensitivity and speed are<br />
invaluable for diagnosing infectious disease, where<br />
the timing and accuracy of diagnosis can have a<br />
significant effect on treatment. Application of<br />
molecular techniques is leading to earlier diagnoses<br />
of diseases such as cancer, more accurate<br />
prognoses, and better monitoring of the effects of<br />
therapy. Molecular techniques are also improving<br />
forensic and identity studies, and food and<br />
environment testing.<br />
<strong>QIAGEN</strong>’s core nucleic acid purification technologies<br />
are proven tools for use in molecular diagnostic<br />
assays. <strong>QIAGEN</strong> is currently expanding its product<br />
range to meet the increasing requirement in clinical<br />
laboratories for standardized, reliable procedures<br />
in sample handling. In <strong>2001</strong>, PreAnalytiX, a joint<br />
venture formed between <strong>QIAGEN</strong> and Becton,<br />
Dickinson and Company, launched its first product,<br />
the PAXgene Blood RNA System, an integrated and<br />
standardized system for collection of whole blood<br />
samples and stabilization and purification of their<br />
RNA. PreAnalytiX is focused on creating a family of<br />
products for collection of a wide range of sample<br />
types, with stabilization and purification of their<br />
nucleic acids. The PreAnalytiX product line is<br />
designed as a flexible and standardized system for<br />
all molecular diagnostic systems.<br />
Blood collected using the PAXgene System yields<br />
intact, stable RNA suitable for use in gene expression<br />
analyses. Accurate analysis of gene expression in<br />
vivo provides important insights into gene<br />
regulation and can improve understanding of<br />
disease states and patients’ responses to drug<br />
therapy. Research has shown that messenger<br />
RNA levels and patterns change during sample<br />
collection, transport, and processing unless the<br />
RNA is stabilized. These artificially induced<br />
changes in the levels of the messenger RNA in an<br />
unstabilized sample make analyses of gene<br />
expression meaningless. Use of the PAXgene<br />
System stabilizes the RNA and freezes the gene<br />
expression profile at the time the blood is drawn,<br />
greatly reducing the likelihood of artifactual results.<br />
<strong>QIAGEN</strong> believes that applications for its<br />
products for sample collection together with nucleic<br />
acid stabilization and purification will expand<br />
significantly as the molecular diagnostics market<br />
increasingly adopts nucleic acid-based testing.<br />
<strong>QIAGEN</strong> uses a range of<br />
marketing strategies in the<br />
molecular diagnostics market<br />
13
14<br />
The Gene Therapy Market
<strong>QIAGEN</strong> — Focusing the Power of Life Sciences<br />
Knowledge about the genetic contribution to<br />
common disorders such as cancer, heart disease,<br />
and inherited diseases is increasing rapidly. Gene<br />
therapy aims to use this knowledge to target certain<br />
genes whose expression can be modified to<br />
treat, cure, or ultimately prevent disease. To interact<br />
with the faulty genes, therapeutic genes are<br />
transferred into the cells of living organisms, usually<br />
using a biological or molecular vector to ensure<br />
efficient delivery.<br />
Plasmid DNA is increasingly being used as the<br />
vector system of choice for gene therapy due to its<br />
increased safety and reduced manufacturing costs<br />
in comparison to viral vectors. The FDA and other<br />
regulatory agencies require that plasmid DNA<br />
intended for use in humans is manufactured to<br />
cGMP-grade (current Good Manufacturing Practice<br />
grade) and is endotoxin-free. pAlliance, a strategic<br />
alliance between <strong>QIAGEN</strong>, DSM Biologics, a unit<br />
of DSM N.V., and Valentis, provides contract<br />
manufacturing of bulk quantity plasmid DNA under<br />
full cGMP conditions. The service includes contract<br />
manufacturing of products for any scale, from<br />
preclinical toxicology studies to commercial<br />
products. pAlliance is today considered the<br />
world’s leading consortium for contract cGMP<br />
manufacturing services, thanks to the excellent<br />
technology, infrastructure, and marketing strength<br />
of the alliance members.<br />
<strong>QIAGEN</strong> today serves a number of leading<br />
pharmaceutical companies. The first mover position<br />
and the long-standing expertise of <strong>QIAGEN</strong> as the<br />
supplier of consumables and pAlliance as the<br />
service provider ensure <strong>QIAGEN</strong>’s strong position<br />
in the gene therapy market, supplying customers<br />
who test gene therapy drug candidates in clinical<br />
trials. Ultimately, <strong>QIAGEN</strong> and pAlliance intend to<br />
supply customers who manufacture and sell genetic<br />
vaccination and gene therapy products as validated<br />
and approved products.<br />
<strong>QIAGEN</strong> products and<br />
services targeting the<br />
gene therapy market<br />
15<br />
In <strong>2001</strong>, pAlliance announced that it would<br />
manufacture plasmid DNA-based materials for<br />
vaccines, for use in clinical trials run by the<br />
Wyeth-Lederle Vaccines business unit of Wyeth.<br />
This is one of the largest agreements made by<br />
pAlliance since its initiation in early 1999.
Contents — Financial Data<br />
17 Selected Consolidated Financial Data<br />
18 Operating and Financial Review and Prospects<br />
Overview<br />
Results of Operations<br />
Fiscal Year Ended December 31, <strong>2001</strong> compared to 2000<br />
Fiscal Year Ended December 31, 2000 compared to 1999<br />
Liquidity and Capital Resources<br />
16<br />
Business Factors<br />
Quantitative and Qualitative Disclosures About Market Risk<br />
Interest Rate Risk<br />
Currency Fluctuations<br />
Currency Hedging<br />
Foreign Currency Exchange Rate Risk<br />
28 <strong>Report</strong> of Independent Public Accountants<br />
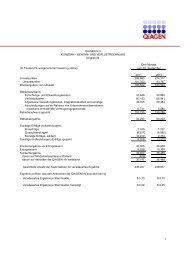
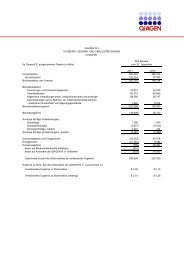
29 Consolidated Balance Sheets<br />
31 Consolidated Statements of Income<br />
32 Consolidated Statements of Shareholders’ Equity and Comprehensive Income<br />
33 Consolidated Statements of Cash Flows<br />
36 Notes to Consolidated Financial Statements<br />
56 Balance Sheets<br />
57 Statements of Income<br />
57 Notes to Financial Statements<br />
60 Auditors’ <strong>Report</strong><br />
61 Statutory Profit Appropriation<br />
62 Executive Officers and Supervisory Directors<br />
64 Audit and Compensation Committees<br />
64 Market Information<br />
67 Shareholder Information<br />
67 Securities and Exchange Commission Form 20-F
SELECTED CONSOLIDATED FINANCIAL DATA<br />
(AMOUNTS IN THOUSANDS, EXCEPT PER SHARE DATA)<br />
THE INFORMATION BELOW SHOULD BE READ IN CONJUNCTION WITH THE CONSOLIDATED FINANCIAL<br />
STATEMENTS (AND NOTES THEREON) AND ”OPERATING AND FINANCIAL REVIEW AND PROSPECTS.”<br />
Year Ended December 31,<br />
<strong>2001</strong><br />
2000<br />
1999<br />
1998<br />
1997<br />
Consolidated Statement of Income Data:<br />
Net sales<br />
$ 263,770<br />
$ 216,802<br />
$ 158,155<br />
$ 120,804<br />
$ 75,370<br />
Cost of sales<br />
79,673<br />
65,436<br />
45,836<br />
38,141<br />
20,421<br />
Gross profit<br />
184,097<br />
151,366<br />
112,319<br />
82,663<br />
54,949<br />
Operating Expenses:<br />
Research and development<br />
Sales and marketing<br />
General and administrative<br />
Acquisition costs<br />
In-process research and development<br />
26,769<br />
64,830<br />
36,022<br />
3,000<br />
–<br />
23,372<br />
54,931<br />
31,177<br />
5,353<br />
–<br />
17,813<br />
39,948<br />
26,110<br />
–<br />
5,100<br />
13,432<br />
32,744<br />
20,569<br />
–<br />
–<br />
8,250<br />
23,193<br />
15,277<br />
–<br />
–<br />
17<br />
Total operating expenses<br />
130,621<br />
114,833<br />
88,971<br />
66,745<br />
46,720<br />
Income from operations<br />
53,476<br />
36,533<br />
23,348<br />
15,918<br />
8,229<br />
Other income, net<br />
2,847<br />
2,591<br />
1,640<br />
2,885<br />
5,235<br />
Income before provision for income<br />
taxes and minority interest<br />
56,323<br />
39,124<br />
24,988<br />
18,803<br />
13,464<br />
Provision for income taxes<br />
21,896<br />
18,085<br />
10,950<br />
5,489<br />
4,157<br />
Minority interest<br />
8<br />
36<br />
149<br />
148<br />
(31)<br />
Net income<br />
$ 34,419<br />
$ 21,003<br />
$ 13,889<br />
$ 13,166<br />
$ 9,338<br />
Basic net income per common share 1<br />
$ 0.24<br />
$ 0.15<br />
$ 0.10<br />
$ 0.09<br />
$ 0.07<br />
Diluted net income per common share 1<br />
$ 0.24<br />
$ 0.14<br />
$ 0.10<br />
$ 0.09<br />
$ 0.07<br />
Weighted average number of common<br />
shares used to compute basic net<br />
income per common share<br />
142,962<br />
142,040<br />
140,317<br />
139,716<br />
137,287<br />
Weighted average number of common<br />
shares used to compute diluted net<br />
income per common share<br />
145,055<br />
145,071<br />
142,186<br />
141,300<br />
139,615<br />
<strong>2001</strong><br />
2000<br />
1999<br />
1998<br />
1997<br />
Consolidated Balance Sheet Data:<br />
Cash and cash equivalents<br />
$ 56,460<br />
$ 24,008<br />
$ 12,393<br />
$ 6,555<br />
$ 4,451<br />
Working capital<br />
$ 119,448<br />
$ 101,527<br />
$ 57,275<br />
$ 46,235<br />
$ 38,936<br />
Total assets<br />
$ 356,968<br />
$ 240,893<br />
$ 154,331<br />
$ 110,487<br />
$ 82,025<br />
Total long-term liabilities,<br />
including current portion<br />
$ 88,333<br />
$ 29,320<br />
$ 17,930<br />
$ 8,227<br />
$ 7,821<br />
Total shareholders’ equity<br />
$ 212,975<br />
$ 167,356<br />
$ 96,872<br />
$ 76,230<br />
$ 56,402<br />
Common shares<br />
$ 1,458<br />
$ 1,450<br />
$ 1,435<br />
$ 2,417<br />
$ 2,380<br />
Shares outstanding<br />
143,464<br />
142,548<br />
140,815<br />
139,888<br />
137,426<br />
1<br />
Computed on the basis described for net income per common share in Note 4 of the ”Notes to Consolidated Financial Statements”.
OPERATING AND FINANCIAL REVIEW AND PROSPECTS<br />
THIS SECTION CONTAINS A NUMBER OF FORWARD-LOOKING STATEMENTS. THESE STATEMENTS ARE BASED<br />
ON CURRENT MANAGEMENT EXPECTATIONS, AND ACTUAL RESULTS MAY DIFFER MATERIALLY. AMONG THE<br />
FACTORS THAT COULD CAUSE ACTUAL RESULTS TO DIFFER FROM MANAGEMENT’S EXPECTATIONS ARE THOSE<br />
DESCRIBED IN ”BUSINESS FACTORS” BELOW.<br />
OVERVIEW<br />
18<br />
<strong>QIAGEN</strong> N.V. (the Company) believes that it is the world’s leading provider of innovative enabling technologies and<br />
products for the separation and purification of nucleic acids based on the nature of its products and technologies and<br />
as supported by independent market studies. The Company was established to develop, manufacture and market a<br />
broad portfolio of proprietary technologies and products, which meet the needs of the academic and industrial<br />
research markets. <strong>QIAGEN</strong>’s products enable customers to reliably and rapidly produce high purity nucleic acids<br />
without using hazardous reagents or expensive equipment.<br />
On March 31, <strong>2001</strong>, the Company completed the acquisition of the Sawady group of companies located in Tokyo,<br />
Japan in a pooling of interests transaction. The Company believes that the Sawady Group has built a very strong<br />
reputation and position as the second largest suppliers of synthetic nucleic acids in Japan. The Company intends to<br />
leverage <strong>QIAGEN</strong> Operon’s technology-leading position in synthetic nucleic acids with the strong market position that<br />
the Sawady Group has created in Japan to address this rapidly expanding market. <strong>QIAGEN</strong> believes that the<br />
worldwide market for synthetic nucleic acid products is growing rapidly.<br />
On June 28, 2000, the Company acquired Operon Technologies, Inc., since renamed <strong>QIAGEN</strong> Operon, Inc.<br />
(Operon) of Alameda, California in a transaction that was accounted for as a pooling of interests. Operon<br />
manufactures and markets synthetic nucleic acids, DNA microarrays and synthetic genes. The synthetic nucleic acids<br />
are used in the analysis of nucleic acids purified from natural sources and have been integrated into the Company’s<br />
current genomics and genetic analysis business. <strong>QIAGEN</strong> Operon GmbH in Cologne, Germany commenced<br />
operations in <strong>2001</strong> to provide European customers with the same products offered by Operon in the U.S.<br />
In December 1999, the Company completed the purchase of Rapigene, Inc. (renamed <strong>QIAGEN</strong> Genomics, Inc.), a<br />
leader in the area of innovative, enabling technologies and services for single nucleotide polymorphism (SNP)<br />
analysis. In 1999, the Company also made several strategic equity investments in and alliances with businesses<br />
whose technologies are complementary to the Company’s business.<br />
Since 1997, the Company has had compound annual growth of approximately 37% in net sales and 45% in net<br />
income, after acquisition charges. To date, the Company has funded its growth through internally generated funds,<br />
debt, the private sale of equity, and through proceeds from the sale of securities to the public.
RESULTS OF OPERATIONS<br />
The following table sets forth certain income and expense items as a percentage of net sales for the periods indicated:<br />
<strong>2001</strong><br />
2000<br />
1999<br />
Net sales<br />
100.0%<br />
100.0%<br />
100.0%<br />
Cost of sales<br />
30.2<br />
30.2<br />
29.0<br />
Gross profit<br />
69.8<br />
69.8<br />
71.0<br />
Operating expenses:<br />
Research and development<br />
10.1<br />
10.8<br />
11.3<br />
Sales and marketing<br />
24.6<br />
25.3<br />
25.3<br />
General and administrative<br />
13.7<br />
14.4<br />
16.5<br />
Acquisition costs<br />
1.1<br />
2.5<br />
–<br />
In-process research and development<br />
.–<br />
. –<br />
3.1<br />
Income from operations<br />
Other income<br />
20.3<br />
1.1<br />
16.8<br />
1.2<br />
14.8<br />
1.0<br />
19<br />
Income before provision for income<br />
taxes and minority interest<br />
21.4<br />
18.0<br />
15.8<br />
Provision for income taxes<br />
8.3<br />
8.3<br />
6.9<br />
Minority interest<br />
.–<br />
–<br />
0.1<br />
Net income<br />
13.1%<br />
9.7%<br />
8.8%<br />
In <strong>2001</strong>, without the $3.0 million acquisition charge related to the Sawady group of companies, income from<br />
operations for that year would have been 21.4% and net income would have been 13.7%, as a percentage of net<br />
sales. Excluding the acquisition costs of $5.4 million in 2000 related to Operon Technologies, the percentage for<br />
income from operations would have been 19.3% and net income would have been 12.2%, as a percentage of net sales.<br />
In 1999, without the $5.1 million charge for purchased in-process research and development, income from operations<br />
for that year would have been 17.9% and net income would have been 11.9%, as a percentage of net sales.<br />
FISCAL YEAR ENDED DECEMBER 31, <strong>2001</strong> COMPARED TO 2000<br />
Net Sales. Net sales in <strong>2001</strong> increased 22% to $263.8 million from $216.8 million in the same period of 2000.<br />
Net sales in the United States increased 22% (or $25.2 million) to $142.4 million in <strong>2001</strong> from $117.2 million in<br />
2000, and net sales outside the United States increased 22% (or $21.8 million) to $121.4 million in <strong>2001</strong> from<br />
$99.6 million in 2000. Net sales within and outside of the United States increased principally due to increased unit<br />
sales of consumable and instrumentation products to existing and new customers. Unit sales increases were attributable<br />
to focused marketing efforts and a sales force that continues to actively identify and service customer needs.<br />
The increase within the United States was primarily attributable to net sales at <strong>QIAGEN</strong>, Inc., located in Valencia,<br />
California and <strong>QIAGEN</strong> Operon, Inc. (Operon) located in Alameda, California. <strong>QIAGEN</strong>, Inc. reported an increase<br />
of 18% (or $16.9 million) in <strong>2001</strong> over 2000 and Operon reported an increase of 31% (or $6.3 million). Outside<br />
of the United States, the increase in net sales was primarily due to growth at <strong>QIAGEN</strong> GmbH, located in Germany,<br />
which reported an increase in net sales of 42% (or $12.2 million), <strong>QIAGEN</strong> Ltd, located in England, which reported<br />
an increase of 36% (or $4.3 million) and <strong>QIAGEN</strong> K.K., located in Japan, which reported and increase of 26% (or<br />
$4.9 million) for <strong>2001</strong> compared to 2000, offset by a decrease of 12% (or $1.1 million) which was recorded by<br />
<strong>QIAGEN</strong> Instruments AG, located in Switzerland. The decrease of sales at <strong>QIAGEN</strong> Instruments reflected a shift in<br />
sales strategy, which resulted in a reduction of net sales by <strong>QIAGEN</strong> Instruments to OEM clients. This reduction was<br />
more than offset by increased intercompany sales to other <strong>QIAGEN</strong> companies for further resale of the instruments<br />
as <strong>QIAGEN</strong>-branded products.
While subsidiaries continue to report increased sales of consumable and instrumentation products, the Company<br />
continues to expect, as disclosed in previous filings, a slower rate of sales growth for the range of products designed<br />
for large-scale plasmid DNA applications as their market matures. The Company continually introduces new products<br />
in order to extend the life of its existing product lines as well as to address new market opportunities. During <strong>2001</strong>,<br />
the Company released over 25 new products including ProofStart DNA Polymerase — a high-fidelity proofreading<br />
enzyme, the QIAexpress ® UA Cloning Kit — for direct cloning of PCR products into an expression vector for the<br />
production of 6xHis-tagged proteins and the QuantiTect SYBR ® Green PCR and RT-PCR Kits, for highly specific and<br />
sensitive quantitative PCR and RT-PCR. During 2000, the Company released over 20 new products.<br />
Changes in exchange rates continued to affect the growth rate of net sales. A significant portion of the Company’s<br />
revenues is denominated in European Union euros. Using identical foreign exchange rates for both periods, net sales<br />
in <strong>2001</strong> would have increased approximately 25% (or $54.5 million), as compared to the reported increase of 22%<br />
(or $47.0 million). See ”Currency Fluctuations.”.<br />
20<br />
Gross Profit. Gross profit was $184.1 million or 70% of net sales in <strong>2001</strong> as compared to $151.4 million or 70% of<br />
net sales in 2000. The absolute dollar increase is attributable to the increase in net sales. The Company’s separation<br />
and purification consumable products carry a higher gross profit than many of the Company’s other products, such<br />
as instrumentation and synthetic nucleic acid products. Fluctuations in the product mix can lead to fluctuations in gross<br />
profit. The Company continues to develop additional instrumentation products that meet the needs of the molecular<br />
diagnostic and genomics markets and anticipates future increases in sales of instrumentation products. Additionally,<br />
with the establishment of <strong>QIAGEN</strong> Operon GmbH, located in Germany, and the March 31, <strong>2001</strong> acquisition of the<br />
Sawady group of companies, located in Japan, the Company expects growth in the European and Japanese markets<br />
of its synthetic nucleic acid products through these subsidiaries.<br />
Research and Development. Research and development expenses increased 15% to $26.8 million (10% of net sales) in<br />
<strong>2001</strong> compared with $23.4 million (11% of net sales) in 2000. As the Company continues expansion of its research<br />
and development facilities and new product development capabilities, additional research and development expense<br />
will be incurred related to facility costs and obtaining and retaining employees for the research and development<br />
efforts. The Company’s U.S. research and development facility located in Germantown, Maryland, on which construction<br />
is substantially complete, is anticipated to include research and development activities. As of December 31, <strong>2001</strong>,<br />
the Company employed 328 research and development personnel. The Company has a strong commitment to research<br />
and development, as demonstrated by the recent expansion of the German research facility along with the new U.S.<br />
facility, and anticipates that absolute research and development expenses will continue to increase significantly.<br />
Sales and Marketing. Sales and marketing expenses increased 18% to $64.8 million (25% of net sales) in <strong>2001</strong> from<br />
$54.9 million (25% of net sales) in 2000. The increase in sales and marketing expenses reflects the Company’s<br />
continued expansion of its sales force and advertising efforts in connection with the sale of its existing products and<br />
the introduction of new products. Such efforts contributed to the growth in net sales in <strong>2001</strong>. Increased sales and<br />
marketing costs are primarily associated with personnel, commissions, advertising, publications, freight and logistics<br />
expenses and other promotional items. The Company has recently completed the pilot phase of a Customer<br />
Relationship Management system (CRM). While this project has required investment, the Company believes that the<br />
developed and implemented systems will allow significant increases of productivity in areas including sales and<br />
marketing. During <strong>2001</strong>, the Company increased its sales force by approximately 30%. Sales and marketing<br />
expenses attributed to the Company’s newest subsidiaries, <strong>QIAGEN</strong> Operon GmbH and <strong>QIAGEN</strong> S.p.A. and<br />
<strong>QIAGEN</strong> Genomics, Inc. totaled $3.5 million in <strong>2001</strong> compared to $1.1 million in 2000. The Company anticipates<br />
that selling and marketing costs will continue to increase along with new product introductions and continued growth<br />
in sales of the Company’s products.<br />
General and Administrative. General and administrative expenses increased 16% to $36.0 million (14% of net sales)<br />
in <strong>2001</strong> from $31.2 million (14% of net sales) in 2000. General and administrative expenses attributed to the<br />
Company’s principal production and manufacturing operations at <strong>QIAGEN</strong> GmbH, <strong>QIAGEN</strong> Instruments AG,
Operon, and <strong>QIAGEN</strong> Sciences, Inc. (the Company’s newest U.S. facility), totaled $20.3 million in <strong>2001</strong> compared<br />
to $13.9 million in 2000. This absolute dollar increase primarily represents the increased costs related to the support<br />
of the Company’s growing administrative infrastructure that is expanding to accommodate the Company’s continued<br />
growth. Additionally, during the year, the allowance for doubtful accounts was increased in line with the increases in<br />
sales and accounts receivable. Further, during <strong>2001</strong> <strong>QIAGEN</strong> Instruments (acquired in 1998) and Operon (acquired<br />
in 2000) began to apply policies in evaluating the adequacy of their allowance for doubtful accounts that are more<br />
consistent with the Company’s overall historic valuation policies, and their allowances for doubtful accounts were<br />
increased accordingly. In <strong>2001</strong>, the allowance for doubtful accounts was increased by approximately $1.4 million.<br />
The increase in general and administrative expenses was partially offset by the reversal of a retirement allowance at<br />
Sawady of approximately $2.0 million that is no longer a liability of the subsidiary.<br />
Acquisition Costs. On March 31, <strong>2001</strong>, the Company acquired the Sawady group of companies located in Tokyo,<br />
Japan. Acquisition and related charges were approximately $3.0 million, which include approximately $1.0 million<br />
of direct transaction costs, (primarily legal and other professional fees) and approximately $2.0 million primarily<br />
relating to the relocation, closure and elimination of leased facilities, such as duplicate field offices.<br />
Other Income (Expense). Other income was $2.8 million in <strong>2001</strong> compared to $2.6 million in 2000. This increase<br />
was mainly due to decreased interest expense, increased income from research and development grants, and a<br />
gain on foreign currency transactions, partially offset by decreased interest income and a higher loss on equity<br />
method investee.<br />
Interest expense decreased to $991,000 in <strong>2001</strong> compared to $1.6 million in 2000. This decrease is due to the<br />
capitalization of interest related to the new German and U.S. facility construction in accordance with Financial<br />
Accounting Standard No. 34. For the year ended December 31, <strong>2001</strong>, approximately $2.2 million of interest cost<br />
was capitalized. There was no capitalized interest in 2000. Actual interest costs increased primarily as a result of the<br />
Company’s additional long-term borrowings related to the new facility construction.<br />
In the <strong>2001</strong>, research and development grant income from European as well as German state and federal<br />
government grants increased to $1.5 million from $1.2 million in 2000. The Company conducts significant research<br />
and development activities in Germany, and expects to continue to apply for such research and development grants<br />
in the future.<br />
Gain/loss on foreign currency transactions was a gain of $31,000 in <strong>2001</strong> and a loss of $231,000 in 2000.<br />
Income from foreign currency transactions reflects net effects from conducting business in currencies other than the<br />
U.S. dollar. <strong>QIAGEN</strong> N.V.’s functional currency is the U.S. dollar and its subsidiaries’ functional currencies are the<br />
European Union euro, the British pound, the Swiss franc, the U.S. dollar, the Australian dollar, the Canadian dollar,<br />
and the Japanese yen. See ”Currency Fluctuations.”.<br />
In <strong>2001</strong>, interest income decreased to $1.8 million from $3.0 million in 2000. Interest income is derived mainly from<br />
the Company’s investment of funds in investment grade, interest-bearing marketable securities. As of December 31,<br />
<strong>2001</strong>, the Company had approximately $22.5 million invested in such securities compared to $37.3 million at<br />
December 31, 2000. The weighted average interest rates on the Company’s marketable securities portfolio ranged<br />
from 4.48% to 5.75% in <strong>2001</strong>, compared to 5.75% to 6.78% in 2000.<br />
In <strong>2001</strong>, the Company recorded net losses from equity method investees of $1.4 million compared to $870,000 in<br />
2000. The Company had two equity investments at December 31, <strong>2001</strong> and anticipates that these investments will<br />
continue to generate losses at least through 2002. One of these investments, PreAnalytiX, launched its first product,<br />
the PAXgene Blood RNA System, in April <strong>2001</strong>. The PAXgene Blood RNA System is intended to minimize the chronic<br />
problems associated with preanalytical process variability and to eliminate much of the unpredictability that has been a<br />
critical limitation in RNA analysis. As previously disclosed, the Company intends to continue to make strategic investments<br />
in complementary businesses as the opportunities arise. Accordingly, the Company may continue to record losses on<br />
equity investments in start-up companies based on the Company’s ownership interest in such companies.<br />
Other miscellaneous income increased to income of $1.9 million in <strong>2001</strong> from $1.1 million in 2000, primarily due<br />
to the approximate $1.3 million net gain on the sales of marketable securities <strong>2001</strong>.<br />
21
Provision for Income Taxes. The Company’s effective tax rate decreased to 39% in <strong>2001</strong> from 46% in 2000. The<br />
Company’s operating subsidiaries are exposed to effective tax rates ranging from approximately 8% to approximately<br />
50%. The decrease is due to the lack of a tax benefit associated with the acquisition costs in 2000. Without the<br />
acquisition costs in 2000, the Company’s effective tax rate would have been 41%. Further, fluctuation in the<br />
distribution of pre-tax income among the subsidiaries can lead to fluctuations of the effective tax rate in the Company’s<br />
consolidated financial statements.<br />
Minority Interest. Previously, the Company had a 60% interest in its Japanese subsidiary, <strong>QIAGEN</strong> K.K., and a 50%<br />
interest in Rosys Instruments, Inc. (Rosys Inc.), a subsidiary of the Company’s wholly owned subsidiary <strong>QIAGEN</strong><br />
Instruments AG. <strong>QIAGEN</strong> Instruments AG sold its interest in Rosys, Inc. in June 2000, and the Company acquired<br />
the minority shareholders’ interest in <strong>QIAGEN</strong> K.K. during the first quarter of <strong>2001</strong>. The financial position and<br />
results of operations of these subsidiaries are included in the Company’s consolidated financial statements for the<br />
applicable periods.<br />
FISCAL YEAR ENDED DECEMBER 31, 2000 COMPARED TO 1999<br />
22<br />
Net Sales. In 2000, net sales increased 37% (or $58.6 million) to $216.8 million compared to $158.2 million in 1999.<br />
All subsidiaries reported increased sales over the prior period. The majority of the Company’s sales continue to be<br />
attributable to the Company’s consumable products, which experienced strong growth worldwide during the year.<br />
Net sales in the United States increased 34% (or $29.6 million) to $117.2 million in 2000 from $87.6 million<br />
in 1999. Outside the United States, net sales increased 41% (or $29.0 million) to $99.6 million in 2000 from<br />
$70.6 million in 1999. Net sales within and outside of the United States increased principally due to increased unit<br />
sales of consumable and instrumentation products.<br />
The increase in sales within the U.S. was primarily due to increased sales at <strong>QIAGEN</strong>, Inc. of approximately<br />
$22.6 million (31%) over the prior year. The increase in sales outside of the U.S. was led by increases at <strong>QIAGEN</strong><br />
GmbH and <strong>QIAGEN</strong> K.K. of approximately $4.4 million (18%) and approximately 3.4 million (26%), respectively.<br />
In addition to obtaining new customer accounts, increases in consumable sales were also attributable to further<br />
leverage of the Company’s sales force which, based on its size and focused presence, is increasingly able to<br />
identify and service customer needs. Additionally, the Company experienced very strong BioRobot ® sales and sales<br />
from the Operon products.<br />
While sales of consumable products continue to increase, the Company continues to expect, as disclosed in previous<br />
filings, a slower rate of sales growth for the range of products designed for large-scale plasmid DNA applications as<br />
their market matures. The Company continually introduces new products in order to extend the life of its existing<br />
product lines as well as to address new market opportunities. During 2000, the Company released over 20 new<br />
products including the BioRobot ® 8000, for fully automated nucleic acid purification and liquid handling, a system for<br />
purification of DNA in low elution volumes, a complete RNA protection and isolation system and a kit for ultrafast<br />
purification of ultrapure plasmid DNA.<br />
A significant portion of the Company’s revenues during 2000 was denominated in German marks. Compared to<br />
1999, in 2000 the German mark, as measured by the average exchange rate for the period, depreciated against<br />
the U.S. dollar by 13.4%. If the same rates used for 1999 were applied to 2000, net sales in 2000 would have<br />
been higher and the related percentage growth would have been higher than the percentage calculated in reported<br />
net sales. See ”Currency Fluctuations.”<br />
Gross Profit. Gross profit increased 35% in 2000 to $151.4 million or 70% of net sales for the year ended 2000<br />
compared to $112.3 million or 71.0% of net sales in 1999. The absolute dollar increase is attributable to the increase<br />
in net sales. Gross profit is reduced by increased sales of instrumentation products, such as the <strong>QIAGEN</strong> BioRobot ®<br />
workstation, as they carry a lower gross margin than the Company’s consumable products.<br />
Research and Development. During 2000, research and development expense increased 31% to $23.4 million<br />
(11% of net sales), up from $17.8 million (11% of net sales) in 1999. During the first quarter of 1999, construction<br />
was completed on a new research and development facility, which was further expanded as of January 2000 and,
as a result, operating costs related to the facility were higher in 2000. Additionally, <strong>QIAGEN</strong> Genomics, Inc., which<br />
was purchased on December 31, 1999, incurred $2.6 million in research and development costs in fiscal 2000. The<br />
increase in research and development expenses over the prior year was also due to the increased personnel costs<br />
related to hiring of new research and development personnel. At December 31, 2000, the Company employed 230<br />
research and development personnel.<br />
Sales and Marketing. Sales and marketing expenses increased 38% in 2000 to $54.9 million (25% of net sales) from<br />
$39.9 million (25% of net sales) in 1999. The increase in sales and marketing expenses is primarily attributable to<br />
increases in costs associated with marketing materials, such as publications and promotional items, and personnel.<br />
During 2000, the Company increased its sales force by approximately 30%. Sales and marketing expenses<br />
attributed to the Company’s new subsidiaries <strong>QIAGEN</strong> Genomics, Inc. and <strong>QIAGEN</strong> S.p.A. totaled $1.1 million for<br />
the year ended December 31, 2000. The Company anticipates that selling and marketing costs will continue to<br />
increase along with continued growth in sales of the Company’s products.<br />
General and Administrative. General and Administrative costs increased 19% in 2000 to $31.2 million (14% of net<br />
sales) from $26.1 million (17% of net sales) in 1999. The absolute dollar increase is primarily attributable to the<br />
general and administrative costs at the Company’s five new subsidiaries. Further, this increase represents increased<br />
costs required to support the Company’s administrative infrastructure that is growing to accommodate the Company’s<br />
continued growth. The decrease in General and Administrative costs as a percent of sales was primarily due to<br />
economies of scale.<br />
23<br />
Acquisition Costs. On June 28, 2000, the Company acquired Operon Technologies, Inc. in Alameda, California. In<br />
connection with the acquisition, which was accounted for as a pooling of interests, the Company incurred costs of<br />
$5.4 million. These costs include approximately $3.9 million of finder fees for the investment banker chosen by the<br />
shareholders of Operon. This fee was not paid for by the Company, but by the Operon shareholders. However, in<br />
accordance with the accounting rules for a pooling of interests transaction, this expense is reflected in the 2000<br />
financial statements. The acquisition costs also include approximately $1.0 million in Netherlands capital tax, which<br />
is based on the amount of capital raised in share issuances.<br />
In-Process Research and Development. On December 31, 1999, the Company acquired Rapigene, Inc., subsequently<br />
renamed <strong>QIAGEN</strong> Genomics, Inc., in a transaction accounted for as a purchase. Independent appraisers utilizing<br />
proven valuation procedures and techniques allocated a portion of the purchase price as in-process research and<br />
development. The Company recorded a charge of $5.1 million for purchased in-process research and development<br />
in the fourth quarter of 1999. This charge represents the estimated fair value of the purchased in-process research<br />
and development based on risk-adjusted cash flows related to the in-process research and development projects. At<br />
the date of acquisition, the development of these projects had not yet reached technological feasibility and the<br />
research and development in progress had no alternative future use. Accordingly, the Company expensed these costs.<br />
Other Income (Expense). Other income increased to $2.6 million in 2000 from $1.6 million in 1999. This increase was<br />
mainly due to increased interest income on marketable securities, partially offset by an increase in foreign currency<br />
transaction losses.<br />
During 1999, the Company entered into three equity investments in new start-up companies. In that year, a total of<br />
$637,000 was recorded as the equity loss from these investments. In 2000 these losses totaled $870,000. Given<br />
the newness of the ventures, the Company anticipates that these investments will continue to generate losses at least<br />
during the next several years.<br />
The Company received a total of $1.2 million in 2000 for research and development grants from European and<br />
German state and federal government institutions compared to $1.1 million in 1999.<br />
Interest expense increased to $1.6 million in 2000 compared to $1.3 million in 1999. This increase is primarily due<br />
to interest expense on the Company’s new research and development facility, which carries higher principal and interest<br />
costs than the former facility alone. In January 2000, the Company began recording lease payments on the expansion<br />
of the research and development facility, thus lease related interest expense in 2000 exceeded 1999 amounts.
Interest income increased to $3.0 million in 2000 from $1.6 million in 1999. Interest income is derived mainly from<br />
the Company’s investment of funds in investment grade, interest-bearing marketable securities. As of December 31,<br />
2000, the Company had approximately $37.3 million invested in such securities.<br />
In 2000, the Company incurred losses on foreign currency transactions of $231,000 compared with a gain of<br />
$420,000 in 1999. Income from foreign currency transactions reflects net effects from conducting business in<br />
currencies other than the U.S. dollar. <strong>QIAGEN</strong> N.V.’s functional currency is the U.S. dollar and its subsidiaries’<br />
functional currencies are the German mark, the British pound, the Swiss franc, the French franc, the U.S. dollar, the<br />
Australian dollar, the Canadian dollar, the Japanese yen and the euro. See ”Currency Fluctuations.”.<br />
Other miscellaneous income increased to $1.1 million in 2000 from $471,000 in 1999 primarily due to increased<br />
handling fees paid to <strong>QIAGEN</strong> N.V. for stock options exercises.<br />
24<br />
Provision for Income Taxes. The Company’s effective tax rate increased to 46% in 2000 from 44% in 1999. The<br />
increase is due to the lack of a tax benefit associated with the acquisition costs in 2000 along with increased taxable<br />
income at foreign subsidiaries in 2000 compared to 1999. Without the acquisition costs in 2000, the Company’s<br />
effective tax rate would have been 41%. The tax rate in 1999 was high due to the lack of a tax benefit for the<br />
in-process research and development charge. The effective tax rate excluding the in-process research and development<br />
charge would have been 36% in 1999.<br />
Minority Interest. The Company has a 60 percent interest in its Japanese subsidiary, <strong>QIAGEN</strong> K.K and until June 30,<br />
2000 the Company also had an interest in Rosys Instruments, Inc. (Rosys, Inc.) which was 50 percent owned by<br />
<strong>QIAGEN</strong> Instruments AG. The financial position and results of operations of these subsidiaries are included in the<br />
Company’s consolidated financial statements. The minority interest in income of <strong>QIAGEN</strong> K.K. and Rosys, Inc.<br />
decreased to $36,000 in 2000 from $149,000 in 1999, as shown in the consolidated statements of income. This<br />
decrease is primarily due to the sale of Rosys, Inc.<br />
LIQUIDITY AND CAPITAL RESOURCES<br />
To date, the Company has funded its business primarily through internally generated funds, debt and the private and<br />
public sales of equity. For the years ended December 31, <strong>2001</strong> and 2000, the Company generated net cash from<br />
operating activities of approximately $58.1 million and $40.7 million, respectively. Cash provided by operating<br />
activities increased in <strong>2001</strong> over 2000 primarily due to increases in net income, depreciation and amortization, and<br />
smaller increases in accounts receivable, accounts payable and inventories than in 2000, partially offset by increases<br />
in prepaid expenses, the realized gain on sales of marketable securities, and the reduction in tax benefits associated<br />
with non-qualified stock options. Since the Company relies heavily on cash generated from operating activities to fund<br />
its business, a decrease in demand for the Company’s product or significant technological advances of competitors<br />
would have a negative impact on the Company’s liquidity.<br />
Approximately $90.8 million of cash was used in investing activities during <strong>2001</strong>, compared to $46.3 million in<br />
2000. Investing activities during <strong>2001</strong> consisted principally of the purchases of property and equipment in connection<br />
with the expansion of the Company’s operations in Germany and the U.S. and the sale of marketable securities.<br />
Financing activities provided $66.2 million in cash during <strong>2001</strong> compared to $14.3 million provided in 2000. The<br />
financing activities in <strong>2001</strong> consisted primarily of proceeds on long-term borrowings and lines of credit, proceeds<br />
from the issuance of common shares due to stock option exercises, as well as proceeds received from State and<br />
County grants related to the construction of the U.S. facility in Maryland, partially offset by short-term and long-term<br />
debt repayments. Financing activities during 2000 consisted primarily of proceeds from the issuance of common<br />
shares, including a private sale of 616,000 shares, offset by the repayment of the acquisition note payable related<br />
to the purchase of Rapigene, Inc. (renamed <strong>QIAGEN</strong> Genomics, Inc.).<br />
As of December 31, <strong>2001</strong> and 2000, the Company had cash and cash equivalents along with investments in<br />
current marketable securities of $80.0 million and $61.3 million, respectively, and working capital of $119.4 million<br />
and $101.5 million, respectively. Cash and cash equivalents are primarily held in U.S. dollars, other than those cash<br />
balances maintained in the local currency of the subsidiary to meet local working capital needs. The Company has
credit lines totaling $9.6 million at variable interest rates of which approximately $6.0 million was utilized as of<br />
December 31, <strong>2001</strong>. In addition, as of December 31, <strong>2001</strong> the Company had short-term loans outstanding totaling<br />
$281,000 and capital lease obligations in the amount of $11.5 million. The Company also carries $71.9 million of<br />
long-term debt that consists mainly of three notes payable, two which are due in one payment in May 2003 totaling<br />
approximately EUR 70.4 million, at a variable rate of EURIBOR plus 1.2%, and one note due in semi-annual<br />
payments through March 2009 of EUR 252,000, at a fixed rate of 3.75%.<br />
At December 31, <strong>2001</strong>, the Company continued the construction of three new facilities. The Company’s new U.S.<br />
research and manufacturing facility is substantially completed at a total estimated project cost of $55.3 million.<br />
Construction on two new German facilities commenced in October 2000, with estimated completion in the third<br />
quarter of 2002. The total estimated cost for these facilities is approximately EUR 54.0 million (approximately<br />
$48.1 million at December 31, <strong>2001</strong>). Cash flows from operations and bank loans will continue to fund the estimated<br />
costs to complete these projects.<br />
In May <strong>2001</strong>, the Company obtained two new loan facilities totaling EUR 100.0 million (approximately $89.0 million<br />
at December 31, <strong>2001</strong>) each with an initial term of two years. The primary intended use of the proceeds from these<br />
facilities is the refinancing of previously made acquisitions of land and the construction of manufacturing, research<br />
and administrative facilities at these sites. At December 31, <strong>2001</strong>, approximately $62.6 million had been drawn<br />
against these facilities, and is included in long-term debt.<br />
25<br />
Future contractual cash obligations resulting from long-term debt, capital leases and operating leases are as follows:<br />
Total<br />
2002<br />
2003<br />
2004<br />
2005<br />
2006<br />
Thereafter<br />
Contractual obligations<br />
(in thousands)<br />
Long-term debt<br />
$ 71,858<br />
$ 1,138<br />
$ 64,001<br />
$ 1,557<br />
$ 1,172<br />
$ 1,146<br />
$ 2,844<br />
Capital lease<br />
obligations<br />
17,365<br />
1,789<br />
1,554<br />
1,274<br />
1,140<br />
930<br />
10,678<br />
Operating leases<br />
14,331<br />
4,521<br />
4,616<br />
3,092<br />
1,187<br />
121<br />
794<br />
Total contractual<br />
cash obligations<br />
$ 103,554<br />
$ 7,448<br />
$ 70,171<br />
$ 5,923<br />
$ 3,499<br />
$ 2,197<br />
$ 14,316<br />
Additional commercial commitments including lines of credit and purchase commitments are as follows:<br />
Total Amounts<br />
Committed<br />
2002<br />
2003<br />
2004<br />
2005<br />
2006<br />
Thereafter<br />
Other commercial<br />
commitments<br />
(in thousands)<br />
Lines of credit<br />
$ 6,038<br />
$ 6,038<br />
$ –<br />
$ –<br />
$ –<br />
$ –<br />
$ –<br />
Other commercial<br />
commitments<br />
36,700<br />
24,400<br />
4,800<br />
7,500<br />
–<br />
–<br />
–<br />
Total commercial<br />
commitments<br />
$ 42,738<br />
$ 30,438<br />
$ 4,800<br />
$ 7,500<br />
$ –<br />
$ –<br />
$ –<br />
The Company believes that funds from operations, together with the proceeds from its public and private sales of<br />
equity, and the use of debt financing as needed, will be sufficient to fund the Company’s planned operations during<br />
the coming year.<br />
The functional currencies of the Company and its subsidiaries generally are their respective local currencies in<br />
accordance with Statement of Financial Accounting Standard No. 52 ”Foreign Currency Translation”. All amounts in
the financial statements of entities whose functional currency is not the dollar are translated into dollar equivalents at<br />
exchange rates as follows: (1) assets and liabilities at period-end rates, (2) income statement accounts at average<br />
exchange rates for the period, and (3) components of shareholders’ equity at historical rates. Translation gains or<br />
losses are recorded in shareholders’ equity and transaction gains and losses are reflected in net income. The net gain<br />
(loss) on foreign currency transactions for <strong>2001</strong>, 2000 and 1999, was $31,000, $(231,000) and $420,000,<br />
respectively, and is included in other income.<br />
BUSINESS FACTORS<br />
26<br />
This report contains forward-looking statements that are subject to certain risks and uncertainties. These statements<br />
include statements regarding (i) the Company’s ability to maintain its relationships with its customers and its broad<br />
range of products, (ii) the Company’s ability to stay abreast of technological developments and to develop and<br />
introduce new products, (iii) the size, nature and development of the Company’s markets and potential markets, (iv) the<br />
Company’s ability to penetrate and expand these markets and trends in the demand for the Company’s existing and<br />
new products, (v) the Company’s ability to increase its production efficiency as a result of expansion in its production<br />
capacity and to manage growth and its international operations, (vi) the integration of strategic acquisitions and<br />
complementary business investments, (vii) variability of operating results and (viii) the Company’s liquidity (including<br />
the effects of currency fluctuations). Such statements are based on management’s current expectations and are<br />
subject to a number of factors and uncertainties that could cause actual results to differ materially from those described<br />
in the forward-looking statements. The Company cautions investors that there can be no assurance that actual results<br />
or business conditions will not differ materially from those projected or suggested in such forward-looking statements<br />
as a result of various factors, including, but not limited to, the following: risks associated with the Company’s<br />
expansion of operations, including the acquisition of new companies; variability in the Company’s operating results<br />
from quarter to quarter; management of growth, international operations, and dependence on key personnel; intense<br />
competition; technological change; the Company’s ability to develop and protect proprietary products and technologies<br />
and to enter into collaborative commercial relationships; the Company’s future capital requirements; general economic<br />
conditions and capital market fluctuations; and uncertainties as to the extent of future government regulation of the<br />
Company’s business. As a result, the Company’s future development efforts involve a high degree of risk. For further<br />
information, refer to the more specific risks and uncertainties discussed the Company’s <strong>Annual</strong> <strong>Report</strong> filed on Form<br />
20-F with the SEC.<br />
QUANTITATIVE AND QUALITATIVE DISCLOSURES ABOUT MARKET RISK<br />
The Company’s market risk relates primarily to interest rate exposures on cash, marketable securities and borrowings<br />
and foreign currency exposures on intercompany transactions. The overall objective of the Company’s risk management<br />
is to reduce the potential negative earnings effects from changes in interest and foreign exchange rates. Exposures<br />
are managed through operational methods and financial instruments. The Company does not use financial instruments<br />
for trading or other speculative purposes.<br />
Interest Rate Risk. Interest income earned on the Company’s investment portfolio is affected by changes in the relative levels<br />
of market interest rates. The Company only invests in high-grade investment securities. For the year ended December<br />
31, <strong>2001</strong>, the weighted average interest rate on the Company’s marketable securities portfolio was 4.48% to 5.75%.<br />
Borrowings against lines of credit are at variable interest rates. At December 31, <strong>2001</strong>, and 2000, the Company<br />
had $6.0 million and $855,000, respectively, of outstanding lines of credit with an average interest rate of 5.92%<br />
at December 31, <strong>2001</strong>. A hypothetical adverse 10 percent movement in market interest rates would not have<br />
materially impacted the Company’s financial statements.<br />
In May <strong>2001</strong>, the Company obtained two new loan facilities totaling EUR 100.0 million (approximately $89.0 million<br />
at December 31, <strong>2001</strong>) with an initial term of two years and a variable interest rate based on EURIBOR plus 1.2%<br />
(4.54% at December 31, <strong>2001</strong>.) At December 31, <strong>2001</strong>, $62.6 million had been drawn against these facilities. A<br />
hypothetical adverse 10 percent movement in market interest rates would decrease 2002 earnings by approximately
$360,000, based on the year-end interest rate, a loan balance consistent with that at year-end and a constant foreign<br />
exchange rate. In February 2002, loan agreements related to EUR 50.0 million of the facilities was amended to be<br />
U.S. dollar denominated and the amount was fixed at $43.5 million at an interest rate of LIBOR plus 1.28%.<br />
Currency Fluctuations. The Company operates on an international basis. A significant portion of its revenues and expenses<br />
are earned and incurred in currencies other than the U.S. dollar. The euro is the most significant such currency, with<br />
others including the British pound, Japanese yen, Swiss franc, and Canadian and Australian dollars. Fluctuations in<br />
the value of the currencies in which the Company conducts its business relative to the U.S. dollar have caused and<br />
will continue to cause U.S. dollar translations of such currencies to vary from one period to another. Due to the number<br />
of currencies involved, the constantly changing currency exposures, and the potential substantial volatility of currency<br />
exchange rates, the Company cannot predict the effect of exchange rate fluctuations upon future operating results.<br />
However, because the Company has substantial expenses as well as revenues in each of its principal functional<br />
currencies, the exposure of its financial results to currency fluctuations is reduced. The Company seeks to mitigate<br />
what it believes to be a significant portion of the remaining risk through hedging transactions. In general terms,<br />
appreciation of the U.S. dollar against the Company’s other foreign currencies, such as occurred in 2000 and <strong>2001</strong><br />
with respect to the euro, will decrease reported net sales. However, this impact normally will be at least partially<br />
offset in the results of operations by gains or losses from foreign currency transactions.<br />
27<br />
Currency Hedging. In the ordinary course of business, the Company purchases foreign currency exchange options to<br />
manage potential losses from foreign currency exposures. These options give the Company the right, but not the<br />
obligation, to sell foreign currencies in exchange for U.S. dollars at predetermined exchange rates. The principle<br />
objective of such options is to minimize the risks and/or costs associated with global financial and operating<br />
activities. The Company does not utilize financial instruments for trading or other speculative purposes. At December 31,<br />
<strong>2001</strong>, the notional amount of foreign currency exchange options was $6.8 million. The functional currency of<br />
$5.6 million of the foreign currency exchange options was the euro, with a notional weighted average exchange rate<br />
of 1.0000. The functional currency of the remaining $1.2 million foreign currency exchange options was the<br />
Swiss franc, with a notional weighted average exchange rate of 1.5500.<br />
Foreign Currency Exchange Rate Risk. The Company’s principal production and manufacturing facility is located in<br />
Germany and intercompany sales of inventory expose the Company to foreign currency exchange rate risk. Intercompany<br />
sales of inventory are generally denominated in the local currency of the subsidiary purchasing the inventory in order<br />
to centralize foreign currency risk with the Company’s German subsidiary. Payment for intercompany purchases of<br />
inventory is required within 30 days from invoice date. The delay between the date the German subsidiary records<br />
revenue and the date when the payment is received from the purchasing subsidiaries exposes the Company to<br />
foreign exchange risk. The exposure results primarily from those transactions between Germany and the U.S.<br />
At year-end, the Company’s long-term debt with Deutsche Bank was denominated in euros. Approximately $44.5 million<br />
was loaned to <strong>QIAGEN</strong> Sciences, Inc., therefore, the Company internally bears currency exchange rate risk and<br />
changes in the foreign exchange rate will affect earnings. In February 2002, the terms of the loan agreements were<br />
amended so that the portion of the loan payable from U.S. subsidiaries is denominated in U.S. dollars.<br />
The foreign currency exchange rate risk is partially offset by transactions of the German subsidiary denominated in<br />
U.S. dollars. Hedging instruments include foreign currency put options that are purchased to protect the existing and/or<br />
anticipated receivables resulting from intercompany sales from Germany to the U.S. These options give the Company<br />
the right, but not the obligation, to sell foreign currencies in exchange for U.S. dollars at predetermined exchange<br />
rates. Management does not believe that the Company’s exposure to foreign currency exchange rate risk is material.
REPORT OF INDEPENDENT PUBLIC ACCOUNTANTS<br />
TO THE BOARD OF DIRECTORS AND SHAREHOLDERS OF <strong>QIAGEN</strong> N.V.<br />
AND SUBSIDIARIES:<br />
We have audited the accompanying consolidated balance sheets of <strong>QIAGEN</strong> N.V. (a Netherlands<br />
company) and Subsidiaries as of December 31, <strong>2001</strong> and 2000, and the related consolidated statements<br />
of income, shareholders’ equity and comprehensive income and cash flows for each of the three years in<br />
28<br />
the period ended December 31, <strong>2001</strong>. These financial statements are the responsibility of the Company’s<br />
management. Our responsibility is to express an opinion on these financial statements based on our audits.<br />
We conducted our audits in accordance with auditing standards generally accepted in the United States.<br />
Those standards require that we plan and perform the audit to obtain reasonable assurance about whether<br />
the financial statements are free of material misstatement. An audit includes examining, on a test basis,<br />
evidence supporting the amounts and disclosures in the financial statements. An audit also includes<br />
assessing the accounting principles used and significant estimates made by management, as well as<br />
evaluating the overall financial statement presentation. We believe that our audits provide a reasonable<br />
basis for our opinion.<br />
In our opinion, the financial statements referred to above present fairly, in all material respects, the financial<br />
position of <strong>QIAGEN</strong> N.V. and Subsidiaries as of December 31, <strong>2001</strong> and 2000, and the results of their<br />
operations and their cash flows for each of the three years in the period ended December 31, <strong>2001</strong> in<br />
conformity with accounting principles generally accepted in the United States.<br />
ARTHUR ANDERSEN LLP<br />
Los Angeles, California<br />
February 6, 2002
<strong>QIAGEN</strong> N.V. AND SUBSIDIARIES<br />
CONSOLIDATED BALANCE SHEETS<br />
As of December 31,<br />
ASSETS<br />
<strong>2001</strong><br />
2000<br />
Current Assets:<br />
Cash and cash equivalents<br />
$ 56,460,000<br />
$ 24,008,000<br />
Marketable securities<br />
22,512,000<br />
37,307,000<br />
Notes receivable<br />
3,844,000<br />
3,383,000<br />
Note receivable from related party<br />
–<br />
617,000<br />
Accounts receivable, net of allowance for doubtful accounts of<br />
$2,048,000 and $991,000 in <strong>2001</strong> and 2000, respectively<br />
Income taxes receivable<br />
Inventories<br />
39,955,000<br />
2,439,000<br />
31,883,000<br />
34,738,000<br />
1,779,000<br />
29,231,000<br />
29<br />
Deferred income taxes<br />
11,123,000<br />
11,866,000<br />
Prepaid expenses and other<br />
9,115,000<br />
4,736,000<br />
Total current assets<br />
177,331,000<br />
147,665,000<br />
Long-Term Assets:<br />
Property, plant and equipment, net<br />
160,365,000<br />
73,156,000<br />
Long-term marketable securities,<br />
approximately $213,000 restricted in <strong>2001</strong><br />
2,759,000<br />
6,316,000<br />
Intangible assets, net of accumulated amortization of<br />
$4,060,000 and $2,734,000 in <strong>2001</strong> and 2000, respectively<br />
7,140,000<br />
7,136,000<br />
Deferred income taxes<br />
1,804,000<br />
–<br />
Other assets<br />
7,569,000<br />
6,620,000<br />
Total long-term assets<br />
179,637,000<br />
93,228,000<br />
Total assets<br />
$356,968,000<br />
$ 240,893,000<br />
The accompanying notes are an integral part of these consolidated balance sheets.
<strong>QIAGEN</strong> N.V. AND SUBSIDIARIES<br />
CONSOLIDATED BALANCE SHEETS (CONTINUED)<br />
As of December 31,<br />
LIABILITIES AND SHAREHOLDERS’ EQUITY<br />
<strong>2001</strong><br />
2000<br />
Current Liabilities:<br />
Lines of credit<br />
$ 6,038,000<br />
$ 885,000<br />
Short-term debt<br />
281,000<br />
6,382,000<br />
Current portion of long-term debt<br />
1,138,000<br />
1,071,000<br />
Current portion of capital lease obligations<br />
1,085,000<br />
1,043,000<br />
Accounts payable<br />
20,262,000<br />
18,668,000<br />
30<br />
Accrued liabilities<br />
Income taxes payable<br />
20,235,000<br />
8,434,000<br />
15,878,000<br />
1,712,000<br />
Deferred income taxes<br />
410,000<br />
499,000<br />
Total current liabilities<br />
57,883,000<br />
46,138,000<br />
Long-Term Liabilities:<br />
Long-term debt, net of current portion<br />
70,720,000<br />
11,552,000<br />
Capital lease obligations, net of current portion<br />
10,463,000<br />
11,744,000<br />
Deferred income taxes<br />
–<br />
549,000<br />
Other<br />
4,927,000<br />
3,361,000<br />
Total long-term liabilities<br />
86,110,000<br />
27,206,000<br />
Minority Interest in Consolidated Subsidiaries<br />
–<br />
193,000<br />
Commitments and Contingencies (Note 15)<br />
Shareholders’ Equity:<br />
Common shares, EUR 0.01 par value<br />
Authorized—260,000,000 shares<br />
Issued and outstanding—143,463,800 shares in<br />
<strong>2001</strong> and 142,548,487 shares in 2000<br />
1,458,000<br />
1,450,000<br />
Additional paid-in capital<br />
123,117,000<br />
103,448,000<br />
Retained earnings<br />
97,278,000<br />
62,859,000<br />
Accumulated other comprehensive loss<br />
(8,878,000)<br />
(401,000)<br />
Total shareholders’ equity<br />
212,975,000<br />
167,356,000<br />
Total Liabilities and Shareholders’ Equity<br />
$ 356,968,000<br />
$ 240,893,000<br />
The accompanying notes are an integral part of these consolidated balance sheets.
<strong>QIAGEN</strong> N.V. AND SUBSIDIARIES<br />
CONSOLIDATED STATEMENTS OF INCOME<br />
Years Ended December 31,<br />
<strong>2001</strong><br />
2000<br />
1999<br />
Net sales<br />
Cost of sales<br />
Gross profit<br />
Operating Expenses:<br />
$ 263,770,000<br />
79,673,000<br />
184,097,000<br />
$ 216,802,000<br />
65,436,000<br />
151,366,000<br />
$ 158,155,000<br />
45,836,000<br />
112,319,000<br />
Research and development<br />
Sales and marketing<br />
General and administrative<br />
Acquisition costs<br />
In-process research and development<br />
Total operating expenses<br />
Income from operations<br />
Other Income (Expense):<br />
26,769,000<br />
64,830,000<br />
36,022,000<br />
3,000,000<br />
–<br />
130,621,000<br />
53,476,000<br />
23,372,000<br />
54,931,000<br />
31,177,000<br />
5,353,000<br />
–<br />
114,833,000<br />
36,533,000<br />
17,813,000<br />
39,948,000<br />
26,110,000<br />
–<br />
5,100,000<br />
88,971,000<br />
23,348,000<br />
31<br />
Interest income<br />
Interest expense<br />
Research and development grants<br />
Gain (loss) on foreign currency transactions, net<br />
Loss from equity method investees<br />
Other miscellaneous income, net<br />
Total other income<br />
Income before provision for income<br />
taxes and minority interest<br />
Provision for income taxes<br />
Minority interest<br />
Net income<br />
Basic net income per common share<br />
Diluted net income per common share<br />
Shares used in computing basic net income<br />
per common share<br />
Shares used in computing diluted net income<br />
per common share<br />
1,795,000<br />
(991,000)<br />
1,526,000<br />
31,000<br />
(1,373,000)<br />
1,859,000<br />
2,847,000<br />
56,323,000<br />
21,896,000<br />
8,000<br />
$ 34,419,000<br />
$ 0.24<br />
$ 0.24<br />
142,962,000<br />
145,055,000<br />
3,032,000<br />
(1,622,000)<br />
1,212,000<br />
(231,000)<br />
(870,000)<br />
1,070,000<br />
2,591,000<br />
39,124,000<br />
18,085,000<br />
36,000<br />
$ 21,003,000<br />
$ 0.15<br />
$ 0.14<br />
142,040,000<br />
145,071,000<br />
1,576,000<br />
(1,306,000)<br />
1,116,000<br />
420,000<br />
(637,000)<br />
471,000<br />
1,640,000<br />
24,988,000<br />
10,950,000<br />
149,000<br />
$ 13,889,000<br />
$ 0.10<br />
$ 0.10<br />
140,317,000<br />
142,186,000<br />
The accompanying notes are an integral part of these consolidated financial statements.
<strong>QIAGEN</strong> N.V. AND SUBSIDIARIES<br />
CONSOLIDATED STATEMENTS OF SHAREHOLDERS’ EQUITY AND COMPREHENSIVE INCOME<br />
Common Shares<br />
Shares Amount<br />
Additional<br />
Paid-In<br />
Capital<br />
Retained<br />
Earnings<br />
Accumulated<br />
Other<br />
Comprehensive<br />
Loss<br />
Total<br />
Shareholders’<br />
Equity<br />
32<br />
BALANCE AT<br />
DECEMBER 31,<br />
1998<br />
139,888,291<br />
Net income<br />
–<br />
Unrealized loss, net<br />
on marketable securities<br />
–<br />
Translation adjustment<br />
–<br />
Comprehensive income<br />
–<br />
Conversion of par value<br />
to EUR 0.01<br />
–<br />
Exercise of stock options 926,772<br />
Tax benefit in connection<br />
with nonqualified<br />
stock options<br />
–<br />
BALANCE AT<br />
DECEMBER 31,<br />
1999<br />
140,815,063<br />
Net income<br />
–<br />
Unrealized gain, net<br />
on marketable securities<br />
–<br />
Translation adjustment<br />
–<br />
Comprehensive income<br />
–<br />
Exercise of stock options 1,117,424<br />
Private placement<br />
of common stock 616,000<br />
Finders’ fees paid by<br />
Operon shareholders<br />
–<br />
Tax benefit in connection<br />
with nonqualified<br />
stock options<br />
–<br />
BALANCE AT<br />
DECEMBER 31,<br />
2000<br />
142,548,487<br />
Net income<br />
–<br />
Unrealized loss, net<br />
on marketable securities<br />
–<br />
Realized gain, net<br />
on marketable securities<br />
–<br />
Translation adjustment<br />
–<br />
Comprehensive income<br />
–<br />
Exercise of stock options 862,914<br />
Common stock issued for<br />
intangible asset<br />
52,399<br />
Tax benefit in connection<br />
with nonqualified<br />
stock options<br />
–<br />
BALANCE AT<br />
DECEMBER 31,<br />
<strong>2001</strong><br />
143,463,800<br />
$ 2,417,000<br />
–<br />
–<br />
–<br />
–<br />
(993,000)<br />
11,000<br />
–<br />
1,435,000<br />
–<br />
–<br />
–<br />
–<br />
10,000<br />
5,000<br />
–<br />
–<br />
1,450,000<br />
–<br />
–<br />
–<br />
–<br />
–<br />
8,000<br />
–<br />
–<br />
$ 1,458,000<br />
$ 48,218,000<br />
–<br />
–<br />
–<br />
–<br />
993,000<br />
2,672,000<br />
6,237,000<br />
58,120,000<br />
–<br />
–<br />
–<br />
–<br />
4,458,000<br />
16,284,000<br />
3,850,000<br />
20,736,000<br />
103,448,000<br />
–<br />
–<br />
–<br />
–<br />
–<br />
4,081,000<br />
746,000<br />
14,842,000<br />
$123,117,000<br />
$ 27,967,000<br />
13,889,000<br />
–<br />
–<br />
–<br />
–<br />
–<br />
–<br />
41,856,000<br />
21,003,000<br />
–<br />
–<br />
–<br />
–<br />
–<br />
–<br />
–<br />
62,859,000<br />
34,419,000<br />
–<br />
–<br />
–<br />
–<br />
–<br />
–<br />
–<br />
$ 97,278,000<br />
$ (2,372,000)<br />
–<br />
(7,000)<br />
(2,160,000)<br />
–<br />
–<br />
–<br />
–<br />
(4,539,000)<br />
–<br />
6,133,000<br />
(1,995,000)<br />
–<br />
–<br />
–<br />
–<br />
–<br />
(401,000)<br />
–<br />
(3,606,000)<br />
(1,296,000)<br />
(3,575,000)<br />
–<br />
–<br />
–<br />
–<br />
$ (8,878,000)<br />
$ 76,230,000<br />
13,889,000<br />
(7,000)<br />
(2,160,000)<br />
11,722,000<br />
–<br />
2,683,000<br />
6,237,000<br />
96,872,000<br />
21,003,000<br />
6,133,000<br />
(1,995,000)<br />
25,141,000<br />
4,468,000<br />
16,289,000<br />
3,850,000<br />
20,736,000<br />
167,356,000<br />
34,419,000<br />
(3,606,000)<br />
(1,296,000)<br />
(3,575,000)<br />
25,942,000<br />
4,089,000<br />
746,000<br />
14,842,000<br />
$ 212,975,000<br />
The accompanying notes are an integral part of these consolidated financial statements.
<strong>QIAGEN</strong> N.V. AND SUBSIDIARIES<br />
CONSOLIDATED STATEMENTS OF CASH FLOWS<br />
Years Ended December 31,<br />
CASH FLOWS FROM OPERATING ACTIVITIES<br />
<strong>2001</strong><br />
2000<br />
1999<br />
Net income<br />
$ 34,419,000<br />
$ 21,003,000<br />
$ 13,889,000<br />
Adjustments to reconcile net income<br />
to net cash provided by operating activities:<br />
Depreciation and amortization<br />
15,059,000<br />
11,066,000<br />
8,561,000<br />
Finders fees paid by Operon shareholders<br />
–<br />
3,850,000<br />
–<br />
In-process research and development<br />
–<br />
–<br />
5,100,000<br />
Tax benefit on non-qualified stock options<br />
Provision for losses on accounts receivable<br />
Deferred income taxes<br />
14,842,000<br />
1,363,000<br />
(1,789,000)<br />
20,736,000<br />
189,000<br />
(5,642,000)<br />
6,237,000<br />
381,000<br />
(1,297,000)<br />
33<br />
(Gain) on disposition of property<br />
and equipment<br />
(39,000)<br />
(55,000)<br />
(29,000)<br />
(Gain) loss on sale of marketable securities<br />
(1,296,000)<br />
–<br />
11,000<br />
Loss on sale of investment<br />
–<br />
30,000<br />
–<br />
Loss on equity method investee<br />
1,373,000<br />
870,000<br />
637,000<br />
Minority interest<br />
8,000<br />
36,000<br />
149,000<br />
Net changes in operating assets and liabilities:<br />
(increase) decrease in:<br />
Notes receivable<br />
(959,000)<br />
(1,685,000)<br />
(909,000)<br />
Accounts receivable<br />
(7,888,000)<br />
(10,950,000)<br />
(5,394,000)<br />
Income taxes receivable<br />
(674,000)<br />
(1,682,000)<br />
(100,000)<br />
Inventories<br />
(3,926,000)<br />
(6,882,000)<br />
(3,885,000)<br />
Prepaid expenses and other<br />
(4,660,000)<br />
(750,000)<br />
(354,000)<br />
Other assets<br />
(228,000)<br />
(1,750,000)<br />
(72,000)<br />
Increase (decrease) in:<br />
Accounts payable<br />
2,349,000<br />
4,992,000<br />
2,147,000<br />
Accrued liabilities<br />
4,913,000<br />
5,645,000<br />
3,398,000<br />
Income taxes payable<br />
6,995,000<br />
1,565,000<br />
(1,007,000)<br />
Other<br />
(1,775,000)<br />
81,000<br />
(151,000)<br />
Net cash provided by operating activities<br />
58,087,000<br />
40,667,000<br />
27,312,000<br />
The accompanying notes are an integral part of these consolidated financial statements.
<strong>QIAGEN</strong> N.V. AND SUBSIDIARIES<br />
CONSOLIDATED STATEMENTS OF CASH FLOWS (CONTINUED)<br />
Years Ended December 31,<br />
CASH FLOWS FROM INVESTING ACTIVITIES<br />
<strong>2001</strong><br />
2000<br />
1999<br />
Purchases of property, plant and equipment<br />
(102,067,000)<br />
(40,651,000)<br />
(13,746,000)<br />
Proceeds from sale of equipment<br />
274,000<br />
372,000<br />
98,000<br />
Purchases of intangible assets<br />
(1,159,000)<br />
(440,000)<br />
(32,000)<br />
Purchases of investments<br />
(1,515,000)<br />
(568,000)<br />
(3,618,000)<br />
Sales of investments<br />
85,000<br />
184,000<br />
–<br />
Purchases of marketable securities<br />
(1,565,000)<br />
(28,861,000)<br />
(37,173,000)<br />
34<br />
Sales of marketable securities<br />
Loan to related party<br />
16,310,000<br />
(1,778,000)<br />
23,647,000<br />
–<br />
28,808,000<br />
–<br />
Collection of related party note receivable<br />
617,000<br />
–<br />
–<br />
Other<br />
–<br />
–<br />
37,000<br />
Net cash used in investing activities<br />
(90,798,000)<br />
(46,317,000)<br />
(25,626,000)<br />
The accompanying notes are an integral part of these consolidated financial statements.
<strong>QIAGEN</strong> N.V. AND SUBSIDIARIES<br />
CONSOLIDATED STATEMENTS OF CASH FLOWS (CONTINUED)<br />
Years Ended December 31,<br />
CASH FLOWS FROM FINANCING<br />
<strong>2001</strong><br />
2000<br />
1999<br />
Proceeds from lines of credit<br />
23,543,000<br />
14,092,000<br />
675,000<br />
Repayment of lines of credit<br />
(18,375,000)<br />
(14,182,000)<br />
(655,000)<br />
Proceeds from short-term debt<br />
–<br />
935,000<br />
475,000<br />
Repayment of short-term debt<br />
(5,763,000)<br />
(1,924,000)<br />
(1,250,000)<br />
Principal payments on capital leases<br />
(1,085,000)<br />
(1,144,000)<br />
(1,430,000)<br />
Proceeds from long-term debt<br />
Repayment of long-term debt<br />
Repayment of acquisition note payable<br />
Proceeds from loan convertible to grant<br />
Issuance of common shares<br />
Net cash provided by financing activities<br />
63,885,000<br />
(3,649,000)<br />
–<br />
3,600,000<br />
4,089,000<br />
66,245,000<br />
9,224,000<br />
(1,474,000)<br />
(12,000,000)<br />
–<br />
20,757,000<br />
14,284,000<br />
4,363,000<br />
(463,000)<br />
–<br />
–<br />
2,683,000<br />
4,398,000<br />
35<br />
Effect of exchange rate changes on<br />
cash and cash equivalents<br />
(1,082,000)<br />
139,000<br />
(246,000)<br />
Net increase in cash and<br />
cash equivalents<br />
32,452,000<br />
8,773,000<br />
5,838,000<br />
Cash and cash equivalents, beginning of year<br />
24,008,000<br />
15,235,000<br />
9,397,000<br />
Cash and cash equivalents, end of year<br />
$ 56,460,000<br />
$ 24,008,000<br />
$ 15,235,000<br />
Supplemental Cash Flow Disclosures:<br />
Cash paid for interest<br />
$ 1,113,000<br />
$ 1,489,000<br />
$ 1,971,000<br />
Cash paid for taxes<br />
$ 2,086,000<br />
$ 2,558,000<br />
$ 6,400,000<br />
Noncash Investing and Financing Activities:<br />
Common stock issued for intangible asset<br />
$ 746,000<br />
$ –-<br />
$ –<br />
Equipment purchased through capital leases<br />
$ 502,000<br />
$ 2,525,000<br />
$ 8,525,000<br />
Acquisition of Rapigene, Inc.:<br />
Net assets and liabilities assumed<br />
$ –<br />
$ –<br />
$ 2,200,000<br />
Developed technology and know-how<br />
$ –<br />
$ –<br />
$ 3,200,000<br />
Goodwill<br />
$ –<br />
$ –<br />
$ 1,500,000<br />
In-process research and development<br />
$ –<br />
$ –<br />
$ 5,100,000<br />
Issuance of note receivable<br />
$ –<br />
$ –<br />
$ 12,000,000<br />
The accompanying notes are an integral part of these consolidated financial statements.
<strong>QIAGEN</strong> N.V. AND SUBSIDIARIES<br />
NOTES TO CONSOLIDATED FINANCIAL STATEMENTS<br />
DECEMBER 31, <strong>2001</strong><br />
1. DESCRIPTION OF BUSINESS<br />
36<br />
<strong>QIAGEN</strong> N.V. and Subsidiaries (the Company) operates exclusively in the life sciences industry developing, producing<br />
and distributing biotechnology products, primarily for the separation and purification of nucleic acids (DNA/RNA) as<br />
well as manufacturing and marketing synthetic nucleic acids, DNA microarrays and synthetic genes and services for<br />
single nucleotide polymorphism (SNP) analyses and other genomic applications. The Company’s products are<br />
used in biological research by universities and research institutions as well as in genome sequencing, diagnostic and<br />
therapeutic industries.<br />
At December 31, <strong>2001</strong>, the Company consisted of the Netherlands parent company (<strong>QIAGEN</strong> N.V.) and its wholly<br />
owned subsidiaries as listed in the following table:<br />
Subsidiary<br />
Location<br />
<strong>QIAGEN</strong> GmbH<br />
Hilden, Germany<br />
<strong>QIAGEN</strong> Ltd.<br />
Crawley, England<br />
<strong>QIAGEN</strong> AG<br />
Basel, Switzerland<br />
<strong>QIAGEN</strong> S.A.<br />
Courtaboeuf Cedex, France<br />
<strong>QIAGEN</strong> Pty. Ltd.<br />
Clifton Hill, Australia<br />
<strong>QIAGEN</strong> Inc.<br />
Mississauga, Canada<br />
<strong>QIAGEN</strong> Instruments AG<br />
Hombrechtikon, Switzerland<br />
<strong>QIAGEN</strong> S.p.A.<br />
Milan, Italy<br />
<strong>QIAGEN</strong> Operon GmbH<br />
Cologne, Germany<br />
<strong>QIAGEN</strong> K.K.<br />
Tokyo, Japan<br />
Sawady Technologies Co., Ltd. Tokyo, Japan<br />
<strong>QIAGEN</strong> North American Holdings, Inc. Valencia, California, United States<br />
<strong>QIAGEN</strong> Inc.<br />
Valencia, California, United States<br />
<strong>QIAGEN</strong> Genomics, Inc.<br />
Bothell, Washington, United States<br />
<strong>QIAGEN</strong> Sciences, Inc.<br />
Germantown, Maryland, United States<br />
<strong>QIAGEN</strong> Operon, Inc.<br />
Alameda, California, United States<br />
<strong>QIAGEN</strong> North American Holdings, Inc. (QNAH) was established on February 24, 2000, and during fiscal 2000<br />
ownership of <strong>QIAGEN</strong> Inc. (Valencia), <strong>QIAGEN</strong> Genomics, Inc., <strong>QIAGEN</strong> Sciences, Inc., and <strong>QIAGEN</strong> Operon, Inc.<br />
(formerly Operon Technologies, Inc.) was transferred from <strong>QIAGEN</strong> N.V. to QNAH.<br />
The Company also had a 55 percent interest in Accord Co., Ltd. in Tokyo, Japan.<br />
The Company’s products are sold throughout the world, primarily in the United States and in Europe. Similar to most<br />
companies in this line of business, the Company’s products are subject to rapid technological change. Because of these<br />
technological changes, the Company needs to continuously expend resources toward research and development.<br />
2. SUMMARY OF SIGNIFICANT ACCOUNTING POLICIES<br />
a. Basis of Presentation<br />
The accompanying consolidated financial statements were prepared in conformity with accounting principles<br />
generally accepted in the United States (GAAP) and include the accounts of the Company and its wholly and<br />
majority owned subsidiaries, after elimination of all significant intercompany accounts and transactions. Investments
in affiliated companies that are 50 percent or less owned and where the Company exercises significant influence<br />
over the operations are accounted for using the equity method. All other investments are accounted for under the<br />
cost method.<br />
b. Risks and Uncertainties<br />
The preparation of financial statements in conformity with accounting principles generally accepted in the United<br />
States requires management to make estimates and assumptions that affect the reported amounts of assets, liabilities<br />
and disclosure of contingencies at the date of the financial statements as well as the reported amounts of revenues<br />
and expenses during the reporting period. Actual results could differ from those estimates.<br />
The Company’s accounts receivable are unsecured and the Company is at risk to the extent such amounts become<br />
uncollectible. The Company continually monitors account receivable balances, and provides for an allowance of<br />
doubtful accounts at the time collection may become questionable based on payment history or age of the receivable.<br />
As of December 31, <strong>2001</strong> and 2000, no single customer represented more than ten percent of accounts receivable<br />
or consolidated net sales.<br />
c. Reclassification<br />
Certain prior year balances have been reclassified to conform to the current year presentation.<br />
d. Cash and Cash Equivalents<br />
37<br />
Cash and cash equivalents consist of cash on deposit in banks and other cash invested temporarily in various<br />
instruments that are short-term and highly liquid. The Company maintains its cash accounts in highly qualified institutions.<br />
e. Marketable Securities<br />
The Company accounts for marketable securities in accordance with Statement of Financial Accounting Standard<br />
(SFAS) No. 115, ”Accounting for Certain Investments in Debt and Equity Securities.” All investments are stated at fair<br />
value, interest income is accrued when earned, and changes in market values are reflected as unrealized gains and<br />
losses, calculated on the specific identification method, as a component of accumulated other comprehensive income.<br />
f. Inventories<br />
Inventories are stated at the lower of cost or market (first-in, first-out) and consist of materials, labor and overhead.<br />
The components of inventories consist of the following as of December 31, <strong>2001</strong> and 2000:<br />
Raw materials<br />
Work in process<br />
Finished goods<br />
Total inventories<br />
g. Property, Plant and Equipment<br />
<strong>2001</strong><br />
$ 8,786,000<br />
8,352,000<br />
14,745,000<br />
$ 31,883,000<br />
2000<br />
$ 10,381,000<br />
5,652,000<br />
13,198,000<br />
$ 29,231,000<br />
Property, plant and equipment, including equipment under capital lease, are stated at cost. Depreciation is computed<br />
using the straight-line and declining balance methods over the following estimated useful lives: buildings for ten to<br />
twenty-five years; machinery and equipment for two to six years; computer software for one to five years; furniture<br />
and office equipment for two and one-half to ten years; and leasehold improvements are computed on a straight-line<br />
basis over the lesser of the remaining life of the lease or the estimated useful life. The Company has a policy of<br />
capitalizing expenditures that materially increase assets’ useful lives and charging ordinary maintenance and repairs<br />
to operations as incurred. When property or equipment is disposed of, the cost and related accumulated depreciation<br />
and amortization are removed from the accounts and any gain or loss is included in other miscellaneous income.
h. Long-Lived Assets<br />
The Company reviews its long-lived assets for impairment whenever events or changes in circumstances indicate<br />
that the carrying amount of an asset or a group of assets may not be recoverable. The Company considers a history<br />
of operating losses or a change in expected sales levels to be indicators of potential impairment. Assets are<br />
grouped and evaluated for impairment at the lowest level for which there are identified cash flows that are largely<br />
independent of the cash flows of other groups of assets. The Company deems an asset to be impaired if a forecast<br />
of undiscounted projected future operating cash flows directly related to the asset, including disposal value, if any, is<br />
less than its carrying amount. If an asset is determined to be impaired, the loss is measured as the amount by which<br />
the carrying amount of the asset exceeds fair value. The Company generally measures fair value by discounting<br />
projected future cash flows. Considerable management judgment is necessary to estimate discounted future cash<br />
flows. Accordingly, actual results could differ from such estimates.<br />
i. Revenue Recognition<br />
38<br />
Revenue from consumable product sales is recognized when title passes, generally upon shipment (FOB shipping<br />
point). Revenue from instrumentation equipment is not recognized until title passes to the customer, either upon<br />
shipment in the case of sales to distributors (FOB shipping point), or written customer acceptance in the case of sales<br />
to end users after satisfying any installation and training requirements. For instrumentation equipment sales that<br />
contain other obligations, such as providing service or supplies, revenue is allocated based on the relative fair values<br />
of the individual components as determined by list prices. If cash sales prices are not available for individual<br />
components, then the sales value is deferred until all individual components are delivered or performed. Revenue from<br />
instrumentation service contracts, which account for less than 10 percent of total consolidated net sales, is deferred<br />
and recognized over the term of the contract.<br />
j. Shipping and Handling Income and Costs<br />
The Company accounts for income and costs related to shipping and handling activities in accordance with the<br />
Emerging Issues Task Force Issue No. 00-10 ”Accounting for Shipping and Handling Revenues and Costs.” Income<br />
from shipping and handling is included with revenue from product sales. Associated costs of shipping and handling<br />
are included in sales and marketing expenses. For the years ended December 31, <strong>2001</strong>, 2000 and 1999, shipping<br />
and handling costs totaled $9.3 million, $7.1 million and $5.2 million, respectively.<br />
k. Warranty<br />
The Company warrants its products against defects in materials and workmanship for a period of one year. A<br />
provision for estimated future warranty is recorded when consumables are shipped and when title on instrumentation<br />
equipment passes to the customer.<br />
l. Foreign Currency Translation<br />
The Company’s reporting currency is the United States dollar. The subsidiaries’ functional currencies are primarily the<br />
local currency of the respective country. Balance sheets prepared in their functional currencies are translated to the<br />
reporting currency at exchange rates in effect at the end of the accounting period except for shareholders’ equity<br />
accounts, which are translated at rates in effect when these balances were originally recorded. Revenue and expense<br />
accounts are translated at a weighted average of exchange rates during the period. The cumulative effect of<br />
translation is included in accumulated other comprehensive loss in the accompanying consolidated balance sheets.<br />
m. Fair Value of Financial Instruments<br />
The carrying value of the Company’s cash and cash equivalents, notes receivable, accounts receivable, accounts<br />
payable and accrued liabilities approximate their fair values because of the short maturities of those instruments. The<br />
carrying value of the Company’s debt and capital leases approximate their fair values because of the short<br />
maturities and/or interest rates which are comparable to those available to the Company on similar terms.
n. Financial Instruments<br />
In the ordinary course of business, the Company purchases foreign currency exchange options to manage potential<br />
losses from foreign currency exposures. These options give the Company the right, but not the requirement, to sell<br />
foreign currencies in exchange for U.S. dollars at predetermined exchange rates. The principal objective of such<br />
options is to minimize the risks and/or costs associated with global financial and operating activities. The Company<br />
does not utilize financial instruments for trading or other speculative purposes. The Company accounts for these<br />
transactions in accordance with SFAS No. 133 ”Accounting for Derivative Instruments and Hedging Activities.”<br />
Premiums to purchase foreign exchange options are recorded as prepaid assets and amortized over the life of the<br />
option or immediately if the option is exercised. Amortization is included in other expense.<br />
The table below presents the notional amounts and the weighted average exchange rates for foreign currency<br />
exchange options as of December 31, <strong>2001</strong> and 2000. The options outstanding at December 31, <strong>2001</strong> expire at<br />
various dates through February 2002 and have a fair market value of approximately $6,000. The options outstanding<br />
at December 31, 2000 expired at various dates through February <strong>2001</strong> and had a fair market value of approximately<br />
$6,000. Gains or losses from changes in the fair market values are included in other miscellaneous income, net.<br />
<strong>2001</strong> 2000<br />
Notional Weighted<br />
Notional Weighted<br />
Notional Average Exchange Notional Average Exchange<br />
Functional Currency: Amount Rate Amount Rate<br />
German mark $ – – $4,600,000 1.9000<br />
European Union euro 5,600,000 1.0000 – –<br />
Swiss franc 1,200,000 1.5500 – –<br />
$ 6,800,000 $4,600,000<br />
39<br />
o. Authoritative Pronouncements<br />
In June <strong>2001</strong>, the Financial Accounting Standards Board (FASB) issued SFAS No. 141, ”Business Combinations”<br />
effective June 30, <strong>2001</strong> for business combinations that are consummated after July 1, <strong>2001</strong>, and SFAS No. 142,<br />
”Goodwill and Other Intangible Assets.” SFAS No. 141 eliminates the pooling-of-interests method for business combinations<br />
and requires use of the purchase method. SFAS No. 142 addresses how intangible assets should be<br />
accounted for upon their acquisition as well as how goodwill and other intangible assets should be accounted for<br />
after they have been initially recognized in the financial statements. With the adoption of this statement, goodwill is<br />
no longer subject to amortization over its estimated useful life. Goodwill will be assessed for impairment each year<br />
using the fair-value-based test. The Company will adopt this standard on January 1, 2002 and based on the<br />
analysis performed to date, adoption of this standard will not result in a material impairment of the carrying value of<br />
the goodwill or other intangible assets with indefinite lives. The adoption is expected to result in an approximately<br />
$1.0 million decrease in the annual amortization of goodwill and other intangible assets.<br />
In June <strong>2001</strong>, the FASB issued SFAS No. 143, ”Accounting for Asset Retirement Obligations”. SFAS No. 143 requires<br />
entities to record the fair value of a liability for an asset retirement obligation in the period in which the obligation is<br />
incurred. When the liability is initially recorded, the entity capitalizes the cost by increasing the carrying amount of<br />
the related long-lived asset. Over time, the liability is accreted to its present value each period, and the capitalized<br />
cost is depreciated over the useful life of the related asset. This statement is effective on January 1, 2003 with<br />
earlier application encouraged. The Company is currently reviewing this statement and has not yet determined its<br />
impact, if any, on the Company’s financial position, results of operations or cash flows.<br />
In August <strong>2001</strong>, the FASB issued SFAS No. 144, ”Accounting for the Impairment or Disposal of Long-Lived Assets”.<br />
SFAS No. 144 requires that long-lived assets be measured at the lower of carrying amount or fair value less cost to<br />
sell, whether reported in continuing operations or in discontinued operations. The statement is effective January 1, 2002<br />
and is not anticipated to have any impact on the Company’s financial position, results of operations or cash flows.
3. STOCK SPLIT AND PAR VALUE CURRENCY CONVERSION<br />
40<br />
The Company effected a four-for-one stock split during 2000, and a two-for-one stock split and par value currency<br />
conversion in 1999.<br />
To effect the four-for-one stock split, on June 16, 2000 the shareholders of the Company approved the amendment of<br />
the Company’s Articles of Association to increase the number of authorized shares of common stock from 65 million<br />
to 260 million. The Company’s Board of Supervisory Directors and Managing Board approved the split in May 2000.<br />
Common shareholders of record on July 3, 2000 received three additional shares for each share held on that date.<br />
The additional shares were distributed and the stock split was effective on July 13, 2000.<br />
On June 18, 1999, the shareholders of the Company approved the amendment of the Company’s Articles of<br />
Association to increase the number of authorized shares of common stock from 32.5 million to 65 million, which was<br />
required to effect the two-for-one stock split that the Company’s Board of Supervisory Directors and Managing Board<br />
approved in May 1999. Common shareholders of record on July 2, 1999 received one additional share for each<br />
share held on that date. The additional shares were distributed and the stock split was effective on July 16, 1999.<br />
Additionally, the Articles of Association were amended to convert the par value of the common shares from 0.03 NLG<br />
to 0.01 EUR.<br />
To reflect the conversion of the par value from 0.03 NLG to 0.01 EUR during 1999, common stock was decreased<br />
and additional paid-in capital was increased by $993,000.<br />
All share data and per share amounts presented have been restated to reflect the two-for-one and four-for-one stock splits.<br />
4. NET INCOME PER COMMON SHARE<br />
The following schedule summarizes the information used to compute earnings per common share:<br />
Years ended December 31,<br />
<strong>2001</strong><br />
2000<br />
1999<br />
Weighted average number of common<br />
shares used to compute basic net<br />
income per common share<br />
142,962,000<br />
2,093,000<br />
142,040,000<br />
3,031,000<br />
140,317,000<br />
1,869,000<br />
Dilutive effect of stock options<br />
Weighted average number of common<br />
shares used to compute diluted net<br />
income per common share<br />
145,055,000<br />
145,071,000<br />
142,186,000<br />
For the years ended December 31, <strong>2001</strong>, 2000 and 1999, stock options to purchase 1,845,000, 864,000 and<br />
591,000 shares, respectively, were excluded from the dilutive effect of stock options as such options were antidilutive.<br />
5. ACQUISITIONS<br />
On March 31, <strong>2001</strong>, the Company completed the acquisition of the Sawady group of companies (Sawady) located<br />
in Tokyo, Japan. Under the terms of the agreement <strong>QIAGEN</strong> N.V. issued 854,987 shares of its common stock,<br />
valued at the time of the closing at approximately $18.0 million, in exchange for all of the outstanding capital stock<br />
of Sawady Technology Co., Ltd., Omgen Co., Ltd. and a majority position in Accord Co., Ltd., the three companies<br />
comprising the Sawady group of companies. To date, the minority interest position in Accord Co., Ltd. has not been<br />
significant. The Sawady group of companies was managed and structured as one organization, but was organized<br />
as three companies to meet the tax planning and other preferences of its shareholders. In connection with this merger,<br />
the Company recorded acquisition and related charges of approximately $3.0 million, which include approximately<br />
$1.0 million of direct transaction costs, (primarily legal and other professional fees) and approximately $2.0 million of<br />
expenses primarily relating to the relocation, closure and elimination of leased facilities, such as duplicate field offices.<br />
The merger was accounted for as a pooling of interests and accordingly, the accompanying financial statements and<br />
footnotes have been restated to include the operations of Sawady for <strong>2001</strong> and 2000. For the years ended
December 31, <strong>2001</strong> (January 1, <strong>2001</strong> through March 31, <strong>2001</strong>, the date of the merger) and 2000, the Sawady<br />
revenues were approximately $2.8 million and $12.8 million, respectively. For the years ended December 31, <strong>2001</strong><br />
(January 1, <strong>2001</strong> through March 31, <strong>2001</strong>, the date of the merger) and 2000, the Sawady net income was<br />
approximately $144,000 and $897,000, respectively. The 1999 results of operations of Sawady were not<br />
significant and therefore not included in the accompanying 1999 results of operations or cash flows.<br />
On June 28, 2000, the Company completed the acquisition of Operon Technologies, Inc. (Operon) of Alameda,<br />
California, pursuant to an agreement and plan of merger with Operon Technologies dated as of June 9, 2000. Under<br />
the agreement, Operon shareholders received 2,392,432 shares of <strong>QIAGEN</strong> common stock for all outstanding<br />
shares of Operon stock. The Company also assumed outstanding Operon options, which were exercisable for an<br />
additional 422,024 Company shares. Operon Technologies manufactures and markets synthetic nucleic acids, DNA<br />
microarrays and synthetic genes. The synthetic nucleic acids are used in the analysis of nucleic acids purified from<br />
natural sources and have been integrated into the Company’s product line for its genomics and genetic analysis<br />
business. Subsequent to the acquisition, the Company transferred ownership of Operon, renamed <strong>QIAGEN</strong> Operon,<br />
Inc., to the Company’s United States holding company, QNAH.<br />
The acquisition of Operon was accounted for as a pooling of interests in accordance with Accounting Principles Board<br />
(APB) Opinion No. 16 and related Securities and Exchange Commission pronouncements. In connection with the<br />
acquisition, the Company incurred costs of $5.4 million. These costs include approximately $3.9 million of finder fees<br />
for the investment banker chosen by the shareholders of Operon. This fee was not paid for by the Company, but by<br />
the Operon shareholders. However, in accordance with the accounting rules for a pooling of interests transaction, this<br />
expense is reflected in the financial statements. The acquisition costs also include approximately $1.0 million in<br />
Netherlands capital tax, which is based on the amount of capital raised in share issuances. The prior periods financial<br />
data of the Company have been restated to include the results of operations, financial position and cash flows of<br />
Operon, as though it had always been consolidated. For the years ended December 31, 2000 (January 1, 2000<br />
through June 28, 2000, the date of the merger) and 1999, the Operon revenues were approximately $9.8 million<br />
and $13.3 million, respectively. For the years ended December 31, 2000 (January 1, 2000 through June 28, 2000, the<br />
date of the merger) and 1999, the Operon net income was approximately $767,000 and $1.3 million, respectively.<br />
On December 31, 1999, <strong>QIAGEN</strong> N.V. completed the acquisition of the shares of Rapigene, Inc., an indirect<br />
wholly-owned subsidiary of Celltech Group plc. This acquisition was made by issuing a $12.0 million note payable,<br />
which was subsequently paid in January 2000. The acquired company, renamed <strong>QIAGEN</strong> Genomics, Inc., is a<br />
leader in the area of innovative, enabling technologies and services for single nucleotide polymorphism (SNP)<br />
analyses as well as other genomic applications. The acquisition, accounted for as a purchase under APB Opinion<br />
No. 16, included the purchase of all of the stock of Rapigene, Inc. which, including acquisition costs, resulted in a<br />
total purchase price of $12.1 million. A portion of the purchase price has been allocated to the assets acquired and<br />
liabilities assumed based on the estimated fair market value at December 31, 1999. Independent appraisers<br />
utilizing proven valuation procedures and techniques identified portions of the purchase price, including intangible<br />
assets. These intangible assets include acquired in-process research and development, developed technology and<br />
know-how, and goodwill. As a result of the appraisal, $3.2 million was allocated to developed technology and know<br />
how and approximately $1.5 million was allocated to goodwill, after purchase accounting adjustments, to be<br />
amortized, using the straight-line method, over seven and ten years, respectively. A charge of $5.1 million for<br />
purchased in-process research and development was included in the Company’s fourth quarter 1999 results. This<br />
charge represents the estimated fair value based on risk-adjusted cash flows related to the in-process research and<br />
development projects. At the date of acquisition, the development of these projects had not yet reached technological<br />
feasibility and the research and development in progress had no alternative future uses. The results of operations of<br />
the acquired company are included in the consolidated results for the Company from the date of acquisition.<br />
Subsequent to the acquisition, the Company transferred ownership of <strong>QIAGEN</strong> Genomics, Inc., to the Company’s<br />
United States holding company, QNAH.<br />
The following unaudited pro forma consolidated data summarize the operations for the periods indicated as if the<br />
acquisition had been completed on January 1, 1998. The pro forma data excludes the $5.1 million for purchased<br />
41
in-process research and development. These pro forma amounts are intended for informational purposes only and are<br />
not necessarily indicative of the results of operations that would have occurred had the purchase been made at the<br />
beginning of the periods presented or of the future results of the combined operations.<br />
Years ended December 31,<br />
Net Sales<br />
Net Income<br />
Basic Earnings per Share<br />
Diluted Earnings per Share<br />
1999<br />
$ 158,612,000<br />
$ 15,422,000<br />
$ 0.11<br />
$ 0.11<br />
1998<br />
$ 121,103,000<br />
$ 10,399,000<br />
$ 0.07<br />
$ 0.07<br />
6. COMPREHENSIVE INCOME<br />
42<br />
On January 1, 1998, the Company adopted SFAS No. 130, ”<strong>Report</strong>ing Comprehensive Income.” SFAS No. 130<br />
requires that comprehensive income, which is the total of net income and all other non-owner changes in equity, be<br />
displayed in the financial statements. The adoption of SFAS No. 130 had no impact on total shareholders’ equity.<br />
The components of the Company’s comprehensive income or loss as presented in the Consolidated Statements of<br />
Shareholders’ Equity include net income, unrealized gains and losses from foreign currency translation, and<br />
unrealized gains and losses from available-for-sale marketable securities. The Company does not expect any tax<br />
impacts from realized gains or losses on marketable securities. The following table is a summary of the components<br />
of accumulated other comprehensive loss:<br />
Net unrealized gain on marketable securities<br />
Foreign currency translation adjustments<br />
Accumulated other comprehensive loss<br />
<strong>2001</strong><br />
$ 1,064,000<br />
(9,942,000)<br />
$ (8,878,000)<br />
2000<br />
$ 5,966,000<br />
(6,367,000)<br />
$ (401,000)<br />
7. MARKETABLE SECURITIES<br />
At December 31, <strong>2001</strong> and 2000 the investments in the following table are classified as current, as the Company’s<br />
plan is generally not to hold its investments until maturity to take advantage of market conditions.<br />
The contractual maturities of corporate debt securities at December 31, <strong>2001</strong> and 2000 are as follows:<br />
Maturities due:<br />
Within one year<br />
One to five years<br />
Five to ten years<br />
Over ten years<br />
Cost<br />
$ –<br />
6,007,000<br />
15,040,000<br />
1,500,000<br />
$ 22,547,000<br />
<strong>2001</strong> 2000<br />
Fair Value<br />
Cost<br />
Fair Value<br />
$ –<br />
$ 3,564,000 $ 3,526,000<br />
5,995,000<br />
15,768,000 15,762,000<br />
15,028,000<br />
16,536,000 16,532,000<br />
1,489,000<br />
1,500,000 1,487,000<br />
$ 22,512,000<br />
$ 37,368,000 $ 37,307,000<br />
Marketable securities maturing within one year consist of commercial paper and corporate securities. Marketable<br />
securities maturing after one year consist of corporate securities. At December 31, <strong>2001</strong>, the Company recognized<br />
unrealized gains of $46,000 and unrealized losses of $77,000, and realized previously unrealized losses of<br />
$60,000. At December 31, 2000, the Company recognized unrealized gains of $146,000 and unrealized losses of<br />
$40,000. Unrealized gains and losses, net of any realized amounts are included in other comprehensive income or loss.
During 1997, the Company purchased a four-percent investment in a start-up company, Genome Pharmaceuticals<br />
Corporation AG (GPC), for $289,000. In November 2000, GPC completed an IPO and the Company’s investment<br />
was converted to 224,000 shares of GPC common stock and reclassified as a long-term marketable security. At<br />
December 31, <strong>2001</strong>, the Company recognized net unrealized losses of $3.9 million, and during the year recognized<br />
previously unrealized gains of $1.4 million, included in other miscellaneous income, and at December 31, 2000, the<br />
Company recognized an unrealized gain of approximately $6.0 million on these shares. The Company intends to<br />
hold these shares for more than one year.<br />
During <strong>2001</strong>, the Company entered into a securities lending arrangement with Deutsche Bank and transferred<br />
20,000 shares to Deutsche Bank in January 2002. The Company is restricted from selling the 20,000 shares during<br />
the one-year lending period. The Company retains all other rights to the shares and Deutsche Bank guarantees the<br />
return of the shares after the lending period. In <strong>2001</strong>, the Company held one of six seats on GPC’s Board of Directors.<br />
For the years ended December 31, <strong>2001</strong>, 2000 and 1999, proceeds from sales of available-for-sale securities totaled<br />
$16.3 million, $23.6 million and $28.8 million, respectively, and calculated on the specific identification method,<br />
realized gains during <strong>2001</strong> totaled $1.3 million and realized losses during 1999 totaled $11,000. There were no<br />
realized gains or losses during 2000.<br />
8. PROPERTY, PLANT AND EQUIPMENT<br />
43<br />
Property, plant and equipment are summarized as follows as of December 31, <strong>2001</strong> and 2000:<br />
Land and buildings<br />
Machinery and equipment<br />
Computer software<br />
Furniture and office equipment<br />
Leasehold improvements<br />
Construction in progress<br />
Less: Accumulated depreciation<br />
and amortization<br />
Property, plant and equipment, net<br />
<strong>2001</strong><br />
$ 28,317,000<br />
37,144,000<br />
7,893,000<br />
21,110,000<br />
5,015,000<br />
103,612,000<br />
203,091,000<br />
(42,726,000)<br />
$ 160,365,000<br />
2000<br />
$ 25,673,000<br />
28,049,000<br />
5,324,000<br />
18,531,000<br />
3,746,000<br />
24,776,000<br />
106,099,000<br />
(32,943,000)<br />
$ 73,156,000<br />
For the years ended December 31, <strong>2001</strong>, 2000 and 1999 depreciation expense totaled $12.9 million, $9.6 million<br />
and $7.8 million, respectively. Repairs and maintenance expense was $2.8 million, $1.8 million and $1.4 million<br />
in fiscal years <strong>2001</strong>, 2000 and 1999, respectively.<br />
At December 31, <strong>2001</strong> and 2000, construction in progress includes construction and overhead costs of $89.5 million<br />
and $13.2 million, respectively, directly related to the construction of the Company’s new research and manufacturing<br />
facility, <strong>QIAGEN</strong> Sciences, Inc. located in Germantown, Maryland and the new production and administration<br />
buildings at <strong>QIAGEN</strong> GmbH in Hilden, Germany. Of these amounts, $2.2 million represents interest capitalized in<br />
accordance with SFAS No. 34 at December 31, <strong>2001</strong>. There was no capitalized interest at December 31, 2000.<br />
Additionally, during <strong>2001</strong>, <strong>QIAGEN</strong> Sciences, Inc. received State and County loans totaling $3.6 million to be used<br />
for the land purchase and facility construction costs. Upon <strong>QIAGEN</strong> Sciences, Inc. achieving certain employment<br />
levels, these loans are permanently forgiven. Upon conversion, the grant will be recorded as a reduction to the cost of<br />
the assets. Should the criteria not be met, the loan becomes payable. At December 31, <strong>2001</strong>, no amounts of the loan<br />
had been earned. The $3.6 million was included in other long-term liabilities in the accompanying balance sheet.
9. INVESTMENTS<br />
44<br />
During <strong>2001</strong>, the Company made investments totaling $613,000 for a 15.55 percent interest in QBM Cell Science,<br />
a company formed for the purpose of owning, developing and commercializing a technology relating to the use<br />
of cryopreserved neuronal and non-neuronal cells in cell culture products. The investment is accounted for under the<br />
cost method.<br />
In November 1999, <strong>QIAGEN</strong> AG entered a joint venture agreement for the formation of PreAnalytiX to develop,<br />
manufacture and market integrated systems for the collection, stabilization and purification of nucleic acids for<br />
molecular diagnostic testing. <strong>QIAGEN</strong> AG has a 50 percent interest (initially purchased for CHF 1,504,800,<br />
approximately $906,000 at December 31, <strong>2001</strong>), which is accounted for under the equity method. For the years<br />
ended December 31, <strong>2001</strong>, 2000 and 1999, <strong>QIAGEN</strong> AG recorded losses from this equity investment of CHF 2.3<br />
million (approximately $1.4 million), CHF 1.4 million (approximately $835,000) and CHF 496,000 (approximately<br />
$330,000), respectively. During the year ended December 31, <strong>2001</strong>, <strong>QIAGEN</strong> GmbH had sales to PreAnalytiX of<br />
$1.5 million. At December 31, <strong>2001</strong>, <strong>QIAGEN</strong> GmbH had accounts receivables from PreAnalytiX totaling<br />
$440,000. During <strong>2001</strong>, both joint venture partners each loaned CHF 3.0 million (approximately $1.8 million at<br />
December 31, <strong>2001</strong>) to the venture at a 4.0% interest rate. It is anticipated that both joint venture partners will<br />
convert the loan balances to additional capital at some future date. There was no amount receivable at December<br />
31, 2000. In <strong>2001</strong>, the Company held three of six seats on PreAnalytix’s Management Committee, for which there<br />
is also one independent director.<br />
In November 1999, the Company had purchased an investment in ENPharma L.P., a limited partnership established<br />
to license, market and develop certain intellectual property, for CAD 250,000, (approximately $171,000 at<br />
December 31, 1999). During 2000, the Company sold its 12.3 percent interest in ENPharma L.P. to an employee<br />
for book value, approximately $100,000. As the investment in the limited partnership exceeded 3 percent, it had<br />
been accounted for under the equity method up to the date of the sale and the Company had recorded losses from<br />
this equity investment of $35,000 and $34,000 for the years ended December 31, 2000 and 1999, respectively.<br />
In June of 1999, the Company acquired 15.6 (15.4 percent of the common stock) percent of the voting rights of<br />
Zeptosens AG for $1.7 million. During <strong>2001</strong>, the Company made an additional investment of $903,000 and now<br />
holds 18.6 percent of the voting rights (24.6 percent of the common stock). Zeptosens is focused on developing and<br />
commercializing bioanalytical technologies for use in life sciences as well as in food and environmental analysis. The<br />
investment is accounted for under the cost method. At December 31, <strong>2001</strong>, <strong>QIAGEN</strong> GmbH had receivables from<br />
Zeptosens in the amount of $136,000. At December 31, 2000, <strong>QIAGEN</strong> N.V. had a note receivable from Zeptosens<br />
in the amount of $617,000, which was collected in January <strong>2001</strong>. In <strong>2001</strong>, the Company held one of six seats on<br />
Zeptosens’ Board of Directors, and members of the Company’s management and Board had interests in Zeptosens<br />
totaling 1.3 percent.<br />
On September 23, 1998, the Company acquired an investment in Ingenium Pharmaceuticals AG. At December 31,<br />
<strong>2001</strong>, the Company’s investment totaled $511,000, representing a 0.9 percent interest. The investment is accounted<br />
for under the cost method. In <strong>2001</strong>, the Company held one of three seats on Ingenium’s Board of Directors, and<br />
members of the Company’s management and Board had interests in Ingenium totaling 2.0 percent.<br />
In 1998, <strong>QIAGEN</strong> GmbH entered a joint venture agreement for the formation of QE-Diagnostiksysteme GmbH, a<br />
company focusing on developing and providing enabling technologies for the molecular diagnostic industry. At<br />
December 31, <strong>2001</strong>, <strong>QIAGEN</strong> GmbH had a 50 percent interest (EUR 256,000, approximately $228,000), which<br />
is accounted for under the equity method. QE-Diagnostiksysteme began operations during 1999 and the Company<br />
recorded a loss from the equity investment of EUR 256,000. The Company does not anticipate recording any equity<br />
pick-up until such time as the net income of QE-Diagnostiksysteme exceeds previous losses. At December 31, <strong>2001</strong><br />
and 2000, <strong>QIAGEN</strong> GmbH had receivables from QE-Diagnostiksysteme GmbH in the amount of $242,000 and<br />
$86,000, respectively. In <strong>2001</strong>, the Company held one of four seats on QE-Diagnostiksysteme’s Board of Directors.
On March 20, 1997, the Company sold certain research and licensing agreements valued at $500,000 to a newly<br />
founded company, Coley Pharmaceutical Group, Inc. (Coley) (formerly CpG ImmunoPharmaceuticals, Inc.), for<br />
2,040 shares of its preferred stock. In May 2000 and in June 1999, the Company invested an additional $500,000<br />
and $499,000, respectively, bringing the Company’s total interest to 7.97 percent. At December 31, <strong>2001</strong> and<br />
2000, the Company had receivables from Coley in the amount of $19,000 and $65,000, respectively. The<br />
investment is accounted for under the cost method. In <strong>2001</strong>, the Company held one of nine seats on Coley’s Board<br />
of Directors, and members of the Company’s management and Board had interests in Coley totaling 9.9 percent.<br />
The Company periodically reviews the carrying value of these investments for impairment, considering factors such<br />
as the most recent stock transactions and book value from the most recent financial statements. These investments are<br />
included in other assets in the accompanying consolidated balance sheets.<br />
10. INTANGIBLE ASSETS<br />
In September <strong>2001</strong>, the Company entered a development, supply and marketing agreement with Polysciences, Inc.<br />
for the development and marketing of certain of Polysciences’ existing and future magnetic polymer technologies. In<br />
exchange for exclusive rights to the technology, the Company gave Polysciences $829,000 and 52,399 common<br />
shares (valued at approximately $746,000 at the time of the exchange). This license is being amortized over the<br />
seven-year contract life.<br />
In January 2000, the Company entered a collaboration agreement with Zeptosens AG for the manufacture and<br />
marketing of products. The Company has purchased licensing rights for approximately $397,000.<br />
Through December 31, <strong>2001</strong>, for intangibles acquired before June 30, <strong>2001</strong>, all patents and licensing rights were<br />
amortized straight line over periods of three to seven years. The Company recognized amortization expense relating<br />
to patents and licensing rights of $509,000, $450,000 and $384,000 for the years ended December 31, <strong>2001</strong>,<br />
2000 and 1999, respectively. The cost of intangible assets is evaluated periodically and adjusted, if necessary, if<br />
later events and circumstances indicate that a permanent decline in value below the current unamortized historical<br />
cost has occurred.<br />
The Company recorded identified intangible assets in connection with the purchase of <strong>QIAGEN</strong> Genomics, Inc. on<br />
December 31, 1999. These intangible assets were capitalized and consist of developed technology and know-how,<br />
and goodwill. Based on the appraisal, $3.2 million was allocated to developed technology and know-how and<br />
approximately $1.5 million was allocated to goodwill, after purchase accounting adjustments, to be amortized<br />
straight line over seven and ten years, respectively. In each of the years ended December 31, <strong>2001</strong> and 2000, the<br />
Company recorded amortization expense of $607,000 on these intangibles. In connection with the adoption of<br />
SFAS No. 142, amortization over the previously identified lives will cease, and the intangibles will be assessed for<br />
impairment each year using a fair-value-based test.<br />
In connection with its formation, <strong>QIAGEN</strong> K.K., entered into a business transfer agreement with its minority<br />
shareholder. Pursuant to the agreement, the minority shareholder agreed to transfer to <strong>QIAGEN</strong> K.K. certain<br />
intangible assets, such as certain ”know-how” and marketing information relating to the sale of the Company’s<br />
products, in exchange for 330 million Japanese Yen (approximately $2.9 million at December 31, 1999). The<br />
Company made the payment of 330 million Japanese Yen on August 31, 1998, and capitalized the intangible assets,<br />
which are being amortized straight-line over seven years. During <strong>2001</strong>, 2000 and 1999, the Company recorded<br />
amortization expense relating to these intangible assets of approximately $361,000, $373,000 and $415,000,<br />
respectively. In connection with the adoption of SFAS No. 142, amortization over the previously identified life will<br />
cease, and the intangibles will be assessed for impairment each year using a fair-value-based test.<br />
45<br />
11. INCOME TAXES<br />
Under SFAS No. 109, deferred income tax assets or liabilities are computed based on the temporary difference<br />
between the financial statement and income tax bases of assets and liabilities using the enacted marginal income tax<br />
rate in effect for the year in which the differences are expected to reverse. Deferred income tax expenses or credits<br />
are based on the changes in the deferred income tax assets or liabilities from period to period.
The Company has recorded a net deferred tax asset of $12.5 million at December 31, <strong>2001</strong>. Realization is<br />
dependent on generating sufficient taxable income in the future. Although realization is not assured, management<br />
believes it is more likely than not that all of the net deferred tax asset will be realized. To the extent that future<br />
valuation allowances are required, the effect of the allowance will be recorded in the provision for income taxes in<br />
the period the determination is made.<br />
The components of the net deferred tax asset at December 31, <strong>2001</strong> and 2000 are as follows:<br />
<strong>2001</strong><br />
2000<br />
Deferred tax asset:<br />
Allowance for bad debts<br />
$ 541,000<br />
$ 205,000<br />
Bonus/commission accrual<br />
155,000<br />
102,000<br />
Vacation accrual<br />
368,000<br />
315,000<br />
Warranty accrual<br />
103,000<br />
128,000<br />
46<br />
Accrued liabilities<br />
Depreciation and amortization<br />
1,506,000<br />
346,000<br />
1,210,000<br />
534,000<br />
Tax credits<br />
460,000<br />
–<br />
Net operating loss carryforward<br />
4,864,000<br />
5,775,000<br />
Inventories<br />
3,940,000<br />
3,616,000<br />
Deferred revenues<br />
521,000<br />
213,000<br />
Capitalized start-up costs<br />
1,660,000<br />
546,000<br />
United States state income taxes<br />
–<br />
90,000<br />
Capital leases<br />
327,000<br />
374,000<br />
Other<br />
149,000<br />
170,000<br />
14,940,000<br />
13,278,000<br />
Deferred tax liability:<br />
Depreciation and amortization<br />
(146,000)<br />
(142,000)<br />
Inventory<br />
(346,000)<br />
(262,000)<br />
Accrued liabilities<br />
(313,000)<br />
(367,000)<br />
Intangibles<br />
(990,000)<br />
(1,175,000)<br />
United States state income taxes<br />
(247,000)<br />
–<br />
Other<br />
(381,000)<br />
(514,000)<br />
(2,423,000)<br />
(2,460,000)<br />
Net deferred tax assets<br />
$ 12,517,000<br />
$ 10,818,000<br />
Deferred tax assets and liabilities are reflected on the Company’s consolidated balance sheets at December 31, <strong>2001</strong><br />
and 2000 as follows:<br />
Current deferred tax asset<br />
Current deferred tax liabilities<br />
Non-current deferred tax asset<br />
Non-current deferred tax liabilities<br />
Net deferred tax assets<br />
<strong>2001</strong><br />
$ 11,123,000<br />
(410,000)<br />
1,804,000<br />
–<br />
$ 12,517,000<br />
2000<br />
$ 11,866,000<br />
(499,000)<br />
–<br />
(549,000)<br />
$ 10,818,000
As of December 31, <strong>2001</strong> and 2000, the Company had a net operating loss (NOL) carryforward of approximately<br />
$8.6 million and $11.8 million, respectively. These NOLs were generated primarily from the exercise of employee<br />
stock options and operating losses that were acquired with the purchase of Rapigene, Inc. (now <strong>QIAGEN</strong> Genomics,<br />
Inc.). These NOLs will expire in various years through 2020. Federal tax law limits the use of NOLs from <strong>QIAGEN</strong><br />
Genomics, Inc., which amount to $2.2 million at December 31, <strong>2001</strong>. In addition, the Company had state NOLs<br />
equal to approximately $1.4 million and $5.0 million at December 31, <strong>2001</strong> and 2000, respectively. These NOLs<br />
expire at various times through 2005.<br />
As of December 31, <strong>2001</strong> and 2000, the Company had NOL carryforwards totaling approximately $6.9 million and<br />
$2.7 million, respectively. These NOLs were primarily generated from operating losses from the Company’s newer<br />
subsidiaries, <strong>QIAGEN</strong> Operon GmbH and <strong>QIAGEN</strong> S.p.A., and include the NOL acquired with the acquisition of Rosys<br />
(now <strong>QIAGEN</strong> Instruments, AG). At December 31, <strong>2001</strong>, a portion of these NOLs, approximately $4.0 million, expires<br />
in various years through 2007. The balance does not expire. At December 31, <strong>2001</strong>, the Company’s foreign holding<br />
company also has an NOL of $2.3 million with a full valuation allowance. This NOL does not expire.<br />
Income before income taxes for the years ended December 31, <strong>2001</strong>, 2000 and 1999 consisted of:<br />
Years Ended December 31,<br />
47<br />
<strong>2001</strong><br />
2000<br />
1999<br />
United States pretax income<br />
$ 6,611,000<br />
$ 4,191,000<br />
$ 8,913,000<br />
Non-United States pretax income<br />
49,712,000<br />
34,933,000<br />
16,075,000<br />
$ 56,323,000<br />
$ 39,124,000<br />
$ 24,988,000<br />
The provisions for income taxes for the years ended December 31, <strong>2001</strong>, 2000 and 1999 are as follows:<br />
Years Ended December 31,<br />
<strong>2001</strong><br />
2000<br />
1999<br />
Current<br />
- United States federal taxes<br />
$ 1,602,000<br />
$ 4,165,000<br />
$ 4,675,000<br />
- United States state taxes<br />
1,005,000<br />
1,184,000<br />
1,086,000<br />
- Non-United States taxes<br />
21,078,000<br />
14,182,000<br />
6,558,000<br />
23,685,000<br />
19,531,000<br />
12,319,000<br />
Deferred - United States federal taxes<br />
391,000<br />
(987,000)<br />
(207,000)<br />
- United States state taxes<br />
(190,000)<br />
(210,000)<br />
(52,000)<br />
- Non-United States taxes<br />
(1,990,000)<br />
(249,000)<br />
(1,110,000)<br />
(1,789,000)<br />
(1,446,000)<br />
(1,369,000)<br />
Total provision for income taxes<br />
$ 21,896,000<br />
$ 18,085,000<br />
$ 10,950,000
Differences between the provision for income taxes and income taxes at the United States statutory federal income<br />
tax rate for the years ended December 31, <strong>2001</strong>, 2000 and 1999 are as follows:<br />
48<br />
Years Ended December 31,<br />
<strong>2001</strong> 2000 1999<br />
Amount Percent Amount Percent Amount Percent<br />
Income taxes at United States<br />
statutory federal rate<br />
$ 19,150,000 34.0% $ 13,302,000 34.0% $ 8,496,000 34.0%<br />
United States state income taxes,<br />
net of federal income tax effect 509,000 0.9% 320,000 0.8% 499,000 2.0%<br />
Non-United States taxes at rates<br />
greater than United<br />
States statutory federal rate 2,186,000 3.9% 2,103,000 5.4% 111,000 0.4%<br />
Nondeductible acquisition costs<br />
– – 2,142,000 5.5%<br />
– –<br />
Nondeductible goodwill<br />
amortization<br />
56,000 0.1% 60,000 0.1%<br />
– –<br />
Nondeductible purchased inprocess<br />
research & development<br />
– –<br />
– – 2,008,000 8.0%<br />
Other items, net<br />
(5,000) 0.0% 158,000 0.4% (164,000) (0.6%)<br />
Total provision for income taxes $ 21,896,000 38.9% $ 18,085,000 46.2% $10,950,000 43.8%<br />
12. ACCRUED LIABILITIES<br />
Accrued liabilities at December 31, <strong>2001</strong> and 2000 consist of the following:<br />
Payroll and related accruals<br />
Management bonuses<br />
Warranty<br />
Professional and other fees<br />
Sales and other taxes<br />
Deferred revenue<br />
Royalties<br />
Checks in excess of cash balance<br />
Prepaid VAR discount<br />
Other<br />
Total accrued liabilities<br />
<strong>2001</strong><br />
$ 3,899,000<br />
539,000<br />
887,000<br />
3,277,000<br />
1,716,000<br />
1,286,000<br />
5,487,000<br />
308,000<br />
1,550,000<br />
1,286,000<br />
$ 20,235,000<br />
2000<br />
$ 4,114,000<br />
482,000<br />
605,000<br />
2,433,000<br />
1,855,000<br />
904,000<br />
3,949,000<br />
665,000<br />
–<br />
871,000<br />
$ 15,878,000<br />
13. LINES OF CREDIT AND DEBT<br />
The Company has eight separate lines of credit amounting to $9.6 million of which approximately $6.0 million was<br />
utilized at December 31, <strong>2001</strong>. Interest rates on amounts drawn against these lines of credit outstanding as of<br />
December 31, <strong>2001</strong> ranged from 3.88 percent to 7.25 percent, with an effective weighted average rate of 5.92 percent.<br />
Some of the lines of credit, $1.5 million, may be called without notice, and are collateralized by accounts receivable<br />
and equipment. The availability of total credit is reduced by approximately $602,000 due to guarantees made by a<br />
bank against one of the credit facilities. At December 31, <strong>2001</strong> and 2000, the Company had $281,000 and<br />
$6.4 million, respectively, of short-term borrowings outstanding. The weighted average interest rates on these borrowings<br />
were 1.88 percent and 5.28 percent, respectively. Interest expense on line of credit and short-term borrowings was<br />
$302,000, $170,000 and $324,000 for the years ended December 31, <strong>2001</strong>, 2000 and 1999, respectively.
Long-term debt consists of the following:<br />
Note payable bearing interest at Prime Rate<br />
(9.5% at December 31, 2000), due in 2004<br />
Note was repaid in June <strong>2001</strong><br />
<strong>2001</strong><br />
$ –<br />
2000<br />
$ 625,000<br />
Note payable bearing interest at Prime Rate<br />
(9.5% at December 31, 2000), due in 2005<br />
Note was repaid in June <strong>2001</strong><br />
–<br />
1,119,000<br />
3.75% note due in semi-annual payments of EUR 252,000<br />
(approximately $224,000 at December 31, <strong>2001</strong>)<br />
beginning in September <strong>2001</strong> with a final payment<br />
due in March 2009<br />
8,533,000<br />
9,600,000<br />
Note payable bearing interest at EURIBOR (3.34%<br />
at December 28, <strong>2001</strong>) plus 1.2%, due in one final<br />
payment of EUR 20,374,000 in May 2003<br />
18,135,000<br />
–<br />
Note payable bearing interest at EURIBOR (3.34%<br />
at December 28, <strong>2001</strong>) plus 1.2%, due in one final<br />
payment of EUR 50,000,000 May 2003<br />
44,505,000<br />
–<br />
49<br />
Four notes payable totaling JPY 90,102,000 at<br />
December 31, <strong>2001</strong>, bearing interest at various rates<br />
ranging from 0.49% to 2.33%<br />
with various due dates through March 2006<br />
685,000<br />
1,279,000<br />
Total long-term debt<br />
71,858,000<br />
12,623,000<br />
Less current portion of long-term debt<br />
1,138,000<br />
1,071,000<br />
Long-term portion of long-term debt<br />
$ 70,720,000<br />
$ 11,552,000<br />
Future principal maturities of long-term debt as of December 31, <strong>2001</strong> are as follows:<br />
Year ending December 31,<br />
2002<br />
2003<br />
2004<br />
2005<br />
2006<br />
Thereafter<br />
$ 1,138,000<br />
64,001,000<br />
1,557,000<br />
1,172,000<br />
1,146,000<br />
2,844,000<br />
$ 71,858,000<br />
Interest expense, net of capitalized interest of approximately $2.2 million, on long-term debt was $321,000,<br />
$604,000 and $127,000 for the years ended December 31, <strong>2001</strong>, 2000 and 1999, respectively.<br />
The two euro denominated notes totaling EUR 70.4 million are part of new loan facilities obtained in <strong>2001</strong><br />
that allow the Company to borrow up to a total of EUR 100.0 million (approximately $89.0 million at December 31,<br />
<strong>2001</strong>). These new loan facilities have an initial term of two years. The loan agreements contain certain<br />
financial and non-financial covenants, including but not limited to the encumbrance of land and accounts<br />
receivable, restriction on the transfer of any patents to third parties and the maintenance of certain financial<br />
ratios. The Company was in compliance with these covenants at December 31, <strong>2001</strong>. The proceeds of these<br />
facilities are primarily dedicated to the refinancing of previously made acquisitions of land and the construction of<br />
manufacturing, research and administrative facilities thereon. In February 2002, the EUR 50.0 million note was<br />
amended to be U.S. dollar denominated and the amount was fixed at $43.5 million at an interest rate of LIBOR<br />
plus 1.28 percent.
14. STOCK OPTIONS<br />
On April 30, 1996, the Company adopted the <strong>QIAGEN</strong> N.V. 1996 Employee, Director and Consultant Stock Option<br />
Plan (the Option Plan). The Option Plan allows for incentive stock options, as well as for non-qualified options,<br />
generally with terms of 10 years, subject to earlier termination in certain situations. The options vest over a three-year<br />
period. The exercise price of the options is determined by the Board or by the Compensation Committee, and to date<br />
all grants have been at the market value on the date of the grant. The Company has reserved 18,968,000 shares of<br />
common stock for issuance under this plan.<br />
In connection with the acquisition of Operon (see Note 5), the Company exchanged 422,024 <strong>QIAGEN</strong> options for<br />
all of the outstanding options of Operon. These exchanged options vest over 4 years.<br />
Information regarding the Option Plan as of December 31, 1999, 2000 and <strong>2001</strong>, and changes during the years<br />
then ended is summarized as follows:<br />
Option<br />
Shares<br />
Weighted Average<br />
Exercise Price<br />
50<br />
December 31, 1998<br />
Granted<br />
5,011,094<br />
2,761,289<br />
$ 3.67<br />
9.66<br />
Exercised<br />
(926,772)<br />
3.01<br />
Forfeited<br />
(340,319)<br />
6.37<br />
December 31, 1999<br />
6,505,292<br />
$ 6.17<br />
Granted<br />
1,898,562<br />
37.22<br />
Exercised<br />
(1,117,424)<br />
4.23<br />
Forfeited<br />
(285,413)<br />
16.59<br />
December 31, 2000<br />
7,001,017<br />
$ 14.47<br />
Granted<br />
2,713,415<br />
21.11<br />
Exercised<br />
(862,914)<br />
4.82<br />
Forfeited<br />
(619,861)<br />
33.97<br />
December 31, <strong>2001</strong><br />
8,231,657<br />
$ 16.28<br />
At December 31, <strong>2001</strong>, 2000 and 1999, 3,969,284, 3,269,928 and 2,540,667 options were exercisable at a<br />
weighted average price of $9.64, $4.63 and $2.70 per share, respectively. The weighted average fair value<br />
of options granted during <strong>2001</strong>, 2000 and 1999 was $14.38, $28.38 and $4.46, respectively. The options<br />
outstanding at December 31, <strong>2001</strong> expire in various years through 2011. Information about stock options<br />
outstanding at December 31, <strong>2001</strong> is summarized as follows:<br />
Range of<br />
Exercise Prices<br />
Number<br />
Outstanding<br />
at 12/31/01<br />
Weighted<br />
Average<br />
Remaining<br />
Contract Life<br />
Weighted<br />
Average<br />
Exercise<br />
Price<br />
Number<br />
Exercisable<br />
at 12/31/01<br />
Weighted<br />
Average<br />
Exercise<br />
Price<br />
$ 0.97 - $ 5.63<br />
1,772,461<br />
4.93 Years<br />
$ 2.66<br />
1,750,123<br />
$ 2.66<br />
$ 5.70 - $ 8.77<br />
1,869,591<br />
7.07 Years<br />
$ 8.30<br />
1,373,342<br />
$ 8.15<br />
$ 8.77 - $ 18.56<br />
1,491,629<br />
9.18 Years<br />
$ 15.27<br />
271,604<br />
$ 11.23<br />
$ 9.00 - $ 34.59<br />
1,748,443<br />
9.04 Years<br />
$ 21.89<br />
205,281<br />
$ 20.90<br />
$ 34.59 - $ 49.75<br />
1,349,533<br />
8.66 Years<br />
$ 39.04<br />
368,934<br />
$ 40.84<br />
$ 0.97 - $ 49.75<br />
8,231,657<br />
7.67 Years<br />
$ 16.28<br />
3,969,284<br />
$ 9.64
The Company has elected to adopt SFAS No. 123 for disclosure purposes only and applies APB Opinion No. 25<br />
and related interpretations in accounting for its employee stock options. No compensation cost was recognized<br />
relating to options for the years ended December 31, <strong>2001</strong>, 2000 and 1999. Had compensation cost for the stock<br />
options awarded under the Option Plan been determined based on the fair value at the dates of grant consistent with<br />
the methodology of SFAS No. 123, the Company’s net income and basic and diluted earnings per share would have<br />
reflected the following pro forma amounts:<br />
<strong>2001</strong><br />
2000<br />
1999<br />
Pro forma net income<br />
$ 26,571,000<br />
$ 8,055,000<br />
$ 10,178,000<br />
Pro forma basic net income per share<br />
$ 0.19<br />
$ 0.06<br />
$ 0.07<br />
Pro forma diluted net income per share<br />
$ 0.18<br />
$ 0.06<br />
$ 0.07<br />
The fair value of each option grant is estimated on the date of grant using the Black-Scholes option pricing model with<br />
the following assumptions used for the grants: weighted average risk-free interest rates of 4.33 percent, 6.25 percent<br />
and 5.40 percent and a weighted average expected life of six years for the years ended December 31, <strong>2001</strong>, 2000<br />
and 1999, respectively. The weighted average expected volatility was 75 percent, 84 percent, and 45 percent for<br />
the years ended December 31, <strong>2001</strong>, 2000 and 1999, respectively. It is assumed that no dividends would be issued<br />
during the option term.<br />
The Black-Scholes option valuation model was developed for use in estimating the fair value of traded options that<br />
have no vesting restrictions and are fully transferable. Option value models also require the input of highly subjective<br />
assumptions such as expected option life and expected stock price volatility. Because the Company’s stock-based<br />
compensation plans have characteristics significantly different from those of traded options and because changes in the<br />
subjective input assumptions can materially affect the fair value estimate, the Company believes that the existing option<br />
valuation model does not necessarily provide a reliable single measure of the fair value of awards from this plan.<br />
51<br />
15. COMMITMENTS AND CONTINGENCIES<br />
a. Lease Commitments<br />
The Company leases facilities and equipment under operating lease arrangements expiring in various years through<br />
2018. Certain facility and equipment leases constitute capital leases. The accompanying consolidated financial<br />
statements include the assets and liabilities arising from these capital lease obligations.<br />
Minimum future obligations under capital and operating leases at December 31, <strong>2001</strong> are as follows:<br />
Capital Leases<br />
Operating Leases<br />
2002 $ 1,789,000 $ 4,521,000<br />
2003 1,554,000 4,616,000<br />
2004 1,274,000 3,092,000<br />
2005 1,140,000 1,187,000<br />
2006 930,000 121,000<br />
Thereafter 10,678,000 794,000<br />
17,365,000 $ 14,331,000<br />
Less: Amount representing interest (5,817,000)<br />
11,548,000<br />
Less: Current portion (1,085,000)<br />
$10,463,000<br />
Rent expense under noncancelable operating lease agreements was $6.6 million, $5.8 million and $3.7 million for<br />
the years ended December 31, <strong>2001</strong>, 2000 and 1999, respectively.
. Purchase Commitments<br />
At December 31, <strong>2001</strong>, the Company had commitments with several vendors to purchase certain products during<br />
2002, 2003 and 2004 totaling approximately $9.0 million, $4.8 million and $7.5 million, respectively.<br />
c. Commitments<br />
52<br />
<strong>QIAGEN</strong> Sciences, Inc. (Sciences) had contractually committed to approximately $51.5 million related to the<br />
construction of an approximately 200,000 square foot facility located in Germantown, Maryland. During <strong>2001</strong>, most<br />
of the costs related to this commitment were incurred. The total project cost is estimated to cost approximately<br />
$55.3 million. At December 31, <strong>2001</strong>, construction and overhead costs of approximately $52.8 million had been<br />
incurred with estimated costs to complete of approximately $2.5 million. The new facility construction is expected to<br />
be completed in 2002, with manufacturing activities initiated in the second quarter of 2002.<br />
During October 2000, the Company began construction of two new facilities in Germany with estimated completion<br />
during the third quarter of 2002. The estimated cost for these facilities is approximately EUR 54.0 million (approximately<br />
$48.1 million at December 31, <strong>2001</strong>) of which EUR 39.5 million (approximately $35.2 million) has been incurred.<br />
In October 1998, the Company announced that it had signed a five-year supply agreement with Abbott Laboratories<br />
(Abbott). According to the agreement, the Company will supply Abbott with various proprietary nucleic acid sample<br />
purification and preparation products. Under the terms of this agreement, Abbott has committed to certain purchases<br />
of the Company’s products over the term of the contract. The Company has committed to certain expansions of its<br />
production capacity and product quality and has received payments for such achievements.<br />
d. Contingencies<br />
The Company is a party to legal proceedings incidental to its business. Certain claims, suits or complaints arising out<br />
of the normal course of business have been filed or were pending against the Company. Although it is not possible to<br />
predict the outcome of such litigation, based on the facts known to the Company and after consultation with legal counsel,<br />
management believes that such litigation will not have a material effect on its financial position or results of operations.<br />
During the normal course of business, the Company is subject to audit by taxing authorities for varying periods in<br />
various tax jurisdictions. Such matters may involve substantial amounts, and if these were to be ultimately resolved<br />
unfavorably to the full amount of their maximum potential exposure, an event not currently anticipated, it is possible<br />
that such an event could have a material effect on the Company’s cash position and results of operations.<br />
16. EMPLOYEE BENEFITS<br />
In September 1992, <strong>QIAGEN</strong>, Inc. (Valencia) adopted the <strong>QIAGEN</strong>, Inc. Employees 401(k) Savings Plan (the Plan).<br />
The purpose of the Plan is to provide retirement benefits to all eligible employees, which include employees of<br />
<strong>QIAGEN</strong>, Inc., <strong>QIAGEN</strong> Sciences, Inc. and <strong>QIAGEN</strong> Genomics, Inc. Matching contributions and profit sharing<br />
contributions may be made to the Plan at the discretion of the Board of Directors. In <strong>2001</strong>, 2000 and 1999, total<br />
matching contributions to the Plan were approximately $701,000, $600,000 and $226,000, respectively.<br />
Operon adopted a defined contribution plan effective January 1, 1994, benefiting substantially all Operon employees.<br />
Operon may make matching contributions at the discretion of the Board of Directors. In <strong>2001</strong>, 2000 and 1999<br />
matching contributions to the plan totaled approximately $144,000, $108,000 and $74,000, respectively.<br />
As of December 31, <strong>2001</strong>, <strong>QIAGEN</strong> GmbH has deferred compensation plans for one officer and one employee.<br />
The present value of the future compensation obligation of $200,000, $171,000 and $173,000 has been accrued<br />
in the accompanying consolidated financial statements at December 31, <strong>2001</strong>, 2000 and 1999, respectively.<br />
During 1999, <strong>QIAGEN</strong> KK established a retirement plan for one officer. The employee is entitled to a lump<br />
sum distribution based on a formula tied to years of service. As such an amount of $215,000, $187,000 and<br />
$145,000 has been accrued in the accompanying consolidated financial statements at December 31, <strong>2001</strong>, 2000<br />
and 1999, respectively.
17. LICENSING AGREEMENTS<br />
The Company has licensing agreements with companies, universities and individuals, some of which require certain<br />
up-front payments. Royalty payments are required on net product sales ranging from one to ten percent of covered<br />
products. Several of these agreements have minimum royalty requirements. The accompanying consolidated financial<br />
statements include accrued royalties relating to these agreements in the amount of $5.5 million and $3.9 million at<br />
December 31, <strong>2001</strong> and 2000, respectively. Royalty expense relating to these agreements amounted to $10.0 million,<br />
$7.8 million, and $5.7 million for the years ended December 31, <strong>2001</strong>, 2000 and 1999, respectively. Royalty<br />
expense is primarily recorded in cost of sales, with a small portion recorded as research and development expense<br />
depending on the use of the technology under license. Some of these agreements also have minimum raw material<br />
purchase requirements and requirements to perform specific types of research.<br />
18. RELATED PARTY TRANSACTIONS<br />
From time to time the Company may have transactions with companies in which the Company also holds an interest.<br />
See notes 7 and 9 for discussion of these investments and transactions.<br />
In connection with its formation, <strong>QIAGEN</strong> K.K. entered into a service agreement with its minority shareholder. Pursuant<br />
to the agreement, the minority shareholder provided services such as stock keeping, order processing, and packing and<br />
shipping. As compensation for services provided, <strong>QIAGEN</strong> K.K. paid the minority shareholder a service fee equal to<br />
seven percent of the net revenues of <strong>QIAGEN</strong> K.K. For the years ended December 31, 2000 and 1999, <strong>QIAGEN</strong> K.K.<br />
expensed to sales and marketing expense approximately $1.1 million and $857,000, respectively, in service fees,<br />
of which $96,000 and $85,000 is included in accrued liabilities at the end of the respective year. The service<br />
agreement was terminated upon the Company’s acquisition of the minority shareholder’s interest in January <strong>2001</strong>.<br />
53<br />
19. SEGMENT AND RELATED INFORMATION<br />
The Company operates exclusively in the life sciences industry generating revenue from the sale of products and<br />
services for the separation and purification of nucleic acids. <strong>Report</strong>able segments are based on the geographic<br />
locations of the subsidiaries.<br />
The Company’s reportable segments include the Company’s production and manufacturing facilities in Germany,<br />
United States and Switzerland, and distribution subsidiaries in the United States, Switzerland, Japan, the United<br />
Kingdom and Other Countries (consisting of the Company’s subsidiaries in Canada, France, Australia, and Italy). The<br />
Company’s holding company is located in the Netherlands.<br />
The Company evaluates performance based on several factors, of which the primary financial measure is operating<br />
income. The accounting policies of the segments are the same as those described in the summary of significant<br />
accounting policies in Note 2 of the Notes to Consolidated Financial Statements.<br />
Summarized financial information concerning the Company’s reportable segments is shown in the following tables:<br />
Net Sales<br />
<strong>2001</strong><br />
2000<br />
1999<br />
Germany<br />
$ 121,744,000<br />
$ 99,408,000<br />
$ 79,603,000<br />
United States<br />
147,609,000<br />
119,925,000<br />
90,018,000<br />
Switzerland<br />
27,898,000<br />
23,490,000<br />
15,243,000<br />
Japan<br />
34,417,000<br />
35,038,000<br />
14,609,000<br />
United Kingdom<br />
16,282,000<br />
12,004,000<br />
10,051,000<br />
Other Countries<br />
17,844,000<br />
15,484,000<br />
10,297,000<br />
Subtotal<br />
365,794,000<br />
305,349,000<br />
219,821,000<br />
Intersegment Elimination<br />
(102,024,000)<br />
(88,547,000)<br />
(61,666,000)<br />
Total<br />
$ 263,770,000<br />
$ 216,802,000<br />
$ 158,155,000
Net sales are attributed to countries based on the location of the Company’s subsidiary. During <strong>2001</strong>, 2000 and<br />
1999, no single customer represented more than ten percent of consolidated net sales. United States export sales did<br />
not exceed ten percent of consolidated net sales during fiscal <strong>2001</strong>, 2000 or 1999.<br />
<strong>2001</strong><br />
2000<br />
1999<br />
Intersegment Sales<br />
Germany<br />
$ (80,277,000)<br />
$(70,359,000)<br />
$(54,932,000)<br />
United States<br />
(5,198,000)<br />
(2,744,000)<br />
(2,402,000)<br />
Switzerland<br />
(15,752,000)<br />
(11,496,000)<br />
(4,332,000)<br />
Japan<br />
(797,000)<br />
(3,893,000)<br />
–<br />
Other Countries<br />
–<br />
(55,000)<br />
–<br />
Total<br />
$(102,024,000)<br />
$(88,547,000)<br />
$(61,666,000)<br />
54<br />
All intersegment sales are accounted for by a formula based on local list prices and eliminated in consolidation.<br />
<strong>2001</strong><br />
2000<br />
1999<br />
Operating Income (Loss)<br />
Germany<br />
$ 30,914,000 $ 23,157,000 $ 10,524,000<br />
United States<br />
10,326,000<br />
6,807,000<br />
9,843,000<br />
Switzerland<br />
4,119,000<br />
4,742,000<br />
1,308,000<br />
Japan<br />
5,956,000<br />
3,798,000<br />
1,496,000<br />
United Kingdom<br />
3,566,000<br />
2,431,000<br />
2,102,000<br />
Other Countries<br />
1,174,000<br />
1,288,000<br />
758,000<br />
The Netherlands<br />
(2,611,000)<br />
(482,000)<br />
(1,596,000)<br />
Subtotal<br />
53,444,000<br />
41,741,000<br />
24,435,000<br />
Intersegment elimination<br />
32,000<br />
(5,208,000)<br />
(1,087,000)<br />
Total<br />
$ 53,476,000 $ 36,533,000 $ 23,348,000<br />
The Netherlands component of operating income (loss) is primarily general and administrative expenses. The<br />
intersegment elimination represents the elimination of intercompany profit.<br />
<strong>2001</strong><br />
2000<br />
1999<br />
Depreciation and Amortization<br />
Germany<br />
$ 6,926,000<br />
$ 5,482,000<br />
$ 4,909,000<br />
United States<br />
5,764,000<br />
3,965,000<br />
2,418,000<br />
Switzerland<br />
371,000<br />
269,000<br />
229,000<br />
Japan<br />
1,614,000<br />
1,065,000<br />
627,000<br />
United Kingdom<br />
107,000<br />
103,000<br />
146,000<br />
Other Countries<br />
158,000<br />
80,000<br />
82,000<br />
The Netherlands<br />
119,000<br />
102,000<br />
150,000<br />
Total<br />
$ 15,059,000<br />
$ 11,066,000<br />
$ 8,561,000
Assets<br />
Germany<br />
United States<br />
Switzerland<br />
Japan<br />
United Kingdom<br />
Other Countries<br />
The Netherlands<br />
Subtotal<br />
Intersegment Elimination<br />
Total<br />
<strong>2001</strong><br />
$ 186,489,000<br />
129,015,000<br />
19,480,000<br />
21,484,000<br />
6,475,000<br />
9,601,000<br />
122,318,000<br />
494,862,000<br />
(137,894,000)<br />
$ 356,968,000<br />
2000<br />
$ 82,389,000<br />
111,605,000<br />
15,758,000<br />
24,304,000<br />
4,515,000<br />
6,628,000<br />
114,055,000<br />
359,254,000<br />
(118,361,000)<br />
$ 240,893,000<br />
Assets of the Netherlands include cash and cash equivalents, investments, prepaid assets and certain intangibles. The<br />
intersegment elimination represents intercompany investments and advances.<br />
At December 31, <strong>2001</strong> and 2000, the investment in equity method investees totaled ($1,637,000) and ($247,000)<br />
for Switzerland. These investments are included in the asset amounts presented above.<br />
55<br />
<strong>2001</strong><br />
2000<br />
1999<br />
Capital Expenditures<br />
Germany<br />
$ 44,420,000<br />
$ 14,096,000<br />
$ 8,601,000<br />
United States<br />
53,477,000<br />
24,188,000<br />
4,247,000<br />
Switzerland<br />
3,401,000<br />
552,000<br />
640,000<br />
Japan<br />
305,000<br />
1,472,000<br />
108,000<br />
United Kingdom<br />
106,000<br />
78,000<br />
77,000<br />
Other Countries<br />
358,000<br />
263,000<br />
73,000<br />
The Netherlands<br />
–<br />
2,000<br />
–<br />
Total<br />
$ 102,067,000<br />
$ 40,651,000<br />
$ 13,746,000<br />
<strong>2001</strong><br />
2000<br />
Long-Lived Assets<br />
Germany<br />
$ 76,763,000<br />
$ 39,542,000<br />
United States<br />
84,275,000<br />
35,816,000<br />
Switzerland<br />
4,433,000<br />
979,000<br />
Japan<br />
3,358,000<br />
5,878,000<br />
United Kingdom<br />
146,000<br />
155,000<br />
Other Countries<br />
645,000<br />
406,000<br />
The Netherlands<br />
8,213,000<br />
10,452,000<br />
Total<br />
$ 177,833,000<br />
$ 93,228,000
FOR DUTCH STATUTORY PURPOSES WE HEREBY INCLUDE THE <strong>QIAGEN</strong><br />
N.V. ANNUAL ACCOUNTS FOR THE YEAR <strong>2001</strong> BASED ON DUTCH<br />
GENERALLY ACCEPTED ACCOUNTING STANDARDS.<br />
<strong>QIAGEN</strong> N.V.<br />
ANNUAL ACCOUNTS<br />
FOR THE YEAR <strong>2001</strong><br />
TOGETHER WITH AUDITORS’ REPORT<br />
BALANCE SHEETS AT DECEMBER 31, <strong>2001</strong><br />
(AFTER PROPOSED APPROPRIATION OF INCOME)<br />
(Currency – Thousands of US Dollars)<br />
ASSETS<br />
56<br />
FIXED ASSETS:<br />
Intangible fixed assets<br />
Tangible fixed assets<br />
Financial fixed assets<br />
CURRENT ASSETS:<br />
Accounts receivable<br />
<strong>2001</strong><br />
(USD)<br />
5,447<br />
76<br />
158,816<br />
164,339<br />
2000<br />
(USD)<br />
6,186<br />
8<br />
110,424<br />
116,618<br />
Trade<br />
Group companies<br />
Prepaid and deferred expenses<br />
Securities<br />
Cash<br />
375<br />
–<br />
361<br />
736<br />
22,481<br />
36,305<br />
59,522<br />
223,861<br />
–<br />
5,247<br />
459<br />
5,706<br />
37,273<br />
7,961<br />
50,940<br />
167,558<br />
SHAREHOLDERS’ EQUITY AND LIABILITIES<br />
SHAREHOLDERS’ EQUITY:<br />
Issued and paid-in capital<br />
Additional paid-in capital<br />
Retained earnings<br />
Cumulative translation adjustment<br />
SHORT-TERM LIABILITIES:<br />
Accounts payable<br />
<strong>2001</strong><br />
(USD)<br />
1,458<br />
123,117<br />
100,002<br />
(9,992)<br />
214,585<br />
2000<br />
(USD)<br />
1,450<br />
103,448<br />
67,448<br />
(6,426)<br />
165,920<br />
Trade<br />
Group companies<br />
Accounts payable and accrued liabilities<br />
334<br />
8,428<br />
514<br />
9,276<br />
223,861<br />
–<br />
349<br />
1,289<br />
1,638<br />
167,558
STATEMENTS OF INCOME<br />
FOR THE YEAR ENDED DECEMBER 31, <strong>2001</strong><br />
(Currency – Thousands of US Dollars)<br />
INCOME/(LOSS) AFTER TAXES<br />
INCOME FROM SUBSIDIARIES<br />
Net income<br />
<strong>2001</strong><br />
(USD)<br />
(130)<br />
32,684<br />
32,554<br />
2000<br />
(USD)<br />
307<br />
20,186<br />
20,493<br />
NOTES TO FINANCIAL STATEMENTS<br />
AT DECEMBER 31, <strong>2001</strong><br />
(Currency – Thousands of US Dollars)<br />
57<br />
1. GENERAL<br />
The company was incorporated on April 29, 1996 and has its legal seat in Venlo. The description of the company’s<br />
activities and the group structure, as included in the notes to the consolidated financial statements, also apply to the<br />
company-only financial statements. The consolidated financial statements are included in this annual report. The<br />
consolidated financial statements are prepared in accordance with US generally accepted accounting principles,<br />
which for the group in certain respects differs significantly from Dutch Generally Accepted Accounting Principles. The<br />
reconciliation of shareholders’ equity and net income under United States Generally Accepted Accounting Principles<br />
and Dutch Generally Accepted Accounting Principles is described in note 10.<br />
In 2000 and <strong>2001</strong>, the company entered into business combinations with Operon Technologies Inc. and the Sawady<br />
Group respectively (see the notes to the consolidated financial statements for more information). Management decided<br />
to account these business combinations as a pooling of interests in both the US GAAP financial statements and Dutch<br />
GAAP financial statements. As a consequence, prior period equity and investments have been restated to include<br />
these investments.<br />
This report serves as statutory reporting for the company in order to comply with Dutch financial reporting<br />
requirements.<br />
2. ACCOUNTING PRINCIPLES<br />
a) General<br />
The accounting principles as described in the notes to the consolidated financial statements also apply to the companyonly<br />
financial statements, unless indicated otherwise.<br />
In accordance with article 402 Book 2 of the Netherlands Code the statement of income is presented in abbreviated<br />
form.<br />
b) Financial fixed assets<br />
The investments in subsidiary companies are stated at the net asset value of the subsidiaries if influence of significance<br />
can be exercised over the subsidiaries’ operational and financial activities. The net asset value is determined on the<br />
basis of the accounting principles as applied by the company.<br />
The other investments are stated at acquisition cost or, in case of a permanent impairment of the value of the<br />
investments, at lower net realizable value.<br />
Loans receivable are stated at face value.
c) Intangible fixed assets<br />
Goodwill originating from the acquisition of investments represents the difference of the net asset value and the<br />
acquisition cost of the investments at the time of the acquisition. The goodwill is amortized on a straight-line basis over<br />
a period of 10 years.<br />
3. FINANCIAL FIXED ASSETS<br />
The movement in financial fixed assets is as follows:<br />
58<br />
a) Investment in subsidiary companies<br />
Balance January 1<br />
Acquisitions<br />
Translation loss<br />
Net result<br />
Tax benefit stock options<br />
Balance December 31<br />
<strong>2001</strong><br />
(USD)<br />
106,336<br />
3,021<br />
(3,575)<br />
32,684<br />
14,842<br />
153,308<br />
b) Other investments<br />
Balance January 1, <strong>2001</strong><br />
Acquisitions<br />
Sale of interest<br />
Balance December 31<br />
3,986<br />
1,515<br />
(85)<br />
5,416<br />
c) Loans receivable<br />
Total financial fixed assets December 31<br />
92<br />
158,816<br />
4. INTANGIBLE FIXED ASSETS<br />
The movement in intangible fixed assets is as follows:<br />
Goodwill<br />
Licenses and Patents<br />
Total<br />
(USD)<br />
(USD)<br />
(USD)<br />
Balance January 1, <strong>2001</strong><br />
5,949<br />
237<br />
6,186<br />
Amortization<br />
661<br />
78<br />
739<br />
Balance December 31<br />
5,288<br />
159<br />
5,447<br />
Original cost<br />
6,610<br />
548<br />
7,158<br />
Accumulated amortization<br />
1,322<br />
389<br />
1,711<br />
Balance December 31<br />
5,288<br />
159<br />
5,447<br />
5. TANGIBLE FIXED ASSETS<br />
Tangible fixed assets consist of furniture and office equipment. The depreciation charge for the year amounts to USD 6.<br />
6. CASH AND SECURITIES<br />
Securities consist of interest bearing securities. No restrictions on usage of cash and securities exist.
7. SHAREHOLDERS’ EQUITY<br />
The authorized share capital consists of 260 million ordinary shares, 40 million financing preference shares and<br />
300 million preference shares. All shares have a par value of Euro 0.01 (one Euro cent). As of December 31, <strong>2001</strong>,<br />
143,463,800 ordinary shares have been issued and fully paid-up.<br />
The movement in shareholders’ equity is as follows:<br />
Issued and<br />
paid-in capital<br />
Additional<br />
paid-in capital<br />
Retained<br />
earnings<br />
Cumulative translation<br />
adjustment<br />
Total<br />
(USD)<br />
(USD)<br />
(USD)<br />
(USD)<br />
(USD)<br />
Balance January 1, <strong>2001</strong><br />
1,450<br />
103,448<br />
67,448<br />
(6,426)<br />
165,920<br />
Net income<br />
–<br />
–<br />
32,554<br />
–<br />
32,554<br />
Translation adjustment<br />
–<br />
–<br />
–<br />
(3,566)<br />
(3,566)<br />
Exercise of stock options<br />
Stock subscription<br />
Tax benefit in connection with<br />
nonqualified stock options<br />
8<br />
–<br />
–<br />
4,081<br />
746<br />
14,842<br />
–<br />
–<br />
–<br />
–<br />
–<br />
–<br />
4,089<br />
746<br />
14,842<br />
59<br />
Balance December 31, <strong>2001</strong><br />
1,458<br />
123,117<br />
100,002<br />
(9,992)<br />
214,585<br />
8. STATUTORY AND SUPERVISORY DIRECTORS<br />
The company has two statutory directors and six supervisory directors, who received a total remuneration of USD 631<br />
in their capacity.<br />
9. PERSONNEL<br />
The average number of personnel during the year was 4 (2000 - 4).<br />
Salaries paid during <strong>2001</strong> amounted to USD 181. Social securities and pensions paid during <strong>2001</strong> amount to USD 5.<br />
10. RECONCILIATION OF DUTCH GAAP - US GAAP<br />
The reconciliation of shareholders’ equity and net income according to Dutch generally accepted accounting<br />
principles (Dutch GAAP) and United States Generally Accepted Accounting Principles (US GAAP) (as presented in the<br />
attached consolidated financial statements) is shown below:<br />
Shareholders’ equity as<br />
of December 31, <strong>2001</strong><br />
(USD)<br />
Net Income<br />
<strong>2001</strong><br />
(USD)<br />
Reflected in accordance with Dutch GAAP<br />
Reconciling items:<br />
Goodwill<br />
Marketable securities<br />
Reflected in accordance with<br />
United States Generally Accepted<br />
Accounting Principles<br />
214,585<br />
(4,080)<br />
2,470<br />
212,975<br />
32,554<br />
510<br />
1,355<br />
34,419
OTHER INFORMATION<br />
1. AUDITORS’ REPORT<br />
Introduction<br />
We have audited the financial statements of <strong>QIAGEN</strong> N.V., Venlo, The Netherlands, for the year <strong>2001</strong>. These<br />
financial statements are the responsibility of the company’s management. Our responsibility is to express an opinion<br />
on these financial statements based on our audit.<br />
Scope<br />
60<br />
We conducted our audit in accordance with auditing standards generally accepted in The Netherlands. Those<br />
standards require that we plan and perform the audit to obtain reasonable assurance about whether the financial<br />
statements are free of material misstatement. An audit includes examining, on a test basis, evidence supporting the<br />
amounts and disclosures in the financial statements. An audit also includes assessing the accounting principles used<br />
and significant estimates made by management, as well as evaluating the overall financial statement presentation.<br />
We believe that our audit provides a reasonable basis for our opinion.<br />
Opinion<br />
In our opinion, the financial statements give a true and fair view of the financial position of the company as at<br />
December 31, <strong>2001</strong> and of the result for the year then ended in accordance with accounting principles generally<br />
accepted in The Netherlands and comply with the financial reporting requirements included in Part 9, Book 2 of The<br />
Netherlands Civil Code.<br />
Eindhoven, The Netherlands,<br />
February 6, 2002
OTHER INFORMATION<br />
2. STATUTORY PROFIT APPROPRIATION<br />
Statutory profit appropriation is mentioned in Article 40 of the Articles of Association and can be summarized as<br />
follows:<br />
1. Out of the profits remaining after distribution on the preference shares, if any, such amounts shall be allocated to<br />
reserve as the Supervisory Board shall decide.<br />
2. Insofar as the profit is not distributed or allocated to reserve (to the preference shares and the financing preference<br />
shares, if any) upon application of the previous paragraphs of this article, it shall be at the free disposal of the<br />
general meeting, with the proviso that no further dividend will be distributed on the preference shares and the<br />
financing preference shares.<br />
3. The Company can only declare distributions insofar as its ”eigen vermogen” (shareholders’ equity) exceeds the<br />
amount of the paid-up and called portion of the share capital, plus the ”wettelijke” (statutory) reserves.<br />
4. The Board of Management may, with the approval of the Supervisory Board, decide to pay an interim dividend<br />
provided always that paragraph 3 of this Article is complied with and the profit so permits. Interim dividends may<br />
be distributed on one class of shares only.<br />
61<br />
5. Dividends (including interim dividends for the purpose of this and the next paragraph) shall be made payable at<br />
the Company’s offices address or addresses in The Netherlands, to be determined by the Supervisory Board, as<br />
well as at least one address in each country where the shares of the Company are listed on a stock exchange, as<br />
from a date determined by the Supervisory Board.<br />
6. Dividends that have not been claimed within five years and two days of becoming payable shall be forfeited and<br />
shall accrue to the benefit of the company.
EXECUTIVE OFFICERS AND SUPERVISORY DIRECTORS<br />
62<br />
Supervisory Directors and Managing Directors are appointed annually for the period beginning on the date following<br />
the <strong>Annual</strong> General Meeting up to and including the date of the <strong>Annual</strong> General Meeting held in the following fiscal<br />
year. The Supervisory Directors, Managing Directors and executive officers of the Company, and their ages as of<br />
February 15, 2002, are as follows:<br />
Name Age Position<br />
Dr. Metin Colpan 47 Managing Director, Chief Executive Officer<br />
Peer M. Schatz 36 Managing Director, Chief Financial Officer<br />
Prof. Dr. Detlev H. Riesner(1) 60 Chairman of the Supervisory Board, Supervisory Director<br />
Jochen Walter(2) 54 Supervisory Director<br />
Dr. Franz A. Wirtz(1) 69 Supervisory Director<br />
Erik Hornnaess 64 Supervisory Director<br />
Dr. Heinrich Hornef (2) 70 Deputy Chairman of the Supervisory Board, Supervisory Director<br />
Prof. Dr. Manfred Karobath 61 Supervisory Director<br />
Prof. Dr. jur Carsten P. Claussen was appointed as non-voting Special Advisor and Honorary Chairman in 1999.<br />
(1) Member of the Compensation Committee.<br />
(2) Member of the Audit Committee.<br />
The Company has not entered into contracts with any member of the Supervisory Board that provide for benefits upon<br />
a termination of the employment of service of the member.<br />
The following is a brief summary of the background of each of the Supervisory Directors, the Managing Directors and<br />
the Honorary Chairman. Supervisory Directors and Managing Directors are appointed annually for the period<br />
beginning on the day following the <strong>Annual</strong> General Meeting up to and including the date of the <strong>Annual</strong> General<br />
Meeting held in the following fiscal year. References to ”<strong>QIAGEN</strong>” and the ”Company” in relation to periods prior<br />
to April 29, 1996 mean <strong>QIAGEN</strong> GmbH and its consolidated subsidiaries:<br />
Dr. Metin Colpan is a co-founder of the Company and has been Chief Executive Officer and a Managing Director since<br />
1985. Dr. Colpan obtained his Ph.D. and M.Sc. in Organic Chemistry and Chemical Engineering from the Darmstadt<br />
Institute of Technology in 1983. Prior to founding <strong>QIAGEN</strong>, Dr. Colpan was an Assistant Investigator at the Institute<br />
for Biophysics at the University of Düsseldorf. Dr. Colpan has had wide experience in separation techniques and in<br />
the separation and purification of nucleic acids in particular, and has filed many patents in the field. Dr. Colpan<br />
currently serves as a supervisory board member of GPC Biotech AG and Ingenium Pharmaceuticals AG, each in<br />
Munich, Germany, and Omnitron in Düsseldorf, Germany. The Company has obtained a key man life insurance<br />
policy on the life of Dr. Colpan in the amount of EUR 767,000.<br />
Peer M. Schatz joined the Company as Chief Financial Officer in 1993 and became a Managing Director in 1998.<br />
Mr. Schatz was previously a partner in a private management buyout group in Switzerland and worked in finance<br />
and systems positions in Sandoz, Ltd. and Computerland AG as well as in finance, operations, management and<br />
sales positions in various start-up companies in the computer and software trading industry in Europe and the United<br />
States. Mr. Schatz graduated from the University of St. Gall, Switzerland, with a Master’s degree in Finance in 1989<br />
and obtained an M.B.A. in Finance from the University of Chicago Graduate School of Business in 1991. Mr. Schatz<br />
also serves in the capacities of director and vice chairman to Evotec OAI AG and Mulligan BioCapital AG and is a<br />
member of the Advisory Board (Börsenrat) of the Frankfurt Stock Exchange.<br />
Professor Dr. Detlev H. Riesner is a co-founder of <strong>QIAGEN</strong>. He has been on the Company’s Supervisory Board since<br />
1984 and was appointed Chairman of the Supervisory Board in 1999. Professor Riesner has held the Chair of<br />
Biophysics at the Heinrich-Heine-University in Düsseldorf since 1980. In 1996, he was also appointed to the position<br />
of Vice President of Research, and in 1999, he was nominated Director of Technology at the University of Düsseldorf.<br />
Prior to that he was Professor of Biophysical Chemistry at the Darmstadt Institute of Technology and from 1975 to
1977, Lecturer of Biophysical Chemistry at Hannover Medical School. He has held guest professorships at the Institute<br />
of Microbiology, Academia Sinica, Beijing, and the Department of Neurology at the University of California, San<br />
Francisco. He received his M.S. in Physics from Hannover Institute of Technology and his Ph.D. from the University of<br />
Braunschweig, with post-graduate work at Princeton University. Professor Riesner is also a member of the supervisory<br />
board or a director of New Lab Bioquality AG, Erkrath; Therascope AG, Heidelberg; Kourion AG, Düsseldorf;<br />
Neuraxo GmbH, Düsseldorf; and Solutas GmbH Hürth.<br />
Jochen Walter joined the Supervisory Board of <strong>QIAGEN</strong> in 1988. Since 1985, Mr. Walter has been the Managing<br />
Director of RBS GmbH (previously called Innovatives Düsseldorf), a venture capital company, which was the<br />
management company for S-Kapitalbeteiligungsgesellschaft Düsseldorf, mbH. Since 1968, he has been involved in<br />
a wide range of management positions in commercial banking. Mr. Walter holds a diploma in banking management<br />
from the Banking Institute in Bonn. Mr. Walter currently serves in the capacities of supervisory board member of Rhein<br />
Biotech N.V., NETEC AG and RBB Management AG. He has also served in the capacities of supervisory board<br />
member of TRAPO AG, Martel GmbH, Isotopen-Technik Dr. Sauerwein GmbH, and Sauerweinsystem-Technik GmbH;<br />
advisory board member of RBB Regionale Beteiligungs-u. Beratungsgesellschaft der Sparkassen, der<br />
Oberlausitz/Niederschlesien u. der Saechsischen Schweiz mbH; management board member of BVK Bundesverband<br />
Deutscher Kapitalbeiligungsgesellschaften-German Venture Capital Association e.V.; and management director and<br />
general manager of S-Kapitalbeteiligungsgesellschaft Düsseldorf, mbH.<br />
63<br />
Dr. Franz A. Wirtz has been a member of <strong>QIAGEN</strong>’s Supervisory Board since 1989. Dr. Wirtz was Managing Director<br />
of Grünenthal GmbH, Aachen/Germany, a large, private pharmaceutical company from 1962-1997 and a member<br />
of its Advisory Board from 1998-<strong>2001</strong>. He is chairman of the Supervisory Board of Paion GmbH, Stolberg and Vice<br />
Chairman of Dasgip AG, Jülich, two young German biotech companies. For 10 years Dr. Wirtz was treasurer of<br />
the German pharmaceutical industry association. Dr. Wirtz holds the doctorate degree in chemistry from the<br />
Rheinisch-Westfälische Technische Hochschule in Aachen whose honorary citizen he became in <strong>2001</strong>.<br />
Erik Hornnaess has been a member of the Supervisory Board since 1998. Mr. Hornnaess worked for Astra<br />
Pharmaceuticals, Sweden from 1965 until 1979 in various management positions in Sweden, Australia, and Canada<br />
and, for the last three years of this period, as the General Manager for the Benelux region (Belgium, The Netherlands<br />
and Luxembourg). In 1979, he joined Abbott Laboratories European Headquarters in Paris, France and from 1982<br />
he was the Area Vice-President of Abbott Diagnostic Division in Europe, Middle-East and Africa, with headquarters<br />
in Wiesbaden, Germany. Mr. Hornnaess retired from Abbott Laboratories on March 1, 1997 and currently serves as<br />
non-executive Director of Alpharma (ALO), New Jersey, AXIS-SHIELDS Group, Scotland, CARDION GmbH, Germany,<br />
RADIOMETER A/S, Denmark, EPICEPT INC., New Jersey, and MEDITRON A/S, Norway. He also serves on the<br />
advisory board of TVM (Techno Venture Management), Munich. Additionally, Mr. Hornnaess served as the<br />
Vice-President of European Diagnostic Manufacturers Association (EDMA), Brussels in the period 1995 through 1997.<br />
Mr. Hornnaess graduated from Aarhus Handelshojskole, Denmark with an M.B.A. and obtained a PMD from the<br />
Harvard Business School.<br />
Dr. Heinrich Hornef has been on the Company’s Supervisory Board since 2000 and was appointed Deputy Chairman<br />
of the Supervisory Board and Audit Committee Chairman in <strong>2001</strong>. He is chairman of the supervisory board of the<br />
pharmaceutical company Merck KGaA as well as a member of the partners’ counsel of E. Merck, both in Darmstadt,<br />
Germany. He also serves as chairman on the board of Heidelberg Innovation GmbH, a biotechnology and life-science<br />
venture capital company in Heidelberg, Germany as chairman of the advisory board of m • phasys GmbH, Tuebingen,<br />
and as a member of the Beirat of Deutsche Bank AG. Prior to his retirement in December 1996, Dr. Hornef served<br />
as CFO of Boehringer Mannheim GmbH (1973-1991), as CFO of the Berlin-based Treuhandanstalt, the privatization<br />
agency in East-Germany (1992-1994), and as president of its successor-organisation BvS (1995-1996).<br />
Professor Dr. Manfred Karobath studied medicine and worked from 1967 to 1980, first, in the Dept. of Biochemistry<br />
of the University of Vienna and, after a stage as postdoctoral fellow, he joined the Dept. of Psychiatry where he<br />
became professor of biological Psychiatry. In 1980, he joined Sandoz Pharma in Basel, first, in drug discovery, and
later, he became Senior Vice President and head of R&D, Switzerland. In 1992, Prof. Dr. Karobath joined Rhone<br />
Poulenc Rorer (”RPR”) as President of R&D and Executive Vice President and later he became a member of the Boards<br />
of Directors of RPR, Pasteur Mérieux Connought, Centeon and Rhone Poulenc Pharma. He has received several<br />
scientific awards and has published 92 scientific papers. Dr. Karobath also serves as an executive board member of<br />
Coley Pharmaceutical Group, as chairman and executive board member of IDEA AG and as deputy chairman and<br />
executive board member of CARDION AG.<br />
64<br />
Professor Dr. jur. Carsten P. Claussen was Chairman of the Supervisory Board of the Company from 1988 to June 1999<br />
and was appointed as a Special Advisor and Honorary Chairman in 1999. Professor Claussen is no longer a voting<br />
member of the Supervisory Board. For many years he has pursued a career in private banking. Between 1976 and<br />
1987, Professor Claussen was a member of the Executive Board of Norddeutsche Landsbank, Hannover, and<br />
Chairman of the Hannover Stock Exchange. Since 1987, he has been a lawyer in Duesseldorf and senior advisor to<br />
IKB Deutsche Industriekreditbank, Düsseldorf. At present, he is a partner in the law firm of Hoffmann Liebs and Partner<br />
and specializes in corporate law and capital market transactions. He is Chairman of the Board of TON ART AG,<br />
Duesseldorf; Flossbach & v. Storch Vermögensmangagement AG, Cologne; Co.don AG, Teltow and WAS Worldwide<br />
Analytical Systems AG, Cleve and is a member of other boards. Professor Claussen received his Ph.D. in law from<br />
the University of Cologne.<br />
AUDIT AND COMPENSATION COMMITTEES<br />
The Audit Committee consists of two members, Dr. Hornef (Chairman) and Mr. Walter, and meets at least quarterly.<br />
The Audit Committee members are appointed by the Supervisory Board and serve for a term of one year. The Audit<br />
Committee recommends the selection of independent public accountants to audit the consolidated financial statements<br />
and local books and records of the Company and its subsidiaries, along with approving the fees for such services;<br />
reviews the performance of the independent public accountants with management, discusses on a quarterly basis the<br />
scope and results of the reviews and audits with the independent public accountants; discusses the Company’s<br />
financial accounting and reporting principles and policies and the adequacy of the Company’s internal accounting,<br />
financial and operating controls with the independent public accountants and management; considers and approves<br />
any recommendations regarding changes to the Company’s accounting policies and processes; reviews with<br />
management and the independent public accountants the Company’s quarterly earnings reports prior to its release to<br />
the press; and reviews the quarterly and annual reports (reported on Forms 6-K and 20-F) to be filed with the Securities<br />
Exchange Commission and the Deutsche Börse.<br />
The Compensation Committee consists of two members: Professor Riesner (Chairman) and Dr. Wirtz. Members are<br />
appointed by the Supervisory Board and serve for a term of one year. The Compensation Committee reviews and<br />
approves all stock option grants, reviews and approves the annual salaries, bonuses and other benefits of executive<br />
officers, and reviews general policies relating to employee compensation and benefits.<br />
MARKET INFORMATION<br />
The Company approved a four-for-one stock split during fiscal 2000 and a two-for-one stock split and par value<br />
currency conversion in fiscal 1999.<br />
To effect the four-for-one stock split, on June 16, 2000, the shareholders of the Company approved the amendment<br />
of the Company’s Articles of Association to increase the number of authorized shares of common stock from 65 million<br />
to 260 million. The Company’s Board of Supervisory Directors and Managing Board approved the split in May 2000.<br />
Common shareholders of record on July 3, 2000 received three additional shares for each share held on that date.<br />
The additional shares were distributed and the stock split was effective on July 13, 2000.<br />
On June 18, 1999, the shareholders of the Company approved the amendment of the Company’s Articles of<br />
Association to increase the number of authorized shares of common stock from 32.5 million to 65 million, which was<br />
required to effect the two-for-one stock split that the Company’s Board of Supervisory Directors and Managing Board<br />
approved in May 1999. Common shareholders of record on July 2, 1999 received one additional share for each<br />
share held on that date. The additional shares were distributed and the stock split was effective on July 16, 1999.
Since June 27, 1996, the Common Shares have been quoted on the NASDAQ National Market under the symbol<br />
QGENF. The following table sets forth the annual high and low closing sale prices for the last five years, the quarterly<br />
high and low closing sale prices for the last two fiscal years, and the monthly high and low closing sale prices for the<br />
last six months of the Common Shares on the NASDAQ National Market. All share prices prior to July 13, 2000 have<br />
been restated to reflect the stock splits.<br />
<strong>Annual</strong> High ($) Low ($)<br />
1997 7.375 3.031<br />
1998 9.500 5.234<br />
1999 20.875 8.188<br />
2000 57.375 18.813<br />
<strong>2001</strong> 35.375 12.380<br />
Quarterly 2000: High ($) Low ($)<br />
First Quarter 55.500 18.813<br />
Second Quarter 48.938 29.250<br />
Third Quarter 57.375 44.000<br />
Fourth Quarter 45.938 29.500<br />
65<br />
Quarterly <strong>2001</strong>: High ($) Low ($)<br />
First Quarter 35.375 18.375<br />
Second Quarter 28.000 18.480<br />
Third Quarter 23.330 12.380<br />
Fourth Quarter 20.690 14.900<br />
2002:<br />
First Quarter (through March 15, 2002) 20.81 14.000<br />
Monthly: High ($) Low ($)<br />
September <strong>2001</strong> 20.530 12.380<br />
October <strong>2001</strong> 18.500 14.900<br />
November <strong>2001</strong> 20.690 17.150<br />
December <strong>2001</strong> 20.140 18.330<br />
January 2002 20.810 18.700<br />
February 2002 19.780 15.300
Since September 25, 1997, the Common Shares have been traded officially on the Frankfurt Stock Exchange, Neuer<br />
Markt under the symbol QIA. The following table sets forth the annual high and low closing sale prices since<br />
September 25, 1997, the quarterly high and low closing sale prices for the last two fiscal years, and the monthly<br />
high and low closing sale prices for the last six months of the Common Shares on the Neuer Markt. Prior to<br />
January 1, 1999 trades on the Neuer Markt were denominated in German marks. In connection with the adoption<br />
of the euro by Germany on January 1, 1999, trades on the Neuer Markt, as of January 1, 1999, are denominated<br />
in euros. The conversion rate between the German mark and the euro was fixed on January 1, 1999 at 1.95583<br />
German marks per euro. Share prices prior to July 13, 2000 have been restated to reflect the stock splits.<br />
66<br />
<strong>Annual</strong> High (DM) Low (DM)<br />
1997 (since September 25, 1997) 10.813 8.813<br />
1998 17.200 9.138<br />
<strong>Annual</strong> High (EUR) Low (EUR)<br />
1999 20.750 7.125<br />
2000 60.400 17.650<br />
<strong>2001</strong> 38.250 13.600<br />
Quarterly 2000: High (EUR) Low (EUR)<br />
First Quarter 57.500 17.650<br />
Second Quarter 61.250 33.750<br />
Third Quarter 60.400 48.125<br />
Fourth Quarter 53.800 33.950<br />
Quarterly <strong>2001</strong>: High (EUR) Low (EUR)<br />
First Quarter 38.250 19.250<br />
Second Quarter 31.200 21.050<br />
Third Quarter 27.900 13.600<br />
Fourth Quarter 23.800 16.200<br />
2002:<br />
First Quarter (through March 15, 2002) 23.450 16.700<br />
Monthly: High (EUR) Low (EUR)<br />
September <strong>2001</strong> 22.900 13.600<br />
October <strong>2001</strong> 20.500 16.200<br />
November <strong>2001</strong> 23.800 19.350<br />
December <strong>2001</strong> 22.700 20.200<br />
January 2002 23.450 21.000<br />
February 2002 22.550 17.950
Corporate Headquarters<br />
<strong>QIAGEN</strong> N.V.<br />
Spoorstraat 50<br />
5911 KJ Venlo<br />
The Netherlands<br />
Phone (+31) 77-320-8400<br />
Fax (+31) 77-320-8409<br />
Independent Public Accountants<br />
Arthur Andersen LLP<br />
633 West Fifth Street<br />
Los Angeles, CA 90071<br />
USA<br />
General Legal Counsel<br />
USA<br />
SHAREHOLDER INFORMATION<br />
MINTZ LEVIN COHN FERRIS GLOVSKY AND POPEO PC<br />
One Financial Center<br />
Boston, MA 02111<br />
The Netherlands<br />
De Brauw Blackstone Westbroek<br />
Tripolis 300<br />
Burgerweeshuispad 301<br />
Postbus 75084<br />
1070 AB Amsterdam<br />
Germany<br />
Freshfields Bruckhaus Deringer<br />
Freiligrathstraße 1<br />
40479 Düsseldorf<br />
Registrar and Transfer Agent<br />
American Stock Transfer & Trust Company<br />
59 Maiden Lane<br />
New York, NY 10038<br />
USA<br />
Phone (+1) 212-936-5100<br />
Stockholder Inquiries<br />
Communications concerning transfer requirements, lost<br />
certificates, and change of address should be directed to<br />
the transfer agent. All other inquiries should be directed to:<br />
Investor Relations<br />
<strong>QIAGEN</strong> N.V.<br />
Spoorstraat 50<br />
5911 KJ Venlo<br />
The Netherlands<br />
Phone (+31) 77-320-8400<br />
Fax (+31) 77-320-8409<br />
<strong>Annual</strong> Meeting<br />
The Company expects to hold its <strong>Annual</strong> General Meeting<br />
of Stockholders on Friday, June 14, 2002 at<br />
10:30 a.m. in Venlo, The Netherlands.<br />
Information via Internet<br />
Internet World Wide Web users can access <strong>QIAGEN</strong> N.V.’s<br />
<strong>Annual</strong> <strong>Report</strong> and other financial information at the<br />
<strong>QIAGEN</strong> homepage at: www.qiagen.com<br />
67<br />
SECURITIES AND EXCHANGE COMMISSION FORM 20-F<br />
A copy of the Company’s <strong>Annual</strong> <strong>Report</strong> or Form 20-F filed with the United States Securities and Exchange Commission<br />
is available without charge upon written request to:<br />
Corporate Controller<br />
<strong>QIAGEN</strong> N.V.<br />
Spoorstraat 50<br />
5911 KJ Venlo<br />
The Netherlands<br />
Phone (+31) 77-320-8400<br />
Fax (+31) 77-320-8409<br />
Trademarks<br />
Patented or patent-pending and/or registered or registration-pending trademarks of <strong>QIAGEN</strong>: <strong>QIAGEN</strong> ® , QIAexpress ® , BioRobot ® , ProofStart, QuantiTect.<br />
PAXgene and PreAnalytiX are trademarks of PreAnalytiX. SYBR is a registered trademark of Molecular Probes.<br />
<strong>QIAGEN</strong> sample preparation products may be used in clinical diagnostic laboratory systems after the laboratory has validated their complete system as required by CLIA ’88<br />
regulations in the U.S. or equivalents in other countries.<br />
The PCR process is covered by U.S. Patents 4,683,195 and 4,683,202 and foreign equivalents owned by Hoffmann-La Roche AG.<br />
© 2002 <strong>QIAGEN</strong>, all rights reserved.
68<br />
NOTES
<strong>QIAGEN</strong> Investor Relations<br />
Dr. Solveigh Karola Mähler<br />
Manager Investor Relations<br />
<strong>QIAGEN</strong> GmbH<br />
Max-Volmer-Strasse 4<br />
40724 Hilden<br />
Germany<br />
Phone (+49) 2103-29-11710<br />
Fax (+49) 2103-29-21710<br />
ir@qiagen.com<br />
The Company files very extensive periodic information with the U.S. Securities and Exchange Commission (SEC) and the Frankfurt<br />
Neuer Markt, including the Company’s <strong>Annual</strong> <strong>Report</strong> on Form 20-F filed with the SEC. The 20-F contains detailed information<br />
on the company’s business, management, operations as well as information concerning <strong>QIAGEN</strong>’s corporate governance. For a<br />
copy of <strong>QIAGEN</strong>’s 20-F, as well as a wide variety of other investor information, please visit the Investor Relations section of<br />
www.qiagen.com or contact our Investor Relations department at the address above.<br />
<strong>QIAGEN</strong> Contact Info<br />
THE NETHERLANDS<br />
<strong>QIAGEN</strong> N.V.<br />
Spoorstraat 50 • 5911 KJ Venlo<br />
Phone (+31) 77-320-8400 • Fax (+31) 77-320-8409<br />
AUSTRALIA<br />
<strong>QIAGEN</strong> Pty Ltd<br />
PO Box 25 • Clifton Hill • Victoria 3068<br />
Phone (+61) 3-9489-3666 • Fax (+61) 3-9489-3888<br />
CANADA<br />
<strong>QIAGEN</strong> Inc.<br />
2800 Argentia Road • Unit 7 • Mississauga • Ontario • L5N 8L2<br />
Phone (+1) 905-821-1702 • Fax (+1) 905-821-1722<br />
FRANCE<br />
<strong>QIAGEN</strong> S.A.<br />
3 avenue du Canada • LP 809 • 91974 Courtaboeuf Cedex<br />
Phone (+33) 1-60-920-920 • Fax (+33) 1-60-920-925<br />
GERMANY<br />
<strong>QIAGEN</strong> GmbH<br />
Max-Volmer-Straße 4 • 40724 Hilden<br />
Phone (+49) 2103-29-0 • Fax (+49) 2103-29-21777<br />
<strong>QIAGEN</strong> Operon GmbH<br />
Nattermannallee 1 • 50829 Köln<br />
Phone (+49) 221-170-90-0 • Fax (+49) 221-170-90-100<br />
ITALY<br />
<strong>QIAGEN</strong> S.p.A.<br />
Via Grosio, 10/10 • 20151 Milano<br />
Phone (+39) 2-33-43-04-11 • Fax (+39) 2-33-43-04-26<br />
JAPAN<br />
<strong>QIAGEN</strong> K.K.<br />
Forefront Tower II • 13-1, Kachidoki 3 Chome<br />
Chuo-ku, Tokyo 104-0054<br />
Phone (+81) 3-5547-0817 • Fax (+81) 3-5547-0819<br />
Sawady Technology Co., Ltd<br />
1-29-10, Maenocho, Itabashi-ku • Tokyo 174-0063<br />
Phone (+81) 3-5914-3750 • Fax (+81) 3-5914-3751<br />
SWITZERLAND<br />
<strong>QIAGEN</strong> AG<br />
Auf dem Wolf 39 • 4052 Basel<br />
Phone (+41) 61-319-30-30 • Fax (+41) 61-319-30-33<br />
<strong>QIAGEN</strong> Instruments AG<br />
Feldbachstrasse • CH-8634 Hombrechtikon<br />
Phone (+41) 55-254-21-11 • Fax (+41) 55-254-21-00<br />
UNITED KINGDOM and IRELAND<br />
<strong>QIAGEN</strong> Ltd.<br />
Boundary Court • Gatwick Road • Crawley<br />
West Sussex, RH10 9AX<br />
Phone (+44) 1293-422-900 • Fax (+44) 1293-422-922<br />
USA<br />
<strong>QIAGEN</strong> Inc.<br />
28159 Avenue Stanford • Valencia • CA 91355<br />
Phone (+1) 661-294-7940 • Fax (+1) 661-702-3659<br />
<strong>QIAGEN</strong> Genomics, Inc.<br />
1725 220th Street S.E., Suite 104 • Bothell, WA 98021<br />
Phone (+1) 425-398-3100 • Fax (+1) 425-398-3150<br />
<strong>QIAGEN</strong> Sciences, Inc.<br />
19300 Germantown Rd. • Germantown, MD 20874<br />
Phone (+1) 240-686-7700 • Fax (+1) 240-686-1618<br />
<strong>QIAGEN</strong> Operon, Inc.<br />
1000 Atlantic Avenue, Suite 108 • Alameda, CA 94501<br />
Phone (+1) 510-865-8644 • Fax (+1) 510-865-5255<br />
<strong>QIAGEN</strong> on the Internet<br />
Homepage:<br />
e-mail:<br />
www.qiagen.com<br />
qiagen@qiagen.com