QIAGEN N.V. Annual Report 2001
QIAGEN N.V. Annual Report 2001
QIAGEN N.V. Annual Report 2001

Create successful ePaper yourself
Turn your PDF publications into a flip-book with our unique Google optimized e-Paper software.
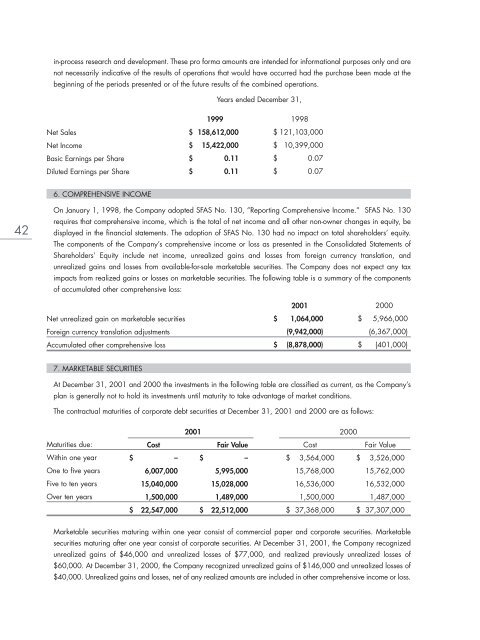
in-process research and development. These pro forma amounts are intended for informational purposes only and are<br />
not necessarily indicative of the results of operations that would have occurred had the purchase been made at the<br />
beginning of the periods presented or of the future results of the combined operations.<br />
Years ended December 31,<br />
Net Sales<br />
Net Income<br />
Basic Earnings per Share<br />
Diluted Earnings per Share<br />
1999<br />
$ 158,612,000<br />
$ 15,422,000<br />
$ 0.11<br />
$ 0.11<br />
1998<br />
$ 121,103,000<br />
$ 10,399,000<br />
$ 0.07<br />
$ 0.07<br />
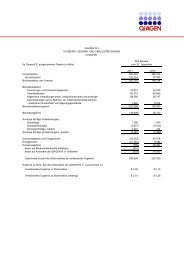
6. COMPREHENSIVE INCOME<br />
42<br />
On January 1, 1998, the Company adopted SFAS No. 130, ”<strong>Report</strong>ing Comprehensive Income.” SFAS No. 130<br />
requires that comprehensive income, which is the total of net income and all other non-owner changes in equity, be<br />
displayed in the financial statements. The adoption of SFAS No. 130 had no impact on total shareholders’ equity.<br />
The components of the Company’s comprehensive income or loss as presented in the Consolidated Statements of<br />
Shareholders’ Equity include net income, unrealized gains and losses from foreign currency translation, and<br />
unrealized gains and losses from available-for-sale marketable securities. The Company does not expect any tax<br />
impacts from realized gains or losses on marketable securities. The following table is a summary of the components<br />
of accumulated other comprehensive loss:<br />
Net unrealized gain on marketable securities<br />
Foreign currency translation adjustments<br />
Accumulated other comprehensive loss<br />
<strong>2001</strong><br />
$ 1,064,000<br />
(9,942,000)<br />
$ (8,878,000)<br />
2000<br />
$ 5,966,000<br />
(6,367,000)<br />
$ (401,000)<br />
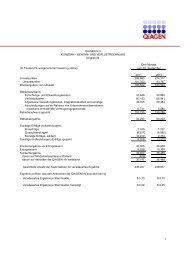
7. MARKETABLE SECURITIES<br />
At December 31, <strong>2001</strong> and 2000 the investments in the following table are classified as current, as the Company’s<br />
plan is generally not to hold its investments until maturity to take advantage of market conditions.<br />
The contractual maturities of corporate debt securities at December 31, <strong>2001</strong> and 2000 are as follows:<br />
Maturities due:<br />
Within one year<br />
One to five years<br />
Five to ten years<br />
Over ten years<br />
Cost<br />
$ –<br />
6,007,000<br />
15,040,000<br />
1,500,000<br />
$ 22,547,000<br />
<strong>2001</strong> 2000<br />
Fair Value<br />
Cost<br />
Fair Value<br />
$ –<br />
$ 3,564,000 $ 3,526,000<br />
5,995,000<br />
15,768,000 15,762,000<br />
15,028,000<br />
16,536,000 16,532,000<br />
1,489,000<br />
1,500,000 1,487,000<br />
$ 22,512,000<br />
$ 37,368,000 $ 37,307,000<br />
Marketable securities maturing within one year consist of commercial paper and corporate securities. Marketable<br />
securities maturing after one year consist of corporate securities. At December 31, <strong>2001</strong>, the Company recognized<br />
unrealized gains of $46,000 and unrealized losses of $77,000, and realized previously unrealized losses of<br />
$60,000. At December 31, 2000, the Company recognized unrealized gains of $146,000 and unrealized losses of<br />
$40,000. Unrealized gains and losses, net of any realized amounts are included in other comprehensive income or loss.