QIAGEN N.V. Annual Report 2001
QIAGEN N.V. Annual Report 2001
QIAGEN N.V. Annual Report 2001

Create successful ePaper yourself
Turn your PDF publications into a flip-book with our unique Google optimized e-Paper software.
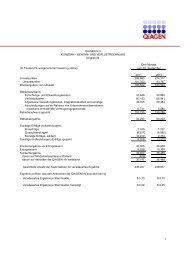
Net sales are attributed to countries based on the location of the Company’s subsidiary. During <strong>2001</strong>, 2000 and<br />
1999, no single customer represented more than ten percent of consolidated net sales. United States export sales did<br />
not exceed ten percent of consolidated net sales during fiscal <strong>2001</strong>, 2000 or 1999.<br />
<strong>2001</strong><br />
2000<br />
1999<br />
Intersegment Sales<br />
Germany<br />
$ (80,277,000)<br />
$(70,359,000)<br />
$(54,932,000)<br />
United States<br />
(5,198,000)<br />
(2,744,000)<br />
(2,402,000)<br />
Switzerland<br />
(15,752,000)<br />
(11,496,000)<br />
(4,332,000)<br />
Japan<br />
(797,000)<br />
(3,893,000)<br />
–<br />
Other Countries<br />
–<br />
(55,000)<br />
–<br />
Total<br />
$(102,024,000)<br />
$(88,547,000)<br />
$(61,666,000)<br />
54<br />
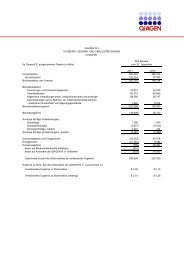
All intersegment sales are accounted for by a formula based on local list prices and eliminated in consolidation.<br />
<strong>2001</strong><br />
2000<br />
1999<br />
Operating Income (Loss)<br />
Germany<br />
$ 30,914,000 $ 23,157,000 $ 10,524,000<br />
United States<br />
10,326,000<br />
6,807,000<br />
9,843,000<br />
Switzerland<br />
4,119,000<br />
4,742,000<br />
1,308,000<br />
Japan<br />
5,956,000<br />
3,798,000<br />
1,496,000<br />
United Kingdom<br />
3,566,000<br />
2,431,000<br />
2,102,000<br />
Other Countries<br />
1,174,000<br />
1,288,000<br />
758,000<br />
The Netherlands<br />
(2,611,000)<br />
(482,000)<br />
(1,596,000)<br />
Subtotal<br />
53,444,000<br />
41,741,000<br />
24,435,000<br />
Intersegment elimination<br />
32,000<br />
(5,208,000)<br />
(1,087,000)<br />
Total<br />
$ 53,476,000 $ 36,533,000 $ 23,348,000<br />
The Netherlands component of operating income (loss) is primarily general and administrative expenses. The<br />
intersegment elimination represents the elimination of intercompany profit.<br />
<strong>2001</strong><br />
2000<br />
1999<br />
Depreciation and Amortization<br />
Germany<br />
$ 6,926,000<br />
$ 5,482,000<br />
$ 4,909,000<br />
United States<br />
5,764,000<br />
3,965,000<br />
2,418,000<br />
Switzerland<br />
371,000<br />
269,000<br />
229,000<br />
Japan<br />
1,614,000<br />
1,065,000<br />
627,000<br />
United Kingdom<br />
107,000<br />
103,000<br />
146,000<br />
Other Countries<br />
158,000<br />
80,000<br />
82,000<br />
The Netherlands<br />
119,000<br />
102,000<br />
150,000<br />
Total<br />
$ 15,059,000<br />
$ 11,066,000<br />
$ 8,561,000