Technical University Munich Commodities as an Asset Class - risklab
Technical University Munich Commodities as an Asset Class - risklab
Technical University Munich Commodities as an Asset Class - risklab

You also want an ePaper? Increase the reach of your titles
YUMPU automatically turns print PDFs into web optimized ePapers that Google loves.
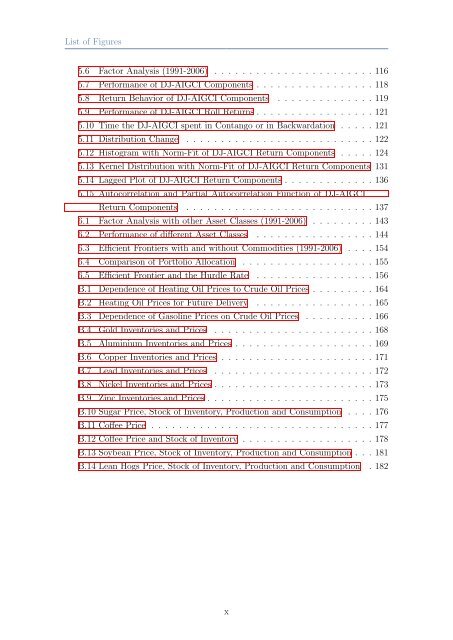
List of Figures<br />
5.6 Factor Analysis (1991-2006) . . . . . . . . . . . . . . . . . . . . . . . 116<br />
5.7 Perform<strong>an</strong>ce of DJ-AIGCI Components . . . . . . . . . . . . . . . . . 118<br />
5.8 Return Behavior of DJ-AIGCI Components . . . . . . . . . . . . . . 119<br />
5.9 Perform<strong>an</strong>ce of DJ-AIGCI Roll Returns . . . . . . . . . . . . . . . . . 121<br />
5.10 Time the DJ-AIGCI spent in Cont<strong>an</strong>go or in Backwardation . . . . . 121<br />
5.11 Distribution Ch<strong>an</strong>ge . . . . . . . . . . . . . . . . . . . . . . . . . . . 122<br />
5.12 Histogram with Norm-Fit of DJ-AIGCI Return Components . . . . . 124<br />
5.13 Kernel Distribution with Norm-Fit of DJ-AIGCI Return Components 131<br />
5.14 Lagged Plot of DJ-AIGCI Return Components . . . . . . . . . . . . . 136<br />
5.15 Autocorrelation <strong>an</strong>d Partial Autocorrelation Function of DJ-AIGCI<br />
Return Components . . . . . . . . . . . . . . . . . . . . . . . . . . . 137<br />
6.1 Factor Analysis with other <strong>Asset</strong> Cl<strong>as</strong>ses (1991-2006) . . . . . . . . . 143<br />
6.2 Perform<strong>an</strong>ce of different <strong>Asset</strong> Cl<strong>as</strong>ses . . . . . . . . . . . . . . . . . 144<br />
6.3 Efficient Frontiers with <strong>an</strong>d without <strong>Commodities</strong> (1991-2006) . . . . 154<br />
6.4 Comparison of Portfolio Allocation . . . . . . . . . . . . . . . . . . . 155<br />
6.5 Efficient Frontier <strong>an</strong>d the Hurdle Rate . . . . . . . . . . . . . . . . . 156<br />
B.1 Dependence of Heating Oil Prices to Crude Oil Prices . . . . . . . . . 164<br />
B.2 Heating Oil Prices for Future Delivery . . . . . . . . . . . . . . . . . 165<br />
B.3 Dependence of G<strong>as</strong>oline Prices on Crude Oil Prices . . . . . . . . . . 166<br />
B.4 Gold Inventories <strong>an</strong>d Prices . . . . . . . . . . . . . . . . . . . . . . . 168<br />
B.5 Aluminium Inventories <strong>an</strong>d Prices . . . . . . . . . . . . . . . . . . . . 169<br />
B.6 Copper Inventories <strong>an</strong>d Prices . . . . . . . . . . . . . . . . . . . . . . 171<br />
B.7 Lead Inventories <strong>an</strong>d Prices . . . . . . . . . . . . . . . . . . . . . . . 172<br />
B.8 Nickel Inventories <strong>an</strong>d Prices . . . . . . . . . . . . . . . . . . . . . . . 173<br />
B.9 Zinc Inventories <strong>an</strong>d Prices . . . . . . . . . . . . . . . . . . . . . . . . 175<br />
B.10 Sugar Price, Stock of Inventory, Production <strong>an</strong>d Consumption . . . . 176<br />
B.11 Coffee Price . . . . . . . . . . . . . . . . . . . . . . . . . . . . . . . . 177<br />
B.12 Coffee Price <strong>an</strong>d Stock of Inventory . . . . . . . . . . . . . . . . . . . 178<br />
B.13 Soybe<strong>an</strong> Price, Stock of Inventory, Production <strong>an</strong>d Consumption . . . 181<br />
B.14 Le<strong>an</strong> Hogs Price, Stock of Inventory, Production <strong>an</strong>d Consumption . 182<br />
x