Tidal Current Effects on Support Structure Loading
Tidal Current Effects on Support Structure Loading
Tidal Current Effects on Support Structure Loading
You also want an ePaper? Increase the reach of your titles
YUMPU automatically turns print PDFs into web optimized ePapers that Google loves.
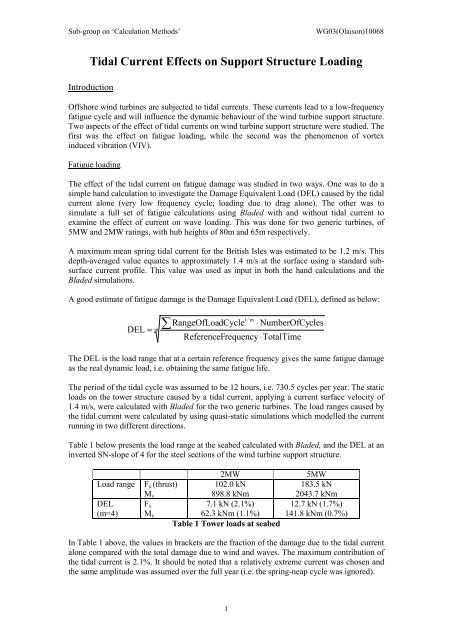
Sub-group <strong>on</strong> ‘Calculati<strong>on</strong> Methods’<br />
WG03(Olais<strong>on</strong>)10068<br />
<str<strong>on</strong>g>Tidal</str<strong>on</strong>g> <str<strong>on</strong>g>Current</str<strong>on</strong>g> <str<strong>on</strong>g>Effects</str<strong>on</strong>g> <strong>on</strong> <strong>Support</strong> <strong>Structure</strong> <strong>Loading</strong><br />
Introducti<strong>on</strong><br />
Offshore wind turbines are subjected to tidal currents. These currents lead to a low-frequency<br />
fatigue cycle and will influence the dynamic behaviour of the wind turbine support structure.<br />
Two aspects of the effect of tidal currents <strong>on</strong> wind turbine support structure were studied. The<br />
first was the effect <strong>on</strong> fatigue loading, while the sec<strong>on</strong>d was the phenomen<strong>on</strong> of vortex<br />
induced vibrati<strong>on</strong> (VIV).<br />
Fatigue loading<br />
The effect of the tidal current <strong>on</strong> fatigue damage was studied in two ways. One was to do a<br />
simple hand calculati<strong>on</strong> to investigate the Damage Equivalent Load (DEL) caused by the tidal<br />
current al<strong>on</strong>e (very low frequency cycle; loading due to drag al<strong>on</strong>e). The other was to<br />
simulate a full set of fatigue calculati<strong>on</strong>s using Bladed with and without tidal current to<br />
examine the effect of current <strong>on</strong> wave loading. This was d<strong>on</strong>e for two generic turbines, of<br />
5MW and 2MW ratings, with hub heights of 80m and 65m respectively.<br />
A maximum mean spring tidal current for the British Isles was estimated to be 1.2 m/s. This<br />
depth-averaged value equates to approximately 1.4 m/s at the surface using a standard subsurface<br />
current profile. This value was used as input in both the hand calculati<strong>on</strong>s and the<br />
Bladed simulati<strong>on</strong>s.<br />
A good estimate of fatigue damage is the Damage Equivalent Load (DEL), defined as below:<br />
DEL<br />
∑ = m<br />
RangeOfLoadCycle<br />
1/ m<br />
⋅ NumberOfCycles<br />
ReferenceFrequency⋅TotalTime<br />
The DEL is the load range that at a certain reference frequency gives the same fatigue damage<br />
as the real dynamic load, i.e. obtaining the same fatigue life.<br />
The period of the tidal cycle was assumed to be 12 hours, i.e. 730.5 cycles per year. The static<br />
loads <strong>on</strong> the tower structure caused by a tidal current, applying a current surface velocity of<br />
1.4 m/s, were calculated with Bladed for the two generic turbines. The load ranges caused by<br />
the tidal current were calculated by using quasi-static simulati<strong>on</strong>s which modelled the current<br />
running in two different directi<strong>on</strong>s.<br />
Table 1 below presents the load range at the seabed calculated with Bladed, and the DEL at an<br />
inverted SN-slope of 4 for the steel secti<strong>on</strong>s of the wind turbine support structure.<br />
Load range<br />
DEL<br />
(m=4)<br />
2MW<br />
F x (thrust) 102.0 kN<br />
M y<br />
898.8 kNm<br />
F x<br />
7.1 kN (2.1%)<br />
M y 62.3 kNm (1.1%)<br />
Table 1 Tower loads at seabed<br />
5MW<br />
183.5 kN<br />
2043.7 kNm<br />
12.7 kN (1.7%)<br />
141.8 kNm (0.7%)<br />
In Table 1 above, the values in brackets are the fracti<strong>on</strong> of the damage due to the tidal current<br />
al<strong>on</strong>e compared with the total damage due to wind and waves. The maximum c<strong>on</strong>tributi<strong>on</strong> of<br />
the tidal current is 2.1%. It should be noted that a relatively extreme current was chosen and<br />
the same amplitude was assumed over the full year (i.e. the spring-neap cycle was ignored).<br />
1
Sub-group <strong>on</strong> ‘Calculati<strong>on</strong> Methods’<br />
WG03(Olais<strong>on</strong>)10068<br />
In order to investigate the impact of the interacti<strong>on</strong> between waves and current, Bladed was<br />
used to calculate lifetime fatigue loads in terms of DELs for the two turbines. Two sets of<br />
simulati<strong>on</strong>s per turbine were c<strong>on</strong>sidered: <strong>on</strong>e including currents; <strong>on</strong>e excluding currents.<br />
Wind and wave loading were included in both sets. Table 2 presents the external input data<br />
for the Bladed simulati<strong>on</strong>s.<br />
Wind speed<br />
[m/s]<br />
Number of hours<br />
per year<br />
Turbulence<br />
intensity [%]<br />
J<strong>on</strong>swap/Piers<strong>on</strong> Moskowitz<br />
wave spectrum<br />
T p [s] H s [m]<br />
4 12.0 5.54 0.52 1139.1<br />
6 12.0 5.43 0.66 1397.2<br />
8 12.0 5.46 0.86 1628.6<br />
10 12.0 5.73 1.11 1601.9<br />
12 12.0 6.17 1.45 1112.4<br />
14 12.0 6.59 1.86 774.3<br />
16 12.0 6.98 2.28 534.0<br />
18 12.0 7.35 2.70 293.7<br />
20 12.0 7.82 3.17 169.1<br />
22 12.0 8.24 3.64 80.1<br />
24 12.0 8.62 4.25 35.6<br />
Table 2 External input data for Bladed simulati<strong>on</strong>s<br />
Table 3 and 4 present the tower seabed DELs for the 2MW and the 5MW turbine<br />
respectively. To calculate these results the tower dynamics were not included in order to show<br />
the change in applied loads due to the tidal current.<br />
Load m Wind and waves Wind, waves, and currents %Change<br />
Tower (seabed) Mx 4 2229.8 2229.8 0.0%<br />
Tower (seabed) My 4 4106.3 4151.7 1.1%<br />
Tower (seabed) Mz 4 469.6 469.6 0.0%<br />
Tower (seabed) Fx 4 286.4 292.4 2.1%<br />
Tower (seabed) Fy 4 27.9 27.9 0.0%<br />
Tower (seabed) Fz 4 27.7 27.7 0.0%<br />
Table 3 2MW Tower seabed DEL comparis<strong>on</strong> – No tower dynamics<br />
Load m Wind and waves Wind, waves, and currents %Change<br />
Tower (seabed) Mx 4 6009.2 6009.2 0.0%<br />
Tower (seabed) My 4 10218.8 10263.1 0.4%<br />
Tower (seabed) Mz 4 1394.2 1394.2 0.0%<br />
Tower (seabed) Fx 4 518.1 523.7 1.1%<br />
Tower (seabed) Fy 4 60.2 60.2 0.0%<br />
Tower (seabed) Fz 4 60.1 60.1 0.0%<br />
Table 4 5MW Tower seabed DEL comparis<strong>on</strong> – No tower dynamics<br />
It appears that the smaller wind turbine is more sensitive to the tidal current. The loads of the<br />
2MW turbine show an increase of Fx of 2.1% and an increase of My of 1.1%. These are<br />
relatively small values, but still not necessarily insignificant.<br />
It is more difficult to provide general results c<strong>on</strong>cerning the influence of the tidal current <strong>on</strong><br />
the dynamic behaviour of the wind turbine, hence to predict the influence <strong>on</strong> fatigue loading.<br />
Tables 5 and 6 presents the seabed DELs for the 2MW and the 5MW turbines respectively<br />
where the tower dynamics were included in the simulati<strong>on</strong>s.<br />
2
Sub-group <strong>on</strong> ‘Calculati<strong>on</strong> Methods’<br />
WG03(Olais<strong>on</strong>)10068<br />
C<strong>on</strong>sidering the 5MW turbine, tower Fx at the seabed decreased by 1.5% (see Table 6) when<br />
the tower dynamics were included, but the same load increased with 1.1% (see Table 4) when<br />
the tower dynamics were excluded. This indicates that due to interacti<strong>on</strong> between the different<br />
structural modes and the dynamic behaviour of the wind and sea this particular fatigue load<br />
decreases due to the currents.<br />
Load m Wind and waves Wind, waves, and currents %Change<br />
Tower (seabed) Mx 4 1286.5 1266.1 -1.6%<br />
Tower (seabed) My 4 5624.5 5671.1 0.8%<br />
Tower (seabed) Mz 4 465.8 465.8 0.0%<br />
Tower (seabed) Fx 4 341.2 344.5 1.0%<br />
Tower (seabed) Fy 4 37.1 36.6 -1.2%<br />
Tower (seabed) Fz 4 25.6 25.6 0.0%<br />
Table 5 2MW Tower seabed DEL comparis<strong>on</strong> – Including tower dynamics<br />
Load m Wind and waves Wind, waves, and currents %Change<br />
Tower (seabed) Mx 4 4087.1 4063.1 -0.6%<br />
Tower (seabed) My 4 18787.6 18960.3 0.9%<br />
Tower (seabed) Mz 4 1381.6 1380.6 -0.1%<br />
Tower (seabed) Fx 4 773.2 761.9 -1.5%<br />
Tower (seabed) Fy 4 162.0 157.5 -2.8%<br />
Tower (seabed) Fz 4 57.8 57.3 -0.9%<br />
Table 6 5MW Tower seabed DEL comparis<strong>on</strong> – Including tower dynamics<br />
Vortex induced vibrati<strong>on</strong><br />
Vortices which form and shed into the flow around the tower structure produce a dynamic<br />
loading up<strong>on</strong> the tower. Vortex induced vibrati<strong>on</strong> (VIV) may occur if the eigen frequency of<br />
the tower is close to the frequency of vortex shedding. The forces due to vortex shedding are<br />
the result of complex fluid dynamic phenomena and are sensitive to a wide range of<br />
parameters which describe the characteristics of the flow and the structure.<br />
The objective of this study was to investigate the possibility of vortex induced vibrati<strong>on</strong><br />
occurring for wind turbine support structures in sea currents, and to give a guideline for how<br />
to avoid it.<br />
The flow speed at which significant vortex induced vibrati<strong>on</strong> may occur generally depends <strong>on</strong><br />
the structural mass and damping and <strong>on</strong> the displaced mass. The n<strong>on</strong>-dimensi<strong>on</strong>al mass<br />
damping parameter k s , combines these influences, and is defined below [1]:<br />
k<br />
s<br />
2⋅<br />
m e<br />
⋅δ<br />
= ρ<br />
2<br />
⋅ D<br />
Where:<br />
m e = the equivalent mass per unit length of the structure<br />
δ = the logarithmic decrement of structural damping<br />
ρ = the density of the fluid<br />
D = the diameter of the structure<br />
Using data for the two generic wind turbines, and a density of the sea water of 1030kg/m 3 , the<br />
k s values for the two generic machines are 0.017 and 0.020 for the 2MW and the 5MW<br />
machines respectively.<br />
3
Sub-group <strong>on</strong> ‘Calculati<strong>on</strong> Methods’<br />
WG03(Olais<strong>on</strong>)10068<br />
The <strong>on</strong>set of vortex induced in-line vibrati<strong>on</strong> occurs between U/f n D = 1.0 and 1.6, for small<br />
mass damping parameters (k s


