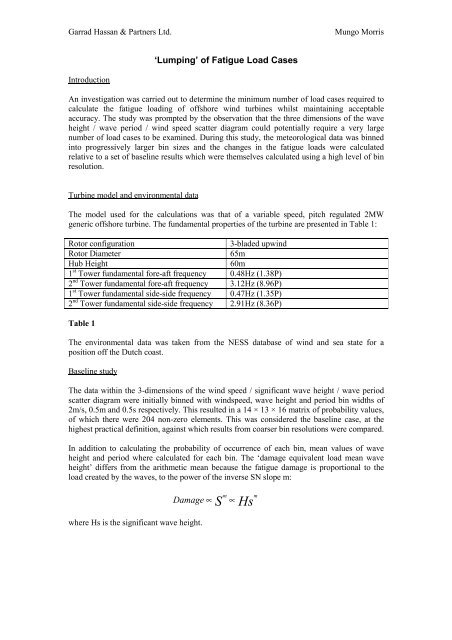
'Lumping' of Fatigue Load Cases
'Lumping' of Fatigue Load Cases
'Lumping' of Fatigue Load Cases
You also want an ePaper? Increase the reach of your titles
YUMPU automatically turns print PDFs into web optimized ePapers that Google loves.
Garrad Hassan & Partners Ltd.<br />
Mungo Morris<br />
‘Lumping’ <strong>of</strong> <strong>Fatigue</strong> <strong>Load</strong> <strong>Cases</strong><br />
Introduction<br />
An investigation was carried out to determine the minimum number <strong>of</strong> load cases required to<br />
calculate the fatigue loading <strong>of</strong> <strong>of</strong>fshore wind turbines whilst maintaining acceptable<br />
accuracy. The study was prompted by the observation that the three dimensions <strong>of</strong> the wave<br />
height / wave period / wind speed scatter diagram could potentially require a very large<br />
number <strong>of</strong> load cases to be examined. During this study, the meteorological data was binned<br />
into progressively larger bin sizes and the changes in the fatigue loads were calculated<br />
relative to a set <strong>of</strong> baseline results which were themselves calculated using a high level <strong>of</strong> bin<br />
resolution.<br />
Turbine model and environmental data<br />
The model used for the calculations was that <strong>of</strong> a variable speed, pitch regulated 2MW<br />
generic <strong>of</strong>fshore turbine. The fundamental properties <strong>of</strong> the turbine are presented in Table 1:<br />
Rotor configuration<br />
3-bladed upwind<br />
Rotor Diameter<br />
65m<br />
Hub Height<br />
60m<br />
1 st Tower fundamental fore-aft frequency 0.48Hz (1.38P)<br />
2 nd Tower fundamental fore-aft frequency 3.12Hz (8.96P)<br />
1 st Tower fundamental side-side frequency 0.47Hz (1.35P)<br />
2 nd Tower fundamental side-side frequency 2.91Hz (8.36P)<br />
Table 1<br />
The environmental data was taken from the NESS database <strong>of</strong> wind and sea state for a<br />
position <strong>of</strong>f the Dutch coast.<br />
Baseline study<br />
The data within the 3-dimensions <strong>of</strong> the wind speed / significant wave height / wave period<br />
scatter diagram were initially binned with windspeed, wave height and period bin widths <strong>of</strong><br />
2m/s, 0.5m and 0.5s respectively. This resulted in a 14 × 13 × 16 matrix <strong>of</strong> probability values,<br />
<strong>of</strong> which there were 204 non-zero elements. This was considered the baseline case, at the<br />
highest practical definition, against which results from coarser bin resolutions were compared.<br />
In addition to calculating the probability <strong>of</strong> occurrence <strong>of</strong> each bin, mean values <strong>of</strong> wave<br />
height and period where calculated for each bin. The ‘damage equivalent load mean wave<br />
height’ differs from the arithmetic mean because the fatigue damage is proportional to the<br />
load created by the waves, to the power <strong>of</strong> the inverse SN slope m:<br />
Damage ∝<br />
where Hs is the significant wave height.<br />
S<br />
m<br />
∝<br />
Hs<br />
m
Garrad Hassan & Partners Ltd.<br />
Mungo Morris<br />
Consequently the equation for the DEL mean wave height is:<br />
Hs =<br />
⎛<br />
⎜<br />
⎝<br />
1<br />
N<br />
N<br />
∑ i = 1<br />
In contrast, for the wave period, the fatigue damage is approximately proportional to the<br />
number <strong>of</strong> cycles, and the appropriate mean is therefore the arithmetic mean <strong>of</strong> the wave<br />
periods within each bin * . In addition, the mean wind speed within each bin was not calculated<br />
– all values that fell between 5 and 7m/s, for example, were considered to have a mean wind<br />
speed <strong>of</strong> 6m/s. This is consistent with the normal approach for simulating wind speed<br />
distributions for onshore turbines.<br />
Damage equivalent loads were calculated at key points in the turbine structure for inverse SN<br />
slope values <strong>of</strong> 4, 6, 8 and 10 and assuming a frequency <strong>of</strong> 1Hz.<br />
Having calculated the initial fatigue loads using the probability distribution <strong>of</strong> the 204<br />
simulations, the same process was then repeated for increasingly larger bin sizes <strong>of</strong> wave<br />
height and period. In all cases, the wind speed bin size was kept at 2m/s to reflect the current<br />
practice for onshore wind distribution simulation. The full range <strong>of</strong> bin sizes covered are<br />
shown in Figure.1.<br />
Hs<br />
m<br />
i<br />
1<br />
m<br />
⎞<br />
⎟<br />
⎠<br />
3<br />
2.5<br />
Wave period bin size [s]<br />
2<br />
1.5<br />
1<br />
0.5<br />
0<br />
0 0.5 1 1.5 2 2.5 3<br />
Significant wave height bin size [m]<br />
Figure 1. Bin size combinations<br />
When comparing the fatigue loads generated by these ‘coarser’ bin sizes with the original<br />
base-line loads, it became apparent that the reduction in resolution in bin sizes had very little<br />
effect on the final fatigue loads generated.<br />
* In Hindsight it would have been more correct to have averaged (1/Period), but this would not change<br />
the conclusions significantly.
Garrad Hassan & Partners Ltd.<br />
Mungo Morris<br />
To confirm the above observations, three bin resolutions were considered in greater detail<br />
(See Table 2 and Figure 2). The final set <strong>of</strong> simulations, Series 3, is the extreme case which<br />
features only one simulation per wind speed – i.e. the height and period bin size covers the<br />
whole range <strong>of</strong> data resulting in one DEL mean value <strong>of</strong> wave height and period for all<br />
simulations.<br />
Wind speed bin<br />
width (m/s)<br />
Wave height bin<br />
width (m)<br />
Wave period bin<br />
width (s)<br />
Number <strong>of</strong><br />
simulations<br />
Series 1 2 0.5 0.5 204<br />
Series 2 2 2.5 2.5 39<br />
Series 3 2 6.0 6.5 14<br />
Table 2: Simulation types<br />
Figure 2: Comparison <strong>of</strong> bin sizes<br />
.<br />
The results <strong>of</strong> this analysis are presented in tables 3 to 5 below. Due to the large quantity <strong>of</strong><br />
data generated, the decision was taken to analyse only the loads which were likely to be<br />
affected by waves running in a fore–aft direction.
Garrad Hassan & Partners Ltd.<br />
Mungo Morris<br />
Inverse SN slope<br />
4 6 8 10<br />
Blade 1 Root My 228.34 348.69 465.42 571.40<br />
Blade 1 Root Fx 12.09 17.88 23.44 28.61<br />
Blade 1 Flapwise moment 234.48 358.66 475.99 582.70<br />
Blade 1 Flapwise force 13.10 19.47 25.08 30.08<br />
Rotating hub Fx 22.36 35.61 46.59 55.88<br />
Tower Base My 2419.55 3550.89 4590.65 5508.01<br />
Tower Base Fx 189.26 285.18 387.43 495.88<br />
Tower Top My 246.41 336.75 429.09 517.14<br />
Tower Top Fx 25.09 40.11 53.11 64.55<br />
Table 3: Series 1 - <strong>Fatigue</strong> loads for wave height and period bin sizes <strong>of</strong> 0.5m and 0.5s<br />
respectively (in kNm)<br />
Inverse SN slope<br />
4 6 8 10<br />
Blade 1 Root My 228.38 348.74 465.46 571.41<br />
Blade 1 Root Fx 12.09 17.88 23.45 28.62<br />
Blade 1 Flapwise moment 234.47 358.66 476.02 582.74<br />
Blade 1 Flapwise force 13.10 19.47 25.08 30.08<br />
Rotating hub Fx 22.36 35.60 46.56 55.84<br />
Tower Base My 2424.67 3544.61 4566.12 5468.30<br />
Tower Base Fx 191.04 285.12 382.86 486.14<br />
Tower Top My 246.42 336.76 429.06 517.10<br />
Tower Top Fx 25.10 40.12 53.13 64.61<br />
Table 4: Series 2 - <strong>Fatigue</strong> loads for wave height and period bin sizes <strong>of</strong> 2.5m and 2.5s<br />
respectively (in kNm)<br />
Inverse SN slope<br />
4 6 8 10<br />
Blade 1 Root My 228.35 348.70 465.43 571.40<br />
Blade 1 Root Fx 12.09 17.88 23.44 28.60<br />
Blade 1 Flapwise moment 234.45 358.62 475.96 582.67<br />
Blade 1 Flapwise force 13.10 19.47 25.08 30.07<br />
Rotating hub Fx 22.35 35.60 46.56 55.85<br />
Tower Base My 2411.54 3541.25 4595.88 5543.22<br />
Tower Base Fx 192.69 282.88 372.23 461.06<br />
Tower Top My 246.49 336.83 429.06 516.94<br />
Tower Top Fx 25.04 40.03 53.01 64.45<br />
Table 5: Series 3 - <strong>Fatigue</strong> loads for wave height and period bin sizes <strong>of</strong> 7.0m and 8.0s<br />
respectively (in kNm)<br />
Table 6 shows the percentage changes between results for series 2 and series 1, and between<br />
series 3 and series 1. The applicable values <strong>of</strong> inverse SN slope for each load are highlighted.<br />
It can be seen that the variation in DEL, even when all the wave heights and periods are
Garrad Hassan & Partners Ltd.<br />
Mungo Morris<br />
condensed into single values at each wind speed, never exceeds 2% (Tower Base Fx), and<br />
many other loads are almost unaffected.<br />
Series 2 Series 3<br />
4 6 8 10 4 6 8 10<br />
Blade 1 Root My 0.02 0.02 0.01 0.00 0.00 0.00 0.00 0.00<br />
Blade 1 Root Fx -0.01 0.01 0.03 0.04 -0.01 -0.02 -0.02 -0.01<br />
Blade 1 Flap moment 0.00 0.00 0.01 0.01 -0.01 -0.01 0.00 -0.01<br />
Blade 1 Flap force 0.00 0.00 -0.01 -0.01 0.00 -0.02 -0.02 -0.02<br />
Rotating hub Fx 0.00 -0.04 -0.06 -0.06 -0.02 -0.04 -0.05 -0.05<br />
Tower Base My 0.21 -0.18 -0.53 -0.72 -0.33 -0.27 0.11 0.64<br />
Tower Base Fx 0.94 -0.02 -1.18 -1.96 1.81 -0.81 -3.92 -7.02<br />
Tower Top My 0.01 0.00 -0.01 -0.01 0.03 0.02 -0.01 -0.04<br />
Tower Top Fx 0.03 0.02 0.04 0.09 -0.19 -0.20 -0.19 -0.16<br />
Table 6: Variation in load from original base-line case (percent)<br />
A possible explanation for the very small changes in fatigue loads is that the wave loading<br />
itself makes a very small contribution to the total fatigue loading. To check this possibility,<br />
two simulations, one with waves present and one without waves, were run and damage<br />
equivalent loads calculated. If there was negligible difference between the loads generated by<br />
both runs then this would be evidence that the wave action had an insignificant affect on the<br />
fatigue loads. These simulations were performed at a wind speed <strong>of</strong> 6.56m/s (the mode <strong>of</strong> the<br />
wind speed distribution) and, in one case, with a significant wave height <strong>of</strong> 1.0m and a peak<br />
spectral period <strong>of</strong> 3.9s. The percentage increases in tower loads due to the inclusion <strong>of</strong> the<br />
waves is presented in table 7.<br />
Inverse SN slope<br />
4 6 8 10<br />
Tower Base My 8.11% 9.83% 10.11% 10.19%<br />
Tower Base Fx 279.64% 270.51% 243.94% 229.54%<br />
Tower Top My 0.02% 0.01% 0.00% 0.00%<br />
Tower Top Fx -0.12% -0.04% -0.01% 0.00%<br />
Table 7: <strong>Fatigue</strong> load increase due to presence <strong>of</strong> wave<br />
It can be seen from Table 7 that, although all tower top loads are little affected by the<br />
presence <strong>of</strong> the wave in the simulation, the tower base loads are strongly affected – the foreaft<br />
tower base force in particular. From Table 6 one can see that this is the same load that<br />
varied by only 1.8% when all 204 initial simulations were ‘lumped’ into 1 value <strong>of</strong> wave<br />
height and period for all simulations. One must therefore conclude that, despite having a<br />
strong influence on the fatigue loading <strong>of</strong> the turbine, the effect <strong>of</strong> waves can be simply and<br />
accurately modelled by using large bin size means <strong>of</strong> the wave height and period in all<br />
simulations.


