'Lumping' of Fatigue Load Cases
'Lumping' of Fatigue Load Cases
'Lumping' of Fatigue Load Cases

Create successful ePaper yourself
Turn your PDF publications into a flip-book with our unique Google optimized e-Paper software.
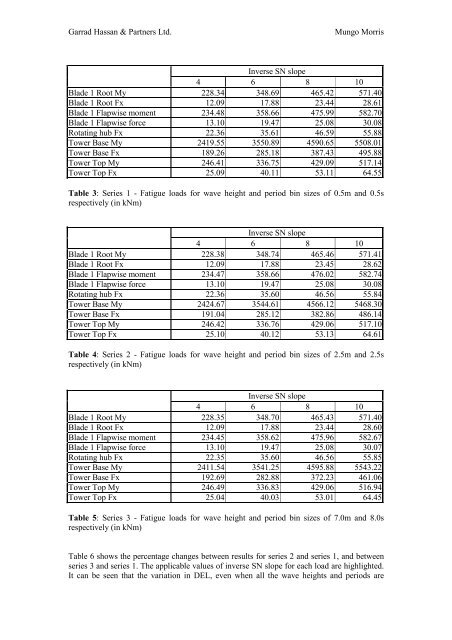
Garrad Hassan & Partners Ltd.<br />
Mungo Morris<br />
Inverse SN slope<br />
4 6 8 10<br />
Blade 1 Root My 228.34 348.69 465.42 571.40<br />
Blade 1 Root Fx 12.09 17.88 23.44 28.61<br />
Blade 1 Flapwise moment 234.48 358.66 475.99 582.70<br />
Blade 1 Flapwise force 13.10 19.47 25.08 30.08<br />
Rotating hub Fx 22.36 35.61 46.59 55.88<br />
Tower Base My 2419.55 3550.89 4590.65 5508.01<br />
Tower Base Fx 189.26 285.18 387.43 495.88<br />
Tower Top My 246.41 336.75 429.09 517.14<br />
Tower Top Fx 25.09 40.11 53.11 64.55<br />
Table 3: Series 1 - <strong>Fatigue</strong> loads for wave height and period bin sizes <strong>of</strong> 0.5m and 0.5s<br />
respectively (in kNm)<br />
Inverse SN slope<br />
4 6 8 10<br />
Blade 1 Root My 228.38 348.74 465.46 571.41<br />
Blade 1 Root Fx 12.09 17.88 23.45 28.62<br />
Blade 1 Flapwise moment 234.47 358.66 476.02 582.74<br />
Blade 1 Flapwise force 13.10 19.47 25.08 30.08<br />
Rotating hub Fx 22.36 35.60 46.56 55.84<br />
Tower Base My 2424.67 3544.61 4566.12 5468.30<br />
Tower Base Fx 191.04 285.12 382.86 486.14<br />
Tower Top My 246.42 336.76 429.06 517.10<br />
Tower Top Fx 25.10 40.12 53.13 64.61<br />
Table 4: Series 2 - <strong>Fatigue</strong> loads for wave height and period bin sizes <strong>of</strong> 2.5m and 2.5s<br />
respectively (in kNm)<br />
Inverse SN slope<br />
4 6 8 10<br />
Blade 1 Root My 228.35 348.70 465.43 571.40<br />
Blade 1 Root Fx 12.09 17.88 23.44 28.60<br />
Blade 1 Flapwise moment 234.45 358.62 475.96 582.67<br />
Blade 1 Flapwise force 13.10 19.47 25.08 30.07<br />
Rotating hub Fx 22.35 35.60 46.56 55.85<br />
Tower Base My 2411.54 3541.25 4595.88 5543.22<br />
Tower Base Fx 192.69 282.88 372.23 461.06<br />
Tower Top My 246.49 336.83 429.06 516.94<br />
Tower Top Fx 25.04 40.03 53.01 64.45<br />
Table 5: Series 3 - <strong>Fatigue</strong> loads for wave height and period bin sizes <strong>of</strong> 7.0m and 8.0s<br />
respectively (in kNm)<br />
Table 6 shows the percentage changes between results for series 2 and series 1, and between<br />
series 3 and series 1. The applicable values <strong>of</strong> inverse SN slope for each load are highlighted.<br />
It can be seen that the variation in DEL, even when all the wave heights and periods are