Annual Report 2006 - Rheinland Pfalz Bank
Annual Report 2006 - Rheinland Pfalz Bank
Annual Report 2006 - Rheinland Pfalz Bank

You also want an ePaper? Increase the reach of your titles
YUMPU automatically turns print PDFs into web optimized ePapers that Google loves.
Notes LRP Group<br />
LRP <strong>2006</strong><br />
53<br />
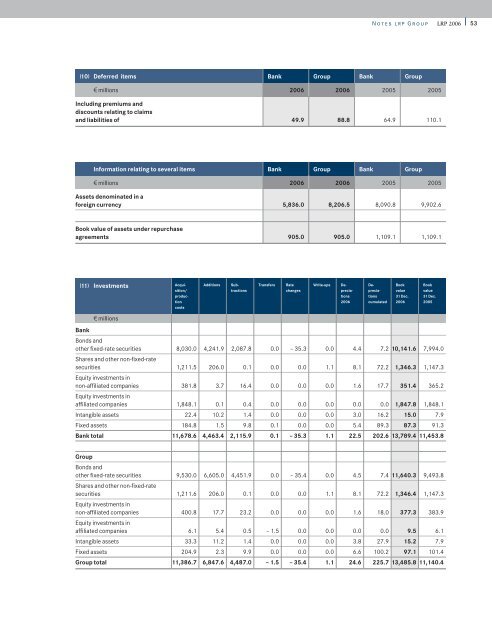
(10) Deferred items <strong>Bank</strong> Group <strong>Bank</strong> Group<br />
1 millions <strong>2006</strong> <strong>2006</strong> 2005 2005<br />
Including premiums and<br />
discounts relating to claims<br />
and liabilities of 49.9 88.8 64.9 110.1<br />
Information relating to several items <strong>Bank</strong> Group <strong>Bank</strong> Group<br />
1 millions <strong>2006</strong> <strong>2006</strong> 2005 2005<br />
Assets denominated in a<br />
foreign currency 5,836.0 8,206.5 8,090.8 9,902.6<br />
Book value of assets under repurchase<br />
agreements 905.0 905.0 1,109.1 1,109.1<br />
(11) Investments Acqui- Additions Sub- Transfers Rate Write-ups De- De- Book Book<br />
sition/ tractions changes precia- precia- value value<br />
produc- tions tions 31 Dec. 31 Dec.<br />
tion <strong>2006</strong> cumulated <strong>2006</strong> 2005<br />
costs<br />
1 millions<br />
<strong>Bank</strong><br />
Bonds and<br />
other fixed-rate securities 8,030.0 4,241.9 2,087.8 0.0 – 35.3 0.0 4.4 7.2 10,141.6 7,994.0<br />
Shares and other non-fixed-rate<br />
securities 1,211.5 206.0 0.1 0.0 0.0 1.1 8.1 72.2 1,346.3 1,147.3<br />
Equity investments in<br />
non-affiliated companies 381.8 3.7 16.4 0.0 0.0 0.0 1.6 17.7 351.4 365.2<br />
Equity investments in<br />
affiliated companies 1,848.1 0.1 0.4 0.0 0.0 0.0 0.0 0.0 1,847.8 1,848.1<br />
Intangible assets 22.4 10.2 1.4 0.0 0.0 0.0 3.0 16.2 15.0 7.9<br />
Fixed assets 184.8 1.5 9.8 0.1 0.0 0.0 5.4 89.3 87.3 91.3<br />
<strong>Bank</strong> total 11,678.6 4,463.4 2,115.9 0.1 – 35.3 1.1 22.5 202.6 13,789.4 11,453.8<br />
Group<br />
Bonds and<br />
other fixed-rate securities 9,530.0 6,605.0 4,451.9 0.0 – 35.4 0.0 4.5 7.4 11,640.3 9,493.8<br />
Shares and other non-fixed-rate<br />
securities 1,211.6 206.0 0.1 0.0 0.0 1.1 8.1 72.2 1,346.4 1,147.3<br />
Equity investments in<br />
non-affiliated companies 400.8 17.7 23.2 0.0 0.0 0.0 1.6 18.0 377.3 383.9<br />
Equity investments in<br />
affiliated companies 6.1 5.4 0.5 – 1.5 0.0 0.0 0.0 0.0 9.5 6.1<br />
Intangible assets 33.3 11.2 1.4 0.0 0.0 0.0 3.8 27.9 15.2 7.9<br />
Fixed assets 204.9 2.3 9.9 0.0 0.0 0.0 6.6 100.2 97.1 101.4<br />
Group total 11,386.7 6,847.6 4,487.0 – 1.5 – 35.4 1.1 24.6 225.7 13,485.8 11,140.4